

Abstract
New techniques have identified a wide range of organisms with the capacity to carry out biological nitrogen fixation (BNF)—greatly expanding our appreciation of the diversity and ubiquity of N fixers—but our understanding of the rates and controls of BNF at ecosystem and global scales has not advanced at the same pace. Nevertheless, determining rates and controls of BNF is crucial to placing anthropogenic changes to the N cycle in context, and to understanding, predicting and managing many aspects of global environmental change. Here, we estimate terrestrial BNF for a pre-industrial world by combining information on N fluxes with 15N relative abundance data for terrestrial ecosystems. Our estimate is that pre-industrial N fixation was 58 (range of 40–100) Tg N fixed yr−1; adding conservative assumptions for geological N reduces our best estimate to 44 Tg N yr−1. This approach yields substantially lower estimates than most recent calculations; it suggests that the magnitude of human alternation of the N cycle is substantially larger than has been assumed.
Keywords: biogeochemistry, biological nitrogen fixation, nitrogen cycle
1. Introduction
Prior to the industrial revolution, biological nitrogen fixation (BNF) was the dominant source of reactive N to the biosphere. More recently, human activity has increased the creation of reactive N substantially, both intentionally through the synthesis of industrial N fertilizers and the cultivation of crops that support BNF, and also unintentionally via fossil fuel combustion [1,2]. To put the magnitude and consequences of this human perturbation to the N cycle in context, we need to understand background rates of BNF—and we need to understand the ecological regulation of BNF in a rapidly changing world. Our knowledge of the rates and regulation of BNF affects our ability to understand, predict and ultimately manage many components of human-caused environmental change, from increasing atmospheric CO2 and consequent climate change, to alterations of other major biogeochemical cycles, to aspects of land use change. For example, Hungate et al. [3] calculated that Intergovernmental Panel on Climate Change-based carbon (C) storage scenarios for terrestrial ecosystems in 2100 would require an additional 2.3–37.5 Pg of N, whereas reactive N supply would only increase by 1.2–6.1 Pg of N. Therefore, N supply will likely be insufficient to support predicted levels of biological C sequestration unless increasing atmospheric CO2 drives a substantial increase in BNF. On finer spatial and temporal scales, enrichment experiments in terrestrial ecosystems frequently show that elevated CO2 enhances primary production and C storage in the short term, but progressive N limitation ultimately constrains productivity and C storage [4,5], in large part because BNF generally does not replenish all of the reactive N that is sequestered in accumulating organic matter under elevated CO2.
From an ecological perspective, BNF raises a fundamental question: how can widespread N limitation to primary production, biomass accumulation and other ecosystem processes [6,7] co-occur with the widespread occurrence of organisms capable of acquiring the essentially limitless pool of atmospheric N2 [8,9]? Put another way, why do organisms with the ability to fix N not realize a competitive advantage when N supply limits non-fixers, and as a by-product of their activity reduce N limitation to a marginal and/or transient phenomenon?
In this paper, we address the rates and ecological regulation of BNF. We begin with a brief discussion of the ways that genetic and molecular tools have expanded the list of organisms and symbioses known to carry out BNF. We then draw on recent global N flux estimates and an understanding of N isotopes to propose a new estimate of pre-industrial rates of BNF, the rates that occurred in little-managed ecosystems before the global N cycle was transformed by human activity. It is difficult to assign a latest date to this estimate; 1750 (prior to substantial fossil fuel N fixation) is a reasonable possibility, though certainly N fixation in many regions had been altered by human land use at that time. Next, we discuss observations and experiments that provide insights into the patterns and controls of BNF, as these operate on genetic, physiological and ecological levels [10–12]. Finally, we summarize results from several models that offer powerful means for addressing ecosystem and regional controls of BNF on land. While the control of BNF in marine ecosystems represents a lively, important and controversial area of research, our analysis is confined to terrestrial systems. Moreover, our focus is on BNF in little-managed terrestrial ecosystems; we see little that can be added to Herridge et al.'s [13] thorough analysis of BNF in agricultural and intensively grazed ecosystems.
2. The growing diversity of recognized nitrogen fixers
Biological N fixation reflects the activity of a phylogenetically diverse list of bacteria, archaea and symbioses. Genetic and molecular techniques now provide efficient means to identify organisms with the potential to fix N2, and the application of these techniques in an array of environments has broadened considerably our understanding of the suite of organisms that can carry out BNF. In the past, most evaluations of terrestrial BNF considered rhizobial and actinorhizal symbioses; free-living and symbiotic cyanobacterial fixers; and free-living and symbiotic (or associated) heterotrophic bacteria. More recent research has demonstrated that a dizzying array of microbes are capable of BNF, including archaea as well as many previously undiscovered bacteria [14]. Even the best-known system, the nodulated legume/rhizobial symbiosis, has been found to be much more diverse than previously understood—with new discoveries ranging from additional microbial partners (e.g. Burkholderia) that nodulate legumes and fix N2 effectively [15] to a diversity of pathways by which nodules themselves are initiated and infected [16].
Our expanded ability to identify organisms capable of BNF has outpaced increases in our understanding of how BNF is regulated in these different organisms. Given that the genetic and biochemical machinery that carries out BNF is highly conserved across the broad array of organisms that express it, the environmental and physiological conditions that could constrain BNF are similar across taxa. These conditions include low levels of available energy, high levels of O2 at the locus of fixation, high levels of reactive N in the milieu and low availability of other resources (especially phosphorus (P), iron (Fe), potassium (K) and molybdenum (Mo)). However, predicting which subset of these controls is most relevant in different taxa and environments remains a challenge. For example, there is evidence for variation in how reactive N affects BNF across N-fixing symbioses between plants and bacteria. Unlike relatively well-known legume/rhizobial systems, some actinorhizal symbioses (which involve a diverse group of angiosperms that form nodulated symbioses with Frankia) appear to have weak or no feedback regulation from reactive N in the environment; they continue to nodulate and fix N even when N availability in the environment is high [17–19]. Some legumes also appear to experience weak feedback from reactive N to rates of fixation [20]. How these variations and others map onto the broad diversity of recently identified N fixers is not yet known—and we are not likely to find out as long as most research into symbiotic BNF focuses on two model legume species [21].
3. Biological nitrogen fixation in terrestrial ecosystems
In this section, we propose a new estimate of pre-industrial BNF in terrestrial ecosystems. The most comprehensive global estimate of BNF to date was carried out by Cleveland et al. [22], who proposed regional and global estimates based on scaling up empirical measurements of BNF. They applied average rates of BNF measured in empirical studies within each biome to the biome as a whole, and assumed a range of values for the cover of plants with potential N-fixing symbioses (legumes and actinorhizal species) in each biome. With this approach, they calculated an intermediate (and preferred) estimate for total terrestrial BNF of 195 Tg N yr−1; a later publication [23] that Cleveland co-authored reduced that estimate to 128 Tg N yr−1, largely because any higher estimate suggested too large a contribution of BNF relative to the quantity of N cycling within ecosystems annually. The multiple assumptions and extrapolations underlying these calculations make it difficult to test their validity, but the study did provide a summary of ecosystem-level measurements up to that time.
Unlike the previous estimate [22], our new calculation does not scale up from field-based measurements of BNF. Rather, it assumes a steady state for the pre-industrial terrestrial N cycle and uses estimates and calculations of all major N input and loss fluxes (aside from BNF) to calculate BNF by difference (figure 1). The steady-state assumption is unlikely to be true at local scales, but for this global calculation, it need only hold at large spatial and temporal scales.
Figure 1.
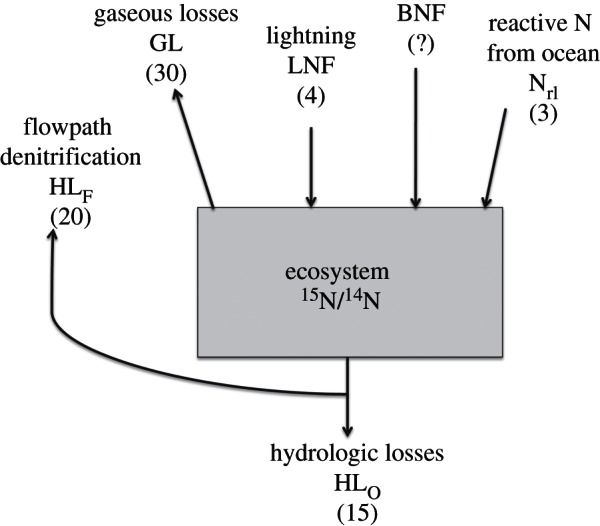
Box diagram for the calculation of terrestrial biological nitrogen fixation (BNF) by difference; values in parentheses are annual fluxes in Tg N. Hydrologic losses to the ocean (HLO) and losses along the flowpath between soils and oceans (HLF), which together constitute total hydrologic losses (HL), are obtained as described in the text. We calculate the fraction of total losses that occur by gaseous pathways (fG) as: (δ15NTB – δ15NI + ɛH)/(ɛH – ɛG), where δ15NTB and δ15NI represent the natural abundance of 15N in the terrestrial biosphere and in N inputs to the terrestrial biosphere, and ɛH and ɛG are the isotope effects on terrestrial N from fractionations associated with hydrologic losses and gaseous losses (GL), respectively. Inputs via lightning (LNF) and atmospheric transport of reactive N from oceans to land (Nrl) are obtained as described in the text. BNF can then be calculated as: HL/(1 – fG) – LNF – Nrl.
The inputs to terrestrial ecosystems we consider initially are BNF, N fixed by lightning and deposited on land (LNF), and atmospheric deposition of reactive N transported from the ocean (Nrl). Losses we consider are hydrologic (HL) and gaseous losses (GL) from land to oceans or gaseous losses to unreactive forms in the atmosphere (N2 and N2O; figure 1). For reactive N, we consider transfers only from the ocean to the land or vice versa as inputs and losses; most emissions of ammonia from terrestrial ecosystems (for example) are rapidly deposited downwind on other terrestrial systems [23], so they do not represent losses from terrestrial ecosystems as a whole.
Considering these fluxes, the steady-state assumption yields
| 3.1 |
N fixed by lightning and deposited on land (LNF) has been estimated to be 4 Tg N yr−1 [24]. There are published estimates for hydrologic N loss from land to the ocean (HLO); for example, Green et al. [25] calculated global HLO = 21 Tg N yr−1 for pre-industrial conditions. However, this and other modern estimates embed and depend on inputs via BNF—the quantity we seek to determine. An alternative approach is to use current land–sea hydrologic fluxes along a gradient of anthropogenic influence to estimate pre-industrial fluxes. Howarth et al. [26,27] identified a strong relationship between net anthropogenic N inputs (NANIs) and N fluxes to the ocean in a large suite of drainages; the y-intercept of this relationship (where NANI = 0) is approximately 100 kg N km−2 in temperate regions. However, tropical forest regions have higher background fluxes of N. Current fluxes (which include some anthropogenic influence) from the Amazon, Orinoco and Congo Rivers are 400–500 kg N km−2. The Amazon River alone accounts for less than 15 per cent of global discharge, and contributes 3.3 Tg N yr−1 to the ocean [26]. If we regard the Amazon N flux as being little-modified by human activity, and if all rivers had N concentrations such as the Amazon, then the pre-industrial N flux would be approximately 22 Tg N yr−1. Given the lower values for N fluxes in temperate regions, we suggest 15 Tg N yr−1 as a central value for pre-industrial HLO.
In addition, a fraction of the N that leaves terrestrial systems via hydrologic pathways is denitrified along the flowpath from below soils to river mouths (flowpath denitrification = HLF; HL = HLO + HLF) [28]. That fraction is poorly constrained, even for current conditions; as low as 25 per cent of current NANI appears at the mouths of rivers [27] (a fraction that includes accretion in terrestrial systems and river and reservoir sediments as well as denitrification). Bouwman et al. [29] calculated that as of 1900, nearly 60 per cent of N lost from terrestrial ecosystems by hydrologic pathways was denitrified along flowpaths from below soils to streams. Therefore, we account for downstream losses via denitrification by adding HLF = 20 Tg N yr−1 (reflecting a nearly 60% loss along flowpaths) to hydrologic losses that reach the ocean, so our central value for HL is 35 Tg N yr−1. However, we suspect that pre-industrial systems probably lost a smaller fraction of N to denitrification along flowpaths, in large part because nitrate was a smaller fraction of total losses [30]; for this reason, our BNF estimate may err on the high side.
The gaseous loss flux from land (GL) is more difficult to determine directly, but calculations based on N isotopes make it possible to estimate the fraction of total losses that are gaseous (fG) at steady state [28,31]. The ratio of stable N isotopes (15N/14N) in the terrestrial biosphere depends on the ratio of 15N/14N in inputs, the degree to which the different loss pathways (hydrologic versus gaseous) fractionate against the heavier isotope and the relative magnitudes of the different loss pathways. At steady state (eqn (3.1) in Houlton & Bai [31]),
| 3.2 |
The data required to evaluate equation (3.2) are δ15NTB and δ15NI, the mean isotopic ratios of the terrestrial biosphere and terrestrial N inputs, respectively, and ɛH and ɛG, the isotope effects associated with hydrologic and gaseous losses, respectively. All of these terms are expressed in per mil notation. With this information and a reasonable estimate of the pre-industrial hydrologic N loss flux, we can calculate the gaseous N loss flux (by definition, fG × (HL + GL) = GL, so GL = HL × fG/(1−fG)). Therefore,
| 3.3 |
Several studies have summarized global patterns in the distribution of soil and plant δ15N as a function of climate (mean annual temperature and precipitation) [32–34]; we use Amundson et al. [33] here because they included soils to 50 cm depth. Houlton & Bai [31] used the information in Amundson et al. [33] to estimate denitrification; following their approach, we used regressions from Amundson et al. [33] and the relative global stocks of plant (3.5 Pg N) and soil (95–140 Pg N) N [35] to estimate δ15NTB. Our analysis differed from Houlton & Bai [31] in two minor ways—we do not exclude human-managed areas because we are interested in a pre-industrial estimate, and we use a different climate dataset with a higher spatial resolution (10′ versus 0.5°) [36]. Our approach assumes that changes in the N cycle since the industrial revolution have had a negligible impact on terrestrial N isotopes, an assumption that seems reasonable because most terrestrial N is soil N with a long residence time, and because most of the information in Amundson et al. [33] was derived from little-managed soils. Using the best fit model for soil N to 50 cm depth from Amundson et al. [33], we calculate a land surface-area-weighted mean δ15NTB = 5.9‰, slightly higher than the 5.3‰ from Houlton & Bai [31].
The isotopic ratio of inputs (δ15NI) depends on the isotopic values of all inputs weighted by their fluxes. The isotopic values of BNF (0‰ in theory, −2 to 0‰ in practice [37]) and lightning-fixed N (0–1‰ [38]) are close enough that the relative fluxes do not have a large effect on the weighted isotopic value of total N input. We do not know the isotopic value for Nrl, the pre-industrial transfer of reactive N from ocean to land, but as discussed below, the magnitude of this flux was small. We use as our central value δ15NI = −1‰; see the electronic supplementary material for an exact version of the calculation that accommodates different isotopic signatures of the inputs. Houlton & Bai [31] show that ɛH is between −1 and 0‰ globally; we use 0‰ as our central value. Their synthesis of field estimates of ɛG for denitrification yields a mean of −17‰ for temperate forests and −13‰ for tropical forests; we use −15‰ as a central value.
With these values and equation (3.2), our estimate for the fraction of total N lost as unreactive gas (N2 and N2O) is 0.46, which yields a total N gas loss of 30 Tg N yr−1 and a total N loss of 65 Tg N yr−1 (figure 1). Independent estimates of N2O fluxes can provide perspective on this calculation. Pre-industrial N2O emissions are thought to have been around 6.5 Tg N yr−1 [39,40], and the pre-industrial atmospheric flux of reactive N from the land to the ocean is thought to be around 6 Tg N yr−1 [23], yielding N2 emissions of around 17 Tg N yr−1 (not including denitrification that occurs along the flowpath from below soils to the mouths of rivers). This ratio of N2 to N2O (2.7) is similar to other estimates (2.2–4.6) [31]. An alternative estimate of the pre-industrial flux of reactive N from land to the ocean [41] suggested 14 ± 10 Tg N yr−1; the central value of this estimate would reduce our estimate of N2 emissions to 9 Tg N yr−1, but it would not change our estimate of BNF.
The one remaining value required to calculate BNF is the atmospheric flux of reactive N from the ocean to the terrestrial surface (Nrl). We know of no estimates for this flux, but it likely was much less than the flux of reactive N from the land to the ocean. We therefore use half of the land to ocean flux, or 3 Tg N yr−1, as our central value.
Using these values and equations (3.1)–(3.3), our central estimate for pre-industrial terrestrial BNF is 58 Tg N yr−1. Nearly all of the values used here have substantial uncertainty associated with them, so we evaluated the sensitivity of the BNF estimate to each of the parameters by calculating derivatives of equation (3.1) with respect to each parameter. The resulting range of estimates for BNF is summarized in table 1. Of the three flux measurements that enter directly into the calculation, the hydrologic loss term is most important for three reasons. First, changes in HL must be matched by nearly twofold changes in BNF (for fG near 0.5), whereas changes in the input terms must only be matched by one-to-one changes in BNF. Second, there is substantial uncertainty in our HL estimate. Third, non-BNF input fluxes are small relative to the hydrologic loss flux, and so proportionally similar uncertainty in HL affects BNF much more than does LNF or Nrl (table 1).
Table 1.
Sensitivity of biological N fixation to the parameters used to generate the global estimate. All flux values (hydrologic losses that reach the ocean (HLO), hydrologic losses that are lost along the flowpath from below soils to the ocean (HLF), lightning-fixed N (LNF) deposited on land, the atmospheric flux of reactive N from oceans to land (Nrl) and biological nitrogen fixation (BNF)) have units of Tg N yr−1, whereas all isotope values (the 15N/14N ratios of the total biosphere (δ15NTB) and inputs to land (δ15NI), and the isotope effects associated with hydrologic (ɛH) and gaseous (ɛG) losses) have units of per mil (‰).
| parameter | value (range) | effect of change on BNF (dBNF/dparameter) | BNF estimatea |
|---|---|---|---|
| HLO | 15 (7–23)b | 1/(1−fG) | 58 (43–73) |
| HLF | 20 (10–30)b | 1/(1−fG) | 58 (39–76) |
| LNF | 4 (2–6)b | −1 | 58 (60–56) |
| Nrl | 3 (1.5–4.5)b | −1 | 58 (59–56) |
| δ15NTB | 5.9 (4.9–6.9) | K(ɛH−ɛG)c | 58 (51–67) |
| δ15NI | −1 (−2 to 0) | K(ɛG−ɛH) | 58 (67–51) |
| ɛH | 0 (−2 to 0) | K(−ɛG−δ15NTB + δ15NI) | 58 (49–58) |
| ɛG | −15 (−20 to −10) | K(ɛH + δ15NTB − δ15NI) | 58 (46–106) |
aCalculated for other parameters at their central values.
bFor flux data, we used ± 50% for the uncertainty range.
cK = HL/(−ɛG −δ15NTB + δ15NI)2.
Of the four isotopic parameters, ɛG is the most important for two reasons. First, it is more uncertain than that of the other parameters. Second, because it is the main driver of terrestrial isotopic N enrichment, ɛG has a highly nonlinear effect. As the absolute value of the isotope effect gets small (as it approaches the difference between the terrestrial biosphere δ15N and the input δ15N), there must be an increasingly large gas loss flux to account for the soil isotopic enrichment, and thus a correspondingly large amount of BNF to balance this gas loss.
Examining all of these sensitivities, we suggest that a reasonable range for pre-industrial terrestrial BNF is 40–100 Tg N yr−1, with a preferred single estimate near 60 Tg N yr−1. This preferred value, and indeed the entire range of values, is substantially less than previous estimates of 195 (range of 100–290) or 128 Tg N yr−1 [22,23]. If our estimate is nearer the true value, previous calculations have underestimated the magnitude of the anthropogenic influence on terrestrial N inputs. Anthropogenic N fixation in 2005 was approximately 187 Tg N yr−1 [1], so our new estimate suggests a 320 per cent (range of 190–470%) increase in total N fixed rather than the 100–150% increase suggested by previous estimates.
Even BNF in cropping systems, which Herridge et al. [13] calculated to be 40–55 Tg N yr−1 (exclusive of extensively grazed tropical savannahs), looms large relative to pre-industrial BNF. Modern BNF in little-managed systems is likely to be substantially less than our pre-industrial estimate owing to land conversion, and perhaps to downregulation of BNF caused by increased deposition of anthropogenic reactive N.
As is often the case with global biogeochemical calculations, our assumptions do not consider several potentially important factors. Perhaps most importantly, we do not include inputs of geological N derived from the weathering of fixed N in rocks [42,43]. Such inputs make a significant contribution to the N economy of specific sites, including to their hydrologic losses of N [44], but the global significance of geological N is not known. Geological N is potentially important not only because every Tg of input would imply an equivalent decrease in BNF, but also because the limited evidence that does exist shows geological N to be 15N-enriched relative to BNF [43]. Enriched inputs imply that matching observed ecosystem δ15N would require a lower fraction of losses via denitrification and hence lower BNF. Reasonably conservative estimates of geological N inputs of 10 Tg yr−1, with δ15N = 2‰, imply a reduction in our central estimate of BNF from 58 to 44 Tg N yr−1; electronic supplementary material details this calculation and explores a range of values.
Another assumption that should be evaluated is that atmospheric transfer of reactive N only affects our BNF calculation when it results in a transfer of N from the land surface to the ocean or vice versa. In fact, under some conditions, the isotopic calculation of gaseous losses could be sensitive to source-sink dynamics within terrestrial ecosystems. For example, areas without hydrologic losses (such as many deserts) and fire-prone areas such as savannahs might transfer isotopically light reactive N to non-fire-prone ecosystems downwind, and these transfers could decrease δ15NTB and thus inappropriately lower our estimate of BNF. For this reason and others, a regional analysis of pre-industrial N fluxes and enrichments would be of considerable interest.
4. From patterns to ecological controls
Here, we use information on regional patterns in BNF, together with observed variations through disturbance–succession cycles and the results of selected field experiments, to evaluate potential ecological controls of BNF. Using patterns to infer putative controls has obvious limitations, not the least of which is that N cycling dynamics have been disrupted strongly and recently by human activity, but it offers a useful starting point.
A number of studies have reported peaks in the abundance and activity of symbiotic N fixers at some early stage of succession. These BNF peaks frequently occur following geological disturbances (such as volcanic eruptions and glacial recessions) that initiate primary succession [19,45,46]; they also occur during secondary succession after severe stand-replacing fires [47], and indeed they can be used as a management tool to restore reactive N to degraded sites [48]. These peaks are usually associated with a small supply of N relative to other resources such as light, water and P. Even less destructive disturbances can cause losses of N owing to its high mobility relative to other nutrients, especially P. Consequently, the growth of successional vegetation often is limited by N supply, even in ecosystems where N was abundant in the system prior to disturbance [49]—and consequently symbiotic N fixers may be systematically favoured in many successional ecosystems. For example, Menge et al. [50] used forest inventory data to show that symbiotic N-fixing trees are much more abundant early in succession in all regions of the coterminous United States. Moreover, they showed that the broad phylogenetic clade that contains all symbiotic N fixers (legumes and actinorhizal plants, as well as their close relatives that appear to be incapable of N fixation) is not disproportionately abundant in early successional forests; it is specifically putative N fixers that occur early in succession [50].
Enhanced rates of BNF can occur later in succession as well. For example, where extremely cold temperatures cause an accumulating sink for C and N in boreal soils, cyanobacteria in moss carpets are often an important source of N via N fixation [51]. Similarly, in desert soils where the potential for gaseous losses is high, biological soil crusts may fix meaningful quantities of N in late-successional systems [52]. However, the highest rates of BNF generally are associated with symbiotic N fixers during early stages of succession.
Geographically, tropical savannah ecosystems long have been considered ‘hot spots’ of BNF—and many measurements in a wide variety of savannahs do report a substantial cover by potentially fixing legumes, the possibility of fixation from several other sources and in some cases high rates of measured N fixation [53]. Relatively high rates of BNF in savannahs make sense, because frequent fires effectively remove large quantities of N relative to P and other nutrients [54]. However, N fixation rates vary substantially among savannahs even within small geographical areas, resulting from differences in edaphic characteristics, history, grazing practices and other features. For example, in a Tanzanian savannah region Cech et al. [54] measured rates of BNF ranging from approximately 0.3 to 7.5 kg N ha−1 yr−1. Lopez-Hernandez et al. [55] measured substantial rates of BNF in a Venezuelan savannah, especially in burned areas; they found most N fixation was carried out by microbial crusts and microbes associated with the roots of C4 grasses (pathways that Cech et al. [54] did not evaluate). It is fair to conclude that the variability in BNF is just as noteworthy as the occasionally high rates of fixation measured in savannahs.
(a). Biological nitrogen fixation often is regulated by N supply, and often responds to N deficiency
These and other studies of geographical and ecological patterns in BNF support the generalization that BNF is often (but not invariably) active where reactive N supply is small relative to other resources. Experimental manipulations also provide evidence supporting this generalization. For example, many studies demonstrate that rates of BNF are suppressed following N additions. On the other hand, adding another resource (water, P, CO2, light) to an ecosystem where growth and biomass accumulation are limited by that resource can induce a demand for N, because in the absence of N fertilization or anthropogenically enhanced N deposition, N rarely is available in great excess above the supply of other resources. Thus, additions of these limiting resources can stimulate enhanced N fixation. For example, Benner & Vitousek [56,57] observed that adding P to a P-limited montane forest in Hawaii led to enhanced lichen growth in the canopy, and most of the lichens that responded were N-fixing cyanolichens that increased N inputs from approximately 0.3 to 9 kg ha−1 yr−1. Similarly, CO2 enrichment often stimulates plant growth, and in some experiments, it also increases the growth of legumes and rates of BNF [58,59]—although any such stimulation may be short-lived [60].
Tropical rainforests appear to function differently from most other forests; putatively, N-fixing legumes are abundant in many late-successional lowland tropical forests, and many of these forests are relatively rich in available N [61,62]. Hedin et al. [63] referred to this situation as the ‘nitrogen paradox’ of tropical forests. A number of studies have used 15N natural abundance to determine whether late-successional legumes actively fix N—an approach made feasible by the fact that non-fixing plants in many tropical forests are substantially enriched in 15N as a consequence of their open N cycle [64]. In most sites, 15N natural abundance studies suggest that only a small fraction of canopy legumes are actively fixing N—even though many of them belong to genera that are known to nodulate and fix N under appropriate conditions [64–66]. An independent approach showed that very little symbiotic BNF was needed to balance N losses in an Amazonian forest [67]. However, a thorough study by Pons et al. [68] in Guyana found nine species that both nodulated and met a substantial fraction of their N requirements from fixation. They concluded that approximately 6 per cent of the N taken up by these forests could be derived from contemporaneous BNF—an amount that is sufficient to replace N losses and to recover from N-depleting disturbances over reasonably rapid time-scales, but not a dominant source of N input [68]. These results are consistent with those of a field study in Panama that measured low rates of symbiotic BNF in a mature tropical forest with relatively high N availability, but high rates in secondary or disturbed forests with lower N availability [69]. Overall, while the capacity to fix N symbiotically is present in many late-successional tropical forests in which N is relatively abundant, it appears that relatively little of that BNF capacity is realized in practice.
(b). Biological nitrogen fixation is constrained in some N-limited ecosystems
Despite the overall tendency for BNF to be active where biologically available N is in short supply, some important types of ecosystems have unmet demands for reactive N and very low rates of BNF. This observation applies most clearly to the many late-successional temperate forests and grasslands in which plant production is proximately limited by N supply [6–8]—often despite enhanced deposition of anthropogenic reactive N. Many of these ecosystems are relatively productive and reasonably rich in energy, water and nutrients other than N. Rates of BNF could be low and N limitation could be sustained in these ecosystems if a resource or process systematically constrains N fixers more than it does non-fixers. Possible constraints that apply primarily to symbiotic systems [8,9] include:
— lower shade tolerance of N fixers—a lower ability of N fixers to persist in and ultimately to grow up through the shade of an established forest canopy, owing to the high energetic costs of BNF. This constraint is consistent with models of competition between N fixers and non-fixers [9,70,71] and with observations across North America showing that temperate trees with N-fixing symbionts typically are shade-intolerant [50]. This relationship does not extend to tropical forests, in which shade-tolerant legumes are widespread [62];
— preferential grazing on N fixers—higher rates of grazing on N fixers could occur because N fixers generally have higher tissue N content than do non-fixers—and most grazing animals seek (and often require) N- and protein-rich food sources. There is good evidence for disproportionately intense grazing on N fixers, and evidence that such grazing can reduce N inputs and sustain N limitation to primary production on the ecosystem level [72]; and
— higher non-N nutrient demands by N fixers—certain nutrients are required in greater amounts by fixers than non-fixers (as clearly is true for Mo and Fe [11]; it may also be true for P, at least for some groups of N fixers). In this case, N fixers may be constrained by another nutrient, whereas non-fixers are constrained by N supply. Thus, N limitation to primary production on a whole-system level may be limitation by P (or another non-N nutrient) in disguise.
The first two mechanisms involve ecological interactions in that other organisms constrain N fixers; non-fixer shading of or preferential grazing on plants with N-fixing symbioses would keep them from growing into or persisting within the plant canopy, where they could actively carry out BNF. The last mechanism also could be influenced by biotic interactions; for example, Cech et al. [73] demonstrated that a dominant C4 grass could outcompete an herbaceous legume for otherwise-available P (and N) in a tall-grass Tanzanian savannah ecosystem, thereby suppressing legume growth and N fixation.
With the exception of decomposers [14,74–76], there has been less research on patterns of and constraints to BNF in groups of organisms other than angiosperms with N-fixing symbioses. Where (and when) they are present in ecosystems, symbiotic N fixers are important because they can achieve extremely high rates of fixation. However, the cumulative effects of other groups of N fixers can provide the dominant input of fixed N where symbiotic BNF associated with higher plants is low or non-existent [14]. These contributions are included in our global estimate of N fixation; further analysis of their ecological regulation would be rewarding.
5. Models of ecological controls of biological nitrogen fixation
Given both the methodological challenges inherent to estimating BNF in complex ecosystems and the notorious spatial and temporal heterogeneity of the process, we are not likely to develop well-constrained estimates of regional/global BNF or its controls simply by accumulating and extrapolating the results of local studies. However, models that synthesize the dynamics of N-fixing organisms and symbioses, their interactions with other organisms and environmental factors, and the ecosystem-level feedbacks that influence resource availability offer a potentially productive path towards an ecological understanding of BNF. While a few high-quality empirical studies may not suffice to estimate biome-level BNF by extrapolation, they can provide the fundamental information needed to develop and test models.
Several models that focus on ecosystem-level controls on BNF have been developed. Vitousek & Field [9,77] evaluated constraints to BNF in N-limited ecosystems, simulating a N-fixing symbiosis that pays higher costs for N acquisition than does a non-fixer. Rastetter et al. [70] developed a similar model for competition between a N fixer and one or more non-fixers within the framework of a multiple element limitation model. Vitousek & Field [9] found that without additional constraints, the relatively high cost of BNF alone was insufficient to constrain N fixation enough to sustain N limitation. Adding other constraints to the model (an increased requirement for P, decreased shade tolerance by the N fixer and increased susceptibility to grazing for the N fixer) could constrain N fixation sufficiently to sustain N limitation indefinitely—as long as there were N losses from the system via pathways that could not be prevented by biotic uptake of available N [9]. Later variations on this model showed that N losses caused by environmental fluctuations (especially in water availability in seasonally dry environments) and by periodic disturbance (e.g. fire) also could constrain BNF sufficiently to yield long-term N limitation ([77,78], see also [79]). While these models demonstrate that modelled constraints to N fixation could inhibit BNF enough to sustain N limitation, they do not show which mechanisms constrain BNF in N-limited ecosystems.
More recently, Menge et al. [71,80] developed analytical models of a plant with N-fixing symbioses competing with a non-fixer. They concluded that a lower N use efficiency (less growth per unit of N acquired) can suffice to keep N fixers from entering a N-limited ecosystem dominated by non-fixers [71]—a result consistent with the greater N concentrations observed in legumes [81] and actinorhizal plants in comparison with most non-fixers. Menge et al. [80] also explored the importance of facultative versus obligate symbiotic N fixation; both Vitousek & Field [9] and Rastetter et al. [70] modelled a situation in which the N fixer always acquires N via fixation. It appears that a superior strategy would be to fix N when N is in short supply, and to function as a non-fixer when N is abundant or (especially for an understory plant) when N fixation is too costly. However, Menge et al. [80] found that the costs of the regulatory system that turns N fixation on and off (together with all of its structural and biochemical machinery), and the lag time before regulation becomes effective could make obligate N fixation, facultative N fixation or non-fixation the most effective strategy (depending on costs and conditions). As discussed earlier, there is some evidence for a diversity of regulation strategies in nature (see [82]). In theory, this diversity of strategies could simultaneously explain the preponderance of putative N fixers in late-successional tropical forests and the paucity of N fixers in late-successional temperate forests [80].
Houlton et al. [83] proposed a biome-level model of controls of BNF—suggesting that N-fixing legumes could be favoured in tropical forests because they acquire enough N to maintain higher extracellular phosphatase activity (relative to non-fixers) that help overcome potential P limitation in these often P-limited ecosystems, and because the temperature in tropical environments is near the optimum for BNF (which their review suggested to be approx. 26°C). The temperature dependence of the nitrogenase enzyme system is unusual in that it has strongly biphasic kinetics, with an activation energy of 0.65 eV above 22°C (similar to respiration), and a very high activation energy of 2.18 eV below 22°C [84]. Accordingly, the potential rate of BNF decreases relatively slowly as temperature decreases to 22°C, and then falls much more rapidly at lower temperatures. These kinetic differences may contribute to the global pattern of BNF summarized by Cleveland et al. [22], modelled by Houlton et al. [83] and implied by the 15N natural abundance patterns reported by Amundson et al. [33].
6. Conclusions
Research over the past decade has greatly expanded our knowledge of the diversity of organisms capable of carrying out BNF, but it has contributed less to our understanding of the rates and regulation of BNF. Here, we draw upon information from global summaries of 15N/14N in terrestrial ecosystems and estimates of pre-industrial N fluxes to suggest a new estimate of terrestrial BNF prior to extensive human alteration of the Earth system. Our estimate is 58 Tg N yr−1 (44 Tg N yr−1 accounting for geological N), with a plausible range from 40 to 100 Tg N—substantially lower than previous estimates. If accurate, then this new estimate suggests that the magnitude of anthropogenic alteration of the terrestrial N cycle has been understated. Further, we suggest that understanding BNF on ecosystem and regional scales is a key to understanding, predicting and managing the consequences of multiple components of anthropogenic global change—and that a new generation of models and associated experiments offer the best opportunity to achieve that understanding.
Acknowledgements
Research and manuscript preparation were supported by grant no. DEB-1020791 from the National Science Foundation; D.N.L.M. was supported by the Carbon Mitigation Initiative (cmi.princeton.edu). Conversations with T. Crews, C. B. Field, L. O. Hedin, and B. Z. Houlton, contributed to the analyses here, and B.Z. Houlton commented on an earlier draft of the manuscript.
References
- 1.Galloway JN, Townsend AR, Erisman JW, Bekunda M, Cai ZE, Freney JR, Martinelli LA, Seitzinger SP, Sutton MA. 2008. Transformation of the nitrogen cycle: recent trends, questions, and potential solutions. Science 320, 889–892 10.1126/science.1136674 (doi:10.1126/science.1136674) [DOI] [PubMed] [Google Scholar]
- 2.Canfield DE, Glazer AN, Falkowski PG. 2010. The evolution and future of Earth's nitrogen cycle. Science 330, 192–196 10.1126/science.1186120 (doi:10.1126/science.1186120) [DOI] [PubMed] [Google Scholar]
- 3.Hungate BA, Dukes JS, Shaw MR, Luo YQ, Field CB. 2003. Nitrogen and climate change. Science 302, 1512–1513 10.1126/science.1091390 (doi:10.1126/science.1091390) [DOI] [PubMed] [Google Scholar]
- 4.Luo Y, et al. 2004. Progressive nitrogen limitation of ecosystem responses to rising atmospheric carbon dioxide. BioScience 54, 731–739 10.1641/0006-3568(2004)054[0731:PNLOER]2.0.CO;2 (doi:10.1641/0006-3568(2004)054[0731:PNLOER]2.0.CO;2) [DOI] [Google Scholar]
- 5.Johnson DW. 2006. Progressive nitrogen limitation in forests: review and implications for long-term responses to elevated CO2. Ecology 87, 64–75 10.1890/04-1781 (doi:10.1890/04-1781) [DOI] [PubMed] [Google Scholar]
- 6.Elser JJ, et al. 2007. Global analysis of nitrogen and phosphorus limitation of primary producers in freshwater, marine, and terrestrial systems. Ecol. Lett. 10, 1–8 10.1111/j.1461-0248.2006.01001.x (doi:10.1111/j.1461-0248.2006.01001.x) [DOI] [PubMed] [Google Scholar]
- 7.LeBauer DS, Treseder KK. 2008. Nitrogen limitation of net primary productivity in terrestrial ecosystems is globally distributed. Ecology 89, 371–379 10.1890/06-2057.1 (doi:10.1890/06-2057.1) [DOI] [PubMed] [Google Scholar]
- 8.Vitousek PM, Howarth RW. 1991. Nitrogen limitation on land and in the sea: how can it occur? Biogeochemistry 13, 87–115 10.1007/BF00002772 (doi:10.1007/BF00002772) [DOI] [Google Scholar]
- 9.Vitousek PM, Field CB. 1999. Ecosystem constraints to symbiotic nitrogen fixers: a simple model and its implications. Biogeochemistry 46, 179–202 10.1007/BF01007579 (doi:10.1007/BF01007579) [DOI] [Google Scholar]
- 10.Hartwig UA. 1998. The regulation of symbiotic N2 fixation: a conceptual model of N feedback from the ecosystem to the gene expression level. Perspect. Plant Ecol. Evol. Syst. 1, 92–120 10.1078/1433-8319-00054 (doi:10.1078/1433-8319-00054) [DOI] [Google Scholar]
- 11.Vitousek PM, et al. 2002. Towards an ecological understanding of biological nitrogen fixation. Biogeochemistry 57, 1–45 10.1023/A:1015798428743 (doi:10.1023/A:1015798428743) [DOI] [Google Scholar]
- 12.Dixon R, Kahn D. 2004. Genetic regulation of biological nitrogen fixation. Nat. Rev. Microbiol. 2, 621–631 10.1038/nrmicro954 (doi:10.1038/nrmicro954) [DOI] [PubMed] [Google Scholar]
- 13.Herridge DF, Peoples MB, Boddey RM. 2008. Global inputs of biological nitrogen fixation in agricultural systems. Plant Soil 311, 1–18 10.1007/s11104-008-9668-3 (doi:10.1007/s11104-008-9668-3) [DOI] [Google Scholar]
- 14.Reed SC, Cleveland CC, Townsend AR. 2011. Functional ecology of free-living nitrogen fixation: a contemporary perspective. Annu. Rev. Ecol. Evol. Syst. 42, 489–512 10.1146/annurev-ecolsys-102710-145034 (doi:10.1146/annurev-ecolsys-102710-145034) [DOI] [Google Scholar]
- 15.Gyaneshwar P, et al. 2011. Legume-nodulating betaproteobacteria: diversity, host range, and future prospects. Mol. Plant Microbe Interact. 24, 1276–1288 10.1094/MPMI-06-11-0172 (doi:10.1094/MPMI-06-11-0172) [DOI] [PubMed] [Google Scholar]
- 16.Sprent JI. 2007. Evolving ideas of legume evolution and diversity: a taxonomic perspective on the occurrence of nodulation. New Phytol. 174, 11–25 10.1111/j.1469-8137.2007.02015.x (doi:10.1111/j.1469-8137.2007.02015.x) [DOI] [PubMed] [Google Scholar]
- 17.Binkley D, Sollins P, Bell R, Sachs D, Myrold D. 1992. Biogeochemistry of adjacent conifer and alder-conifer stands. Ecology 73, 2022–2033 10.2307/1941452 (doi:10.2307/1941452) [DOI] [Google Scholar]
- 18.Compton JE, Church MR, Larned ST, Hogsett WE. 2003. Nitrogen export from forested watersheds in the Oregon Coast range: the role of N2-fixing alder. Ecosystems 6, 773–785 10.1007/s10021-002-0207-4 (doi:10.1007/s10021-002-0207-4) [DOI] [Google Scholar]
- 19.Menge DNL, Hedin LO. 2009. Nitrogen fixation in different biogeochemical niches along a 120,000 yr chronosequence in New Zealand. Ecology 90, 2190–2201 10.1890/08-0877.1 (doi:10.1890/08-0877.1) [DOI] [PubMed] [Google Scholar]
- 20.Drake DC. 2011. Invasive legumes fix N2 at high rates in riparian areas of an N-saturated, agricultural catchment. J. Ecol. 99, 515–523 [Google Scholar]
- 21.Cook DR, Vandenbosch K, de Bruijn FJ, Huguet T. 1997. Model legumes get the nod. Plant Cell 9, 275–281 [Google Scholar]
- 22.Cleveland CC, et al. 1999. Global patterns of terrestrial biological nitrogen (N2) fixation in natural ecosystems. Glob. Biogeochem. Cycle 13, 623–645 10.1029/1999GB900014 (doi:10.1029/1999GB900014) [DOI] [Google Scholar]
- 23.Galloway JN, et al. 2004. Nitrogen cycles: past, present, and future. Biogeochemistry 70, 153–226 10.1007/s10533-004-0370-0 (doi:10.1007/s10533-004-0370-0) [DOI] [Google Scholar]
- 24.Schumann U, Huntrieser H. 2007. The global lightning-induced nitrogen oxides source. Atmos. Chem. Phys. Discuss. 7, 2623–2818 10.5194/acpd-7-2623-2007 (doi:10.5194/acpd-7-2623-2007) [DOI] [Google Scholar]
- 25.Green PA, Vorosmarty CJ, Meybeck M, Galloway JN, Peterson BJ, Boyer EW. 2004. Pre-industrial and contemporary fluxes through rivers: a global assessment based on typology. Biogeochemistry 68, 71–105 10.1023/B:BIOG.0000025742.82155.92 (doi:10.1023/B:BIOG.0000025742.82155.92) [DOI] [Google Scholar]
- 26.Howarth RW, et al. 1996. Nitrogen budgets and riverine N & P fluxes for the drainages to the North Atlantic Ocean: natural and human influences. Biogeochemistry 35, 75–139 10.1007/BF02179825 (doi:10.1007/BF02179825) [DOI] [Google Scholar]
- 27.Howarth R, Swaney D, Billen G, Garnier J, Hong B, Humborg C, Johnes P, Mörth CM, Marino R. 2011. Nitrogen fluxes from the landscape are controlled by net anthropogenic nitrogen inputs and by climate. Front. Ecol. Environ. 10, 37–43 10.1890/100178 (doi:10.1890/100178) [DOI] [Google Scholar]
- 28.Billy C, Billen G, Sebilo M, Birgand F, Tournebize J. 2010. Nitrogen isotopic composition of leached nitrate and soil organic matter as an indicator of denitrification in a sloping drained agricultural plot and adjacent uncultivated riparian buffer strips. Soil Biol. Biochem. 42, 108–117 10.1016/j.soilbio.2009.09.026 (doi:10.1016/j.soilbio.2009.09.026) [DOI] [Google Scholar]
- 29.Bouwman AF, Beusen AHW, Griffioen J, Van Groenigen JW, Hefting MM, Oenema O, Van Puijenbroek PJTM, Seitzinger S, Slomp CP, Stehfest E. 2013. Global trends and uncertainties in terrestrial denitrification and N2O emissions. Trans. R. Soc. B 368, 20130112. 10.1098/rstb.2013.0112 (doi:10.1098/rstb.2013.0112) [DOI] [PMC free article] [PubMed] [Google Scholar]
- 30.Perakis SS, Hedin LO. 2002. Nitrogen loss from unpolluted South American forests mainly via dissolved organic compounds. Nature 415, 416–419 10.1038/415416a (doi:10.1038/415416a) [DOI] [PubMed] [Google Scholar]
- 31.Houlton BZ, Bai E. 2009. Imprint of denitrifying bacteria on the global terrestrial biosphere. Proc. Natl Acad. Sci. USA 106, 21 713–21 716 10.1073/pnas.0912111106 (doi:10.1073/pnas.0912111106) [DOI] [PMC free article] [PubMed] [Google Scholar]
- 32.Handley LL, Austin AT, Robinson D, Scrimgeour CM, Raven JA, Heaton THE, Schmidt S, Stewart GR. 1999. The N-15 natural abundance (delta N-15) of ecosystem samples reflects measures of water availability. Aust. J. Plant Physiol. 26, 185–199 10.1071/PP98146 (doi:10.1071/PP98146) [DOI] [Google Scholar]
- 33.Amundson R, Austin AT, Schuur EAG, Yoo K, Matzek V, Kendall C, Uebersax A, Brenner D, Baisden WT. 2003. Global patterns of isotopic composition of soil and plant nitrogen. Glob. Biogeochem. Cycle 17 10.1029/2002GB001903 (doi:10.1029/2002GB001903) [DOI] [Google Scholar]
- 34.Craine JM, et al. 2009. Global patterns of foliar nitrogen isotopes and their relationships with climate, mycorrhizal fungi, foliar nutrient concentrations, and nitrogen availability. New Phytol. 183, 980–992 10.1111/j.1469-8137.2009.02917.x (doi:10.1111/j.1469-8137.2009.02917.x) [DOI] [PubMed] [Google Scholar]
- 35.Schlesinger WH. 1997. Biogeochemistry: an analysis of global change. San Diego, CA: Academic Press [Google Scholar]
- 36.New M, Lister D, Hulme M, Makin I. 2002. A high-resolution data set of surface climate over global land areas. Clim. Res. 21, 1–25 10.3354/cr021001 (doi:10.3354/cr021001) [DOI] [Google Scholar]
- 37.Shearer G, Kohl DH. 1986. N2-fixation in field settings: estimations based on natural 15N abundance. Aust. J. Plant Physiol. 13, 699–756 [Google Scholar]
- 38.Hastings MG, Sigman DM, Lipschultz F. 2003. Isotopic evidence for source changes of nitrate in rain at Bermuda. J. Geophys. Res. 108, 4790. 10.1029/2003JD003789 (doi:10.1029/2003JD003789) [DOI] [Google Scholar]
- 39.Denman KL, et al. 2007. Coupling changes in the climate system and biogeochemistry. In Climate change 2007: the physical science basis (eds Solomon S, Qin D, Manning M, Chen Z, Marquis M, Averyt KD, Tignor M, Miller BR.), pp. 500–587 Cambridge, UK: Cambridge University Press [Google Scholar]
- 40.Syakila A, Kroeze C. 2011. The global nitrous oxide budget revisited. Greenhouse Gas Meas. Manage. 1, 17–26 10.3763/ghgmm.2010.0007 (doi:10.3763/ghgmm.2010.0007) [DOI] [Google Scholar]
- 41.Duce RA, et al. 2008. Impacts of atmospheric anthropogenic nitrogen on the open ocean. Science 320, 893–897 10.1126/science.1150369 (doi:10.1126/science.1150369) [DOI] [PubMed] [Google Scholar]
- 42.Holloway JM, Dahlgren RA. 2002. Nitrogen in rocks: occurrence and biogeochemical implications. Glob. Biogeochem. Cycle 16, 65.1–65.17 10.1029/2002GB001862 (doi:10.1029/2002GB001862) [DOI] [Google Scholar]
- 43.Morford SL, Houlton BZ, Dahlgren RA. 2011. Increased forest ecosystem carbon and nitrogen storage from nitrogen-rich bedrock. Nature 477, 78–81 10.1038/nature10415 (doi:10.1038/nature10415) [DOI] [PubMed] [Google Scholar]
- 44.Holloway JM, Dahlgren RA, Hansen B, Casey WH. 1998. Contributions of bedrock nitrogen to high nitrate concentrations in stream water. Nature 395, 785–788 10.1038/27410 (doi:10.1038/27410) [DOI] [Google Scholar]
- 45.Gorham E, Vitousek PM, Reiners WA. 1979. The regulation of element budgets over the course of terrestrial ecosystem succession . Annu. Rev. Ecol. Syst. 10, 53–84 10.1146/annurev.es.10.110179.000413 (doi:10.1146/annurev.es.10.110179.000413) [DOI] [Google Scholar]
- 46.Chapin FS, III, Walker LR, Fastie CL, Sharman LC. 1994. Mechanisms of primary succession following at Glacier Bay, Alaska. Ecol. Monogr. 64, 149–175 10.2307/2937039 (doi:10.2307/2937039) [DOI] [Google Scholar]
- 47.Perakis SS, Sinkhorn ER, Compton JE. 2011. δ15N constraints on long-term nitrogen balances in temperate forests. Oecologia 167, 793–807 10.1007/s00442-011-2016-y (doi:10.1007/s00442-011-2016-y) [DOI] [PubMed] [Google Scholar]
- 48.Macedo MO, Resende AS, Garcia PC, Boddey RM, Jantalia CP, Urquiaga S, Campello EFC, Franco AA. 2008. Changes in soil C and N stocks and nutrient dynamics 13 years after recovery of degraded land using leguminous nitrogen-fixing trees. Forest Ecol. Manage. 255, 1516–1524 10.1016/j.foreco.2007.11.007 (doi:10.1016/j.foreco.2007.11.007) [DOI] [Google Scholar]
- 49.Davidson EA, et al. 2007. Recuperation of nitrogen cycling in Amazonian forests following agricultural abandonment. Nature 447, 995–998 10.1038/nature05900 (doi:10.1038/nature05900) [DOI] [PubMed] [Google Scholar]
- 50.Menge DNL, DeNoyer JL, Lichstein JW. 2010. Phylogenetic constraints do not explain the rarity of nitrogen fixing trees in late successional temperate forests. PLoS ONE 5, e12056. 10.1371/journal.pone.0012056 (doi:10.1371/journal.pone.0012056) [DOI] [PMC free article] [PubMed] [Google Scholar]
- 51.DeLuca TH, Zackrisson O, Gentili F, Sellstedt A, Nilsson MC. 2007. Ecosystem controls on nitrogen fixation in boreal feather moss communities. Oecologia 152, 121–130 10.1007/s00442-006-0626-6 (doi:10.1007/s00442-006-0626-6) [DOI] [PubMed] [Google Scholar]
- 52.Belnap J. 2002. Nitrogen fixation in biological soil crusts from southeast Utah, USA. Biol. Fertil. Soils 35, 128–135 10.1007/s00374-002-0452-x (doi:10.1007/s00374-002-0452-x) [DOI] [Google Scholar]
- 53.Bustamante MMC, Medina E, Asner GP, Nardoto GB, Garcia-Montiel DC. 2006. Nitrogen cycling in tropical and temperate savannas. Biogeochemistry 79, 209–237 10.1007/s10533-006-9006-x (doi:10.1007/s10533-006-9006-x) [DOI] [Google Scholar]
- 54.Cech PG, Olde Venterink H, Edwards PJ. 2010. N and P cycling in Tanzanian humid savanna: influence of herbivores, fire, and N2-fixation. Ecosystems 13, 1079–1096 10.1007/s10021-010-9375-9 (doi:10.1007/s10021-010-9375-9) [DOI] [Google Scholar]
- 55.Lopez-Hernandez D, Santaella S, Chacon P. 2006. Contribution of nitrogen-fixing organisms to the N budget in Trachypogon savannas. Eur. J. Soil Sci. 42, 43–50 10.1016/j.ejsobi.2005.09.015 (doi:10.1016/j.ejsobi.2005.09.015) [DOI] [Google Scholar]
- 56.Benner JW, Vitousek PM. 2007. Development of a diverse epiphyte community in response to phosphorus fertilization. Ecol. Lett. 10, 628–636 10.1111/j.1461-0248.2007.01054.x (doi:10.1111/j.1461-0248.2007.01054.x) [DOI] [PubMed] [Google Scholar]
- 57.Benner JW, Vitousek PM. 2012. Cyanolichens: a link between the phosphorus and nitrogen cycles in a Hawaiian montane forest. J. Trop. Ecol. 28, 73–81 10.1017/S0266467411000605 (doi:10.1017/S0266467411000605) [DOI] [Google Scholar]
- 58.Hungate BA, Dijkstra P, Johnson DW, Hinkle CR, Drake BG. 1999. Elevated CO2 increases nitrogen fixation and decreases soil nitrogen mineralization in Florida scrub oak. Glob. Change Biol. 5, 781–789 10.1046/j.1365-2486.1999.00275.x (doi:10.1046/j.1365-2486.1999.00275.x) [DOI] [Google Scholar]
- 59.West JB, HilleRisLambers J, Lee TD, Hobbie SE, Reich PB. 2005. Legume species identity and soil nitrogen supply determine symbiotic nitrogen-fixing responses to elevated atmospheric CO2. New Phytol. 167, 523–530 10.1111/j.1469-8137.2005.01444.x (doi:10.1111/j.1469-8137.2005.01444.x) [DOI] [PubMed] [Google Scholar]
- 60.Hungate BA, Stilling PD, Dijkstra P, Johnson DW, Ketterer ME, Hymus GJ, Hinkle CR, Drake BG. 2004. CO2 elicits long-term decline in nitrogen fixation. Science 304, 1291. 10.1126/science.1095549 (doi:10.1126/science.1095549) [DOI] [PubMed] [Google Scholar]
- 61.Vitousek PM, Sanford RL., Jr 1986. Nutrient cycling in moist tropical forest. Annu. Rev. Ecol. Syst. 17, 137–167 10.1146/annurev.es.17.110186.001033 (doi:10.1146/annurev.es.17.110186.001033) [DOI] [Google Scholar]
- 62.Crews TE. 1999. The presence of nitrogen fixing legumes in terrestrial communities: evolutionary vs. ecological considerations. Biogeochemistry 46, 233–246 10.1007/BF01007581 (doi:10.1007/BF01007581) [DOI] [Google Scholar]
- 63.Hedin LO, Brookshire ENJ, Menge DNL, Barron AR. 2009. The nitrogen paradox in tropical forest ecosystems. Annu. Rev. Ecol. Syst. 40, 613–635 10.1146/annurev.ecolsys.37.091305.110246 (doi:10.1146/annurev.ecolsys.37.091305.110246) [DOI] [Google Scholar]
- 64.Martinelli LA, Piccolo MC, Townsend AR, Vitousek PM, Cuevas E, McDowell WH, Robertson GP, Santos OC, Treseder K. 1999. Nitrogen stable isotope composition of leaves and soil: tropical versus temperate forests. Biogeochemistry 46, 45–65 10.1007/BF01007573 (doi:10.1007/BF01007573) [DOI] [Google Scholar]
- 65.Yoneyama T, Muraoka T, Murakami T, Boonkerd N. 1993. Natural abundance of 15N in tropical plants with emphasis on tree legumes. Plant Soil 153, 295–304 10.1007/BF00013003 (doi:10.1007/BF00013003) [DOI] [Google Scholar]
- 66.Ometto JPHB, et al. 2006. The stable carbon and nitrogen isotopic composition of vegetation in tropical forests of the Amazon Basin, Brazil. Biogeochemistry (doi:10.1007/s10533-006-9008-8) [Google Scholar]
- 67.Cleveland CC, Houlton BZ, Neill C, Reed SC, Townsend AR, Wang Y. 2009. Using indirect methods to constrain symbiotic nitrogen fixation rates: a case study from an Amazonian rain forest. Biogeochemistry 99, 1–13 10.1007/s10533-009-9392-y (doi:10.1007/s10533-009-9392-y) [DOI] [Google Scholar]
- 68.Pons TL, Perreijn K, van Kessel C, Werger MJA. 2007. Symbiotic nitrogen fixation in a tropical rainforest: 15N natural abundance measurements supported by experimental isotope enrichment. New Phytol. 173, 154–167 10.1111/j.1469-8137.2006.01895.x (doi:10.1111/j.1469-8137.2006.01895.x) [DOI] [PubMed] [Google Scholar]
- 69.Barron AR, Purves DW, Hedin LO. 2011. Facultative nitrogen fixation by canopy legumes in a lowland tropical forest. Oecologia 165, 511–520 10.1007/s00442-010-1838-3 (doi:10.1007/s00442-010-1838-3) [DOI] [PubMed] [Google Scholar]
- 70.Rastetter EB, Vitousek PM, Field C, Shaver GR, Herbert D, Ågren GA. 2001. Resource optimization and symbiotic N fixation. Ecosystems 4, 369–388 10.1007/s10021-001-0018-z (doi:10.1007/s10021-001-0018-z) [DOI] [Google Scholar]
- 71.Menge DNL, Levin SA, Hedin LO. 2008. Evolutionary tradeoffs can select against nitrogen fixation and thereby maintain nitrogen limitation. Proc. Natl Acad. Sci. USA 105, 1573–1578 10.1073/pnas.0711411105 (doi:10.1073/pnas.0711411105) [DOI] [PMC free article] [PubMed] [Google Scholar]
- 72.Ritchie ME, Tilman D, Knops JMH. 1998. Herbivore effects on plant and nitrogen dynamics in oak savanna. Ecology 79, 165–177 10.1890/0012-9658(1998)079[0165:HEOPAN]2.0.CO;2 (doi:10.1890/0012-9658(1998)079[0165:HEOPAN]2.0.CO;2) [DOI] [Google Scholar]
- 73.Cech PG, Edwards PJ, Olde Venterink H. 2010. Why is the abundance of herbaceous legumes low in African savanna? A test with two model species. Biotropica 42, 580–589 10.1111/j.1744-7429.2009.00622.x (doi:10.1111/j.1744-7429.2009.00622.x) [DOI] [Google Scholar]
- 74.Vitousek PM, Hobbie SE. 2000. The control of heterotrophic nitrogen fixation in decomposing litter. Ecology 81, 2366–2376 10.1890/0012-9658(2000)081[2366:HNFIDL]2.0.CO;2 (doi:10.1890/0012-9658(2000)081[2366:HNFIDL]2.0.CO;2) [DOI] [Google Scholar]
- 75.Reed SC, Cleveland CC, Townsend AR. 2007. Controls over leaf litter and soil nitrogen fixation in two lowland tropical rain forests. Biotropica 39, 585–592 10.1111/j.1744-7429.2007.00310.x (doi:10.1111/j.1744-7429.2007.00310.x) [DOI] [Google Scholar]
- 76.Barron AR, Wurzburger N, Bellenger JP, Wright SJ, Kraepiel AML, Hedin LO. 2009. Molybdenum limitation of asymbiotic nitrogen fixation in tropical soils. Nat. Geosci. 2, 42–45 10.1038/ngeo366 (doi:10.1038/ngeo366) [DOI] [Google Scholar]
- 77.Vitousek PM, Field CB. 2001. Input–output balances and nitrogen limitation in terrestrial ecosystems. In Global biogeochemical cycles in the climate system (eds Schulze ED, Harrison SP, Heimann M, Holland EA, Lloyd J, Prentice IC, Schimel D.), pp. 217–235 San Diego, CA: Academic Press [Google Scholar]
- 78.Vitousek PM. 2004. Nutrient cycling and limitation: Hawai‘i as a model system. Princeton, NJ: Princeton University Press [Google Scholar]
- 79.Menge DNL. 2011. Conditions under which nitrogen can limit steady state net primary production in a general class of ecosystem models. Ecosystems 14, 519–532 10.1007/s10021-011-9426-x (doi:10.1007/s10021-011-9426-x) [DOI] [Google Scholar]
- 80.Menge DNL, Levin SA, Hedin LO. 2009. Facultative versus obligate nitrogen fixation strategies and their ecosystem consequences. Am. Nat. 174, 465–477 10.1086/605377 (doi:10.1086/605377) [DOI] [PubMed] [Google Scholar]
- 81.McKey D. 1994. Legumes and nitrogen: the evolutionary ecology of a nitrogen-demanding lifestyle. In Advances in legume systematics: part 5. The nitrogen factor (eds Sprent JI, McKey D.), pp. 211–228 Kew, UK: Royal Botanic Gardens [Google Scholar]
- 82.Andrews M, James EK, Sprent JI, Boddey RM, Gross E, dos Reis FB., Jr 2011. Nitrogen fixation in legumes and actinorhizal plants in natural ecosystems: values obtained using 15N natural abundance. Plant Ecol. Divers. 4, 131–140 10.1080/17550874.2011.644343 (doi:10.1080/17550874.2011.644343) [DOI] [Google Scholar]
- 83.Houlton BZ, Wang Y-P, Vitousek PM, Field CB. 2008. A unifying framework for di-nitrogen (N2) fixation in the land biosphere. Nature 454, 327–330 10.1038/nature07028 (doi:10.1038/nature07028) [DOI] [PubMed] [Google Scholar]
- 84.Ceuterick F, Peeters J, Heremans K, de Smet H, Olbrechts H. 1978. Effects of high pressure, detergents, and phospholipase on the break in the Arrhenius plot of Azotobacter nitrogenase. Eur. J. Biochem. 87, 401–407 10.1111/j.1432-1033.1978.tb12389.x (doi:10.1111/j.1432-1033.1978.tb12389.x) [DOI] [PubMed] [Google Scholar]