

Abstract
Noonan syndrome (NS) is among the most common Mendelian genetic diseases (∼1/2,000 live births). Most cases (50%–84%) are sporadic, and new mutations are virtually always paternally derived. More than 47 different sites of NS de novo missense mutations are known in the PTPN11 gene that codes for the protein tyrosine phosphatase SHP-2. Surprisingly, many of these mutations are recurrent with nucleotide substitution rates substantially greater than the genome average; the most common mutation, c.922A>G, is at least 2,400 times greater. We examined the spatial distribution of the c.922A>G mutation in testes from 15 unaffected men and found that the mutations were not uniformly distributed across each testis as would be expected for a mutation hot spot but were highly clustered and showed an age-dependent germline mosaicism. Computational modeling that used different stem cell division schemes confirmed that the data were inconsistent with hypermutation, but consistent with germline selection: mutated spermatogonial stem cells gained an advantage that allowed them to increase in frequency. SHP-2 interacts with the transcriptional activator STAT3. Given STAT3’s function in mouse spermatogonial stem cells, we suggest that this interaction might explain the mutant’s selective advantage by means of repression of stem cell differentiation signals. Repression of STAT3 activity by cyclin D1 might also play a previously unrecognized role in providing a germline-selective advantage to spermatogonia for the recurrent mutations in the receptor tyrosine kinases that cause Apert syndrome and MEN2B. Looking at recurrent mutations driven by germline selection in different gene families can help highlight common causal signaling pathways.
Introduction
Noonan syndrome (NS [MIM 163950]) is one the most common Mendelian disorders.1,2 NS features include characteristic craniofacial abnormalities, short stature, heart defects, intellectual disability and delay, and a variety of other anomalies, as well as a predisposition to certain cancers. NS is transmitted in an autosomal-dominant fashion in families but a sizable proportion of cases result from new mutations originating in the germline of the normal father.3 NS mutations can arise in several different genes but mutations in PTPN11 [MIM 176876], the gene encoding the protein tyrosine phosphatase nonreceptor type 11 (SHP-2), are the most frequent contributors. PTPN11 is expressed ubiquitously and plays an important role in animal development.4–6
There are many possible disease-causing missense mutation sites in PTPN11 (∼47) that cause NS; surprisingly, many of these sites show recurrent mutation.7,8 The most common mutation is c.922A>G (p.Asn308Asp).1,9 We conservatively calculate (disease incidence1 × percentage of sporadic cases10–12 × percentage of PTPN11 mutations1,9 × percentage of c.922A>G1,9) that the de novo mutation frequency of the 922A>G mutation exceeds the genome average A>G mutation frequency by more than 2,400 fold. Further, the average age of fathers of NS children is greater than the average of fathers in the general population, consistent with a paternal age effect.3
We use the term RAMP for such disease-causing mutations that are recurrent, transmitted as autosomal dominant, male-biased, and have a paternal age effect. Other examples are the mutations that cause achondroplasia [MIM 100800], Apert syndrome [MIM 101200], and multiple endocrine neoplasia type 2B (MEN2B [MIM 162300]). In this paper, we use a testis dissection and mutation detection strategy we developed previously13–15 to study the spatial distribution of the NS mutation in unaffected men of different ages. Further, we test several computational models of self-renewing Ap spermatogonial (SrAp) stem cell division patterns to see how this high incidence of sporadic cases due to recurrent mutation is achieved. Finally, we provide insights into the possible biochemical basis for a germline selective advantage.
Material and Methods
Source of Testes
Testes came from unaffected donors (NDRI, Philadelphia, PA) not treated with drugs that interfere with normal spermatogenesis and were frozen 10–12 hr after death. Procedures followed the ethical standards of the Institutional Review Board of the University of Southern California and the relevant National Institutes of Health guidelines.
Testis Dissection
Details of the dissections, DNA isolation, and quantitation of the amount of DNA in each testis piece have been published.13–15
c.922A>G Mutation Frequency Assay
We used our modification of a highly sensitive allele-specific PCR assay (pyrophosphorolysis-activated PCR16) with single-molecule sensitivity.13–15 Based on an analysis of 3.3 × 10⁸ control genomes, the false-positive rate of this assay is 9.3 × 10⁻⁷. Each reaction contained 20 mM HEPES (pH 7.6), 30 mM KCl, 50 μM Na4PPi, 2 mM MgCl2, 80 μM of each dNTP, 2 μM Rox, 0.2× Syber Green I, 0.04 units/uL TMA31FS DNA polymerase (see Acknowledgments), DNA containing 25,000 genomes from the testis piece and 160 nM of each primer. The c.922A>G mutation-specific primer sequences (Biosearch) were 5′ TGATCCCAATGAGCCTGTTTCAGATTACATCAATGCAGdd 3′ and 5′ GAAAACACTGTGAAAAGCAAAGCTTACCATGATGATATCdd 3′.
The cycling conditions were initial denaturation 2 min, 94°C, and then 50 cycles of 6 s at 94°C and 40 s at 71°C followed by 90 cycles of 6 s at 94°C and 65 s at 71°C.
Mutation Counting Strategy
We estimated the c.922A>G mutation frequency by using ten reactions (25,000 genomes per reaction) from every testis piece. If less than half were positive, the analysis was repeated at a 1:30 sample dilution. If no mutation was found, we took the number from the initial experiment as an estimate of the mutation frequency (after Poisson correction). If five or more of the original reactions were positive, we repeated the experiment by using diluted samples of the testis piece until fewer than 50% were positive. The presence of a single mutant molecule in any reaction was detected by quantitative PCR and its melting profile.15 Twenty negative controls each contained 25,000 human blood DNA genomes (Promega). Twenty positive controls each contained the same amount of blood genomes plus an average of one genome of DNA from an individual carrying the c.922A>G mutation.
Statistical Testing
The estimate of the average testis mutation frequency (Av) is the average of the frequencies of the testis pieces weighted by the number of genomes (see Table S1 available online) in those pieces. Our general computational strategy is that we find the model parameters that match the observed Av for each testis and then simulate the model with these parameters such that we have one million simulations with an Av within 5% of the Av observed for that testis. For these simulations, we test whether the simulated summary statistics (specifically Mx/Av and F < 50, which are defined in Results) are as great as the statistics observed in the testis data. The p values in Tables 2, 3, S2, and S3 have not been corrected for multiple tests. In this paper, we have performed 120 statistical tests: 15 testes × 4 models × 2 summary statistics. Because almost all of the p values in Table 2 are less than 10−6, both the asymmetric and symmetric hot-spot models are still strongly rejected after a Bonferroni multiple test correction. In Table 3, the single uncorrected p value of 0.01 is not low enough to reject the model after the Bonferroni multiple-test correction. In Web Resources, we provide a link to the computer code to simulate all of the models we test.
Table 2.
Hot-Spot Models Rejected for All Middle-Aged Testes
| Testis | Age |
Model Parameter |
Mx/Av |
F < 50 (%) |
||||
|---|---|---|---|---|---|---|---|---|
| Mutation Rate per Cell Division | Data | Simulated 95% Range | p Value | Data | Simulated 95% Range | p Value | ||
| Asymmetric hot-spot model | ||||||||
| 62923 | 36 | 3.1 × 10⁻⁷ | 130 | 1 – 9 | <10−6 | 90 | 0 – 0 | <10−6 |
| 59089 | 45 | 2.9 × 10⁻⁸ | 31 | 1 – 9 | <10−6 | 93 | 99 – 100a | 1.00 |
| 854-2 | 54 | 1.4 × 10⁻⁶ | 156 | 1 – 5 | <10−6 | 77 | 0 – 0 | <10−6 |
| 374-1 | 62 | 2.2 × 10⁻⁷ | 129 | 1 – 7 | <10−6 | 90 | 0 – 0 | <10−6 |
| 374-2 | 62 | 5.3 × 10⁻⁸ | 62 | 1 – 7 | <10−6 | 94 | 0 – 1 | <10−6 |
|
Symmetric hot-spot model | ||||||||
| 62923 | 36 | 3.1 × 10⁻⁷ | 130 | 2 – 9 | <10−6 | 90 | 0 – 2 | <10−6 |
| 59089 | 45 | 2.9 × 10⁻⁸ | 31 | 5 – 13 | 8 × 10⁻⁴ | 93 | 84 – 90a | 1 × 10⁻⁴ |
| 854-2 | 54 | 1.4 × 10⁻⁶ | 156 | 1 – 5 | <10−6 | 77 | 0 – 0 | <10−6 |
| 374-1 | 62 | 2.2 × 10⁻⁷ | 129 | 2 – 6 | <10−6 | 90 | 0 – 1 | <10−6 |
| 374-2 | 62 | 5.3 × 10⁻⁸ | 62 | 4 – 9 | <10−6 | 94 | 47 – 58 | <10−6 |
Testis 59089 is the only middle-aged testis with Av less than 50 pmg (23 pmg), so it is not surprising that the range of F < 50 values in the simulations is higher than for the other testes.
Table 3.
Selection Models Consistent with the Data for All Middle-Aged Testes
| Testis | Age |
Model Parameters |
Mx/Av |
F < 50 (%) |
|||||
|---|---|---|---|---|---|---|---|---|---|
| Mutation Rate per Cell Division | Selection Parameter | Data | Simulated 95% Range | p Value | Data | Simulated 95% Range | p Value | ||
| Asymmetric selection model | |||||||||
| 62923 | 36 | 3.7 × 10⁻¹¹ | 0.022 | 130 | 37 – 157 | 0.09 | 90 | 90 – 97 | 0.96 |
| 59089 | 45 | 9.6 × 10⁻¹¹ | 0.011 | 31 | 20 – 72 | 0.64 | 93 | 88 – 94 | 0.10 |
| 854-2 | 54 | 1.3 × 10⁻¹¹ | 0.015 | 156 | 39 – 171 | 0.06 | 77 | 89 – 97 | 1.00 |
| 374-1 | 62 | 1.6 × 10⁻¹¹ | 0.011 | 129 | 39 – 164 | 0.12 | 90 | 90 – 97 | 0.97 |
| 374-2 | 62 | 2.6 × 10⁻¹¹ | 0.0095 | 62 | 33 – 135 | 0.56 | 94 | 90 – 96 | 0.33 |
|
Symmetric selection model | |||||||||
| 62923 | 36 | 5.9 × 10⁻¹⁰ | 0.0078 | 130 | 34 – 140 | 0.04 | 90 | 88 – 96 | 0.86 |
| 59089 | 45 | 3.4 × 10⁻⁹ | 0.0024 | 31 | 16 – 55 | 0.34 | 93 | 86 – 92 | 0.01 |
| 854-2 | 54 | 9.2 × 10⁻¹¹ | 0.0064 | 156 | 46 – 190 | 0.15 | 77 | 92 – 99 | 1.00 |
| 374-1 | 62 | 4.0 × 10⁻¹⁰ | 0.0038 | 129 | 38 – 160 | 0.11 | 90 | 90 – 97 | 0.96 |
| 374-2 | 62 | 7.9 × 10⁻¹⁰ | 0.0028 | 62 | 32 – 127 | 0.49 | 94 | 89 – 96 | 0.23 |
Results
We divide the testes of 15 unaffected men each into 192 approximately equal pieces (first we cut each testis into six slices, then we further divide each slice into 32 pieces), and measure the c.922A>G mutation frequency in each testis piece. In Figure 1, the mutation frequencies for each testis piece (measured in units of mutations per million genomes, or pmg) are represented by colors ranging from light gray to dark brown. Note that the distribution of mutations in most testes appears clustered and not uniform as would be expected if the c.922A disease site were hypermutable.13–15 The mutation frequencies for all of the testis pieces are listed in Table S1.
Figure 1.
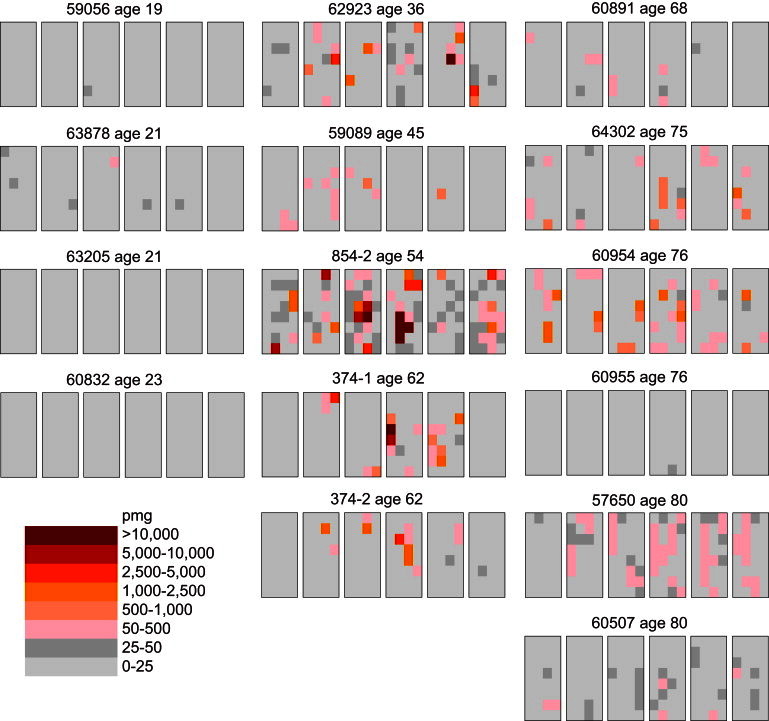
Testis Data Obtained from 15 Unaffected Donors of Various Ages
Each testis is cut into six slices (left to right), and each slice is further divided into 32 pieces (four pieces wide and eight pieces long). The frequency of the Noonan syndrome PTPN11 c.922A>G mutation is measured in each testis piece in units of mutants per million genomes (pmg). The data in the left column are from the testes of the youngest age group; all the testis pieces have low-mutation frequencies. The data in the middle column are from the testes of the middle-age group; the mutations are clustered. The data in the right column are from the testes of the oldest age group; these testes are heterogeneous as some are like those in the youngest age group while others are similar to those in the middle-age group.
In Table 1, we use several statistics to summarize both the mutation frequency and their clustering. For each testis, we consider the average mutation frequency of all of the testis pieces (Av). Because most of the mutations are clustered in a small number of testis pieces, we also consider the testis piece with the maximum mutation frequency (Mx). To normalize for the different testes’ average frequencies, we compute the ratio of Mx to Av (Mx/Av). Most of the pieces in any testis have relatively low frequencies. Thus for each testis we also calculate the fraction (F < 50) of testis pieces with mutation frequencies less than 50 pmg (colored light or dark gray in Figure 1) as another measure of clustering.
Table 1.
Summary of Testis Data
| Testis | Age | Ava(pmgb) | Mxc(pmg) | Mx/Avd | F < 50e(%) |
|---|---|---|---|---|---|
| 59056 | 19 | 0.8 | 32 | 39 | 100 |
| 63878 | 21 | 9 | 73 | 8 | 99 |
| 63205 | 21 | 0.2 | 8 | 40 | 100 |
| 60832 | 23 | 0.6 | 20 | 33 | 100 |
| 62923 | 36 | 172 | 22,306 | 130 | 90 |
| 59089 | 45 | 23 | 712 | 31 | 93 |
| 854-2 | 54 | 1,338 | 208,210 | 156 | 77 |
| 374-1 | 62 | 256 | 33,081 | 129 | 90 |
| 374-2 | 62 | 63 | 3,849 | 62 | 94 |
| 60891 | 68 | 5 | 76 | 14 | 95 |
| 64302 | 75 | 59 | 1,018 | 17 | 90 |
| 60954 | 76 | 112 | 1,986 | 18 | 81 |
| 60955 | 76 | 0.3 | 40 | 124 | 100 |
| 57650 | 80 | 52 | 385 | 7 | 76 |
| 60507 | 80 | 14 | 119 | 8 | 97 |
Av, average testis mutation frequency.
pmg, mutants per million genomes.
Mx, maximum testis piece mutation frequency.
Mx/Av, normalization to compare different testes.
F < 50, fraction of testis pieces with mutation frequencies less than 50 pmg.
The youngest age group consists of testes from four individuals with ages ranging from 19 to 23 years. For all of the testes in this age group, there are relatively few mutations: both the Av and Mx values are low. The middle-aged group contains five testes from donors ranging in age from 36 to 62 years. All of these testes have high mutation frequencies, and the mutations are clustered: the Av values are high, the Mx values are much greater still, yet most of the testis pieces have low mutation frequencies indicated by the F < 50 fractions near 90%. Six testes from individuals ranging in age from 68 to 80 years comprise the oldest age group. This age group is heterogeneous because some of the testes are similar to those in the youngest age group, whereas others are like those in the middle-aged group. As a control, we previously showed for two middle-aged testes that mutations at a nondisease CpG site on another chromosome had no mutation clusters but rather a uniform distribution and each testis piece exhibited a low mutation frequency.15
Hot-Spot Models
We test two different hot-spot models (so named because the mutation rate per cell division at the disease site can be substantially greater than the genome average) with two different adult SrAp cell-division schemes (asymmetric17,18 and symmetric19–21). Simulations of the asymmetric hot-spot model13–15 (described in Figure 2A), do not produce the extreme mutation clusters observed in the testes; rather, the mutations are relatively uniformly distributed. Table 2 shows that this model is strongly rejected (p value < 10−6) for all of the middle-aged testes. As an example, consider testis 374-2 from a 62-year-old donor. For those simulations of the asymmetric hot-spot model with Av values within 5% of that observed in this testis, the 95% range of the Mx/Av ratio is between 1 and 7. However, the Mx/Av ratio observed in the testis is much greater at 62. In fact, in one million simulations of this model, none of the Mx/Av ratios is as great as is observed in the testis; therefore, the asymmetric hot-spot model is rejected with a p value less than 10−6.
Figure 2.
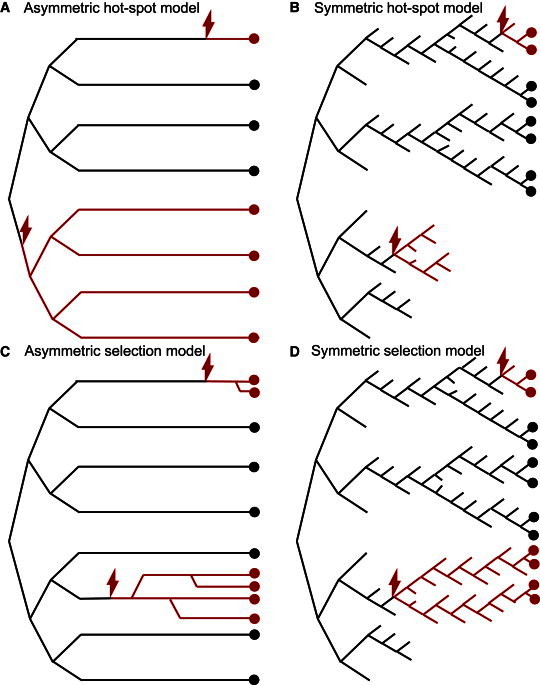
Self-Renewing Ap Spermatogonial Stem Cell (SrAp) Division Models
In each cartoon, time advances from left to right: the growth phase (zygote formation to puberty) is shown on the left and the adult phase (after puberty) on the right. In all of the models, the growth phase divisions are symmetric (only three generations are depicted, but in the actual model there are 30 growth phase generations). The black lines represent WT SrAp lineages, each red lightning bolt indicates a single mutation event, and the red lines represent mutated SrAp lineages. The circles represent SrAp cells (colored red or black depending on whether they are mutated or not, respectively) present when the testis is studied. For the symmetric division models, if a SrAp undergoes differentiation, then that lineage is terminated (the black or red lines are not further extended). The models differ in the types of divisions in the adult phase; in all models, these divisions occur every 16 days.22
(A) The asymmetric hot-spot model. A single mutation in the growth phase (bottom half) produces a mutation cluster. The adult-phase divisions are asymmetric, producing one SrAp (self-renewal) and one differentiated cell (B spermatogonia, not pictured). Single mutations in the adult phase (top lineage) do not produce mutation clusters. This model has one parameter: the mutation rate per cell division.
(B) The symmetric hot-spot model. Half of the adult phase divisions are symmetric, producing two SrAp cells, while half of the adult phase divisions produce only differentiated cells (not pictured), thus ending those stem cell lineages. Mutations in the adult phase can randomly grow into mutation clusters (top lineage), but these clusters can also randomly diminish and even die out (lower part of the figure). This model has one parameter: the mutation rate per cell division.
(C) The asymmetric selection model. Mutated SrAp in the adult phase (unlike WT SrAp) occasionally divide symmetrically, thus producing mutation clusters. On average, earlier mutations in the adult phase (third lineage from the bottom) produce larger clusters than later mutations (top lineage). This model has two parameters: the mutation rate per cell division and the selection parameter p (mutated SrAp divide symmetrically with probability p).
(D) The symmetric selection model. Mutated SrAp in the adult phase (unlike WT SrAp) have a slight preference for self-renewal divisions over differentiation, increasing the chance for cluster formation (top lineage and lower part of the figure). This model has two parameters: the mutation rate per cell division and the selection parameter p (mutated SrAp divide symmetrically with probability 0.5+p, and differentiate with probability 0.5−p).
The symmetric hot-spot model14 (Figure 2B) shows slightly more evidence of clustering than the asymmetric hot-spot model. For example, for testis 374-2 the 95% range of the Mx/Av ratio is between 4 and 9. However, like the hot-spot model, this range is substantially lower than the value observed in the testis, and we also strongly reject the symmetric hot-spot model (p value < 10−6). Table 2 shows that the results are similar for the F < 50 fraction statistic, and for the other middle-aged testes. In Table S2, we show that both hot-spot models are also rejected for those testes in the oldest age group with substantial mutation clusters.
Selection Models
The two selection models are based on the cell-division schemes of the two hot-spot models, but the mutated SrAp gain a new function encouraging cluster formation that is absent from the wild-type (WT) SrAp. Table 3 shows that the asymmetric selection model13–15 (Figure 2C) is consistent with the data from the middle-aged testes. As an example, again consider testis 374-2. If the probability that the mutated SrAp divide symmetrically is 0.0095, then the 95% range of the Mx/Av ratio is between 33 and 135. Because the Mx/Av ratio observed in this testis is 62, the asymmetric selection model is consistent with the data.
We propose a symmetric selection model (Figure 2D) in this paper. For testis 374-2, if the probability of a symmetric self-renewal division for the mutated SrAp is 0.5028 (and the probability of differentiation is 0.4972), then the 95% range of the Mx/Av ratio is between 32 and 127. Because this range contains the value observed in the testis, the symmetric selection model is also consistent with the data. Table 3 shows that the results are similar for the F < 50 fraction, and for the other middle-aged testes.
Age Effects
In Table S3, we show that both selection models are also consistent with the testes from the youngest and oldest age groups. With model parameters similar to those inferred for the middle-aged testes, the selection models predict low mutation frequencies for the testes from the youngest age group as a result of the lower number of adult-phase divisions that they have experienced. The heterogeneity in the oldest age group was previously observed for the MEN2B mutation14 and was accounted for in that publication, as well as this one by incorporating age-dependent cell death into the model. Supporting this modeling inclusion, the number of SrAp has been measured to decrease as men age, with most of this decrease occurring after age 60.23,24 Moreover, because we performed the experiments for the NS and MEN2B mutations on the same testes, we can now report that there is one testis from the oldest age group with NS mutation clusters but few MEN2B mutations and another older testis with few NS mutations but MEN2B mutation clusters (as well as older testes that have both NS and MEN2B mutation clusters, and older testes that have few NS and MEN2B mutations). This diversity indicates that the mutation clusters for the different mutations originate and evolve independently of each other.
Discussion
Our testis dissection and mutation detection experiments reveal that the NS c.922A>G PTPN11 mutation frequency in middle-age testis donors is substantially greater than the genome average. However, the testis experiments also reveal something that could not be learned from epidemiological data, namely, that the mutations are highly clustered in the testes. The challenge for the modeling was to explain both the average mutation frequency and the clustering.
Modeling
The hot-spot models are an attempt to explain the elevated mutation frequency by assuming that the mutation rate per cell division at the disease site is substantially greater than the genome average. Both the asymmetric and the symmetric hot-spot models are strongly rejected (p values less than 10−6) because they cannot reproduce the extreme mutation clustering observed in the testes. The symmetric hot-spot model, unlike the asymmetric hot-spot model, allows for the possibility for mutation clusters to grow in the adult but these clusters can also diminish and even die out when SrAp cells differentiate rather than divide symmetrically. When we tested this model, it was not consistent with the testis data even under varying probabilities of symmetric division and differentiation events (Table S4).
In addition to varying the cell division scheme, we have considered other modifications to the hot-spot models. For example, it is conceivable that the overall mutation rate increases as men age, possibly due to a decrease in the efficiency of DNA repair.25 Such a change would contribute to the paternal age effect; however, the additional mutations would be spatially uniform and not clustered in the testes. Also, the estimate of the SrAp division rate22 might be incorrect, or this rate might change with age. Although such changes could alter the inferred value of the mutation rate per cell-division model parameter, it would not lead to mutation clusters. We have not been able to successfully modify the hot-spot models to make them consistent with the extreme clustering we observe in the testes, neither with these proposals nor with previously considered modifications.13–15
A different type of model incorporates selection where a mutated SrAp gains a new function encouraging cluster formation that is absent from WT SrAp. Both the asymmetric and the symmetric selection models employ a similar form of selection: in the asymmetric model the mutated SrAp occasionally divide symmetrically, and in the symmetric model the SrAp are slightly more likely to divide symmetrically than to differentiate. We have also considered other forms of selection; for example, mutated SrAp might divide more quickly or be less likely to die than WT SrAp, but these other forms of selection cannot explain the mutation clustering under biologically realistic conditions.
Both selection models we use in this paper are consistent with the testis data. Moreover, the inferred mutation rates per cell division are what we expect for a neutral site at the genome average,13–15 demonstrating that high mutation frequencies can be produced by selection rather than hypermutation.
Molecular Analysis of Germline Selection
The NS mutation we studied is the most extreme example yet of a de novo recurrent base substitution that enters the human population each generation not because of hypermutation but through germline selection. SHP-2 affects signaling by removing phosphate groups from phosphorylated tyrosines of specific target proteins and is itself activated by its binding to phosphorylated tyrosines on receptor tyrosine kinases and other proteins.4–6 This can lead to both the enhancement and inhibition of different signaling pathways. This includes positive regulation of RAS/MAPK (mitogen activated protein kinase), PI3K (phosinositide-3-kinase)/AKT, and SFK (src family kinases) signaling and also negative regulation of STAT3 (signal transducer and activator of transcription 3 [MIM 102582]) signaling.5,26,27
We are not aware of any published reports directly examining SHP-2’s role in the self-renewal of mouse spermatogonial stem cell (SSC) cultures or in testes. The NS mutant protein could be contributing to germline selection through any one or a combination of perturbations to the normal signaling of these pathways. However, the STAT3 pathway is of special interest given its known role in mouse SSC function.
Self-renewal of SSC must be accompanied by the differentiation of SSC for sperm production and these events should be equally balanced throughout a male’s life. Interestingly, STAT3 signaling in mouse SSC plays an important role in the differentiation step.28,29 For example, inhibiting STAT3 activity with Stat3-specific small hairpin RNAs in mouse SSC cultures increased SSC self-renewal but not general spermatogonial proliferation. When these altered SSC were transplanted into germ cell-free testes, they proliferated but failed to produce the differentiated stages typical of normal spermatogenesis.
A specific interaction between the STAT3 and SHP-2 proteins therefore is of exceptional interest to germline selection. Studies of nongermline adult mouse cells have suggested that STAT3 signaling is negatively regulated by SHP-2.27 In this same nongermline system, the function of the hyperactivated NS p.Asn308Asp allele of SHP-2 that we studied was shown to enhance this negative regulation of STAT3.27 If this type of regulation is also found in SrAp cells, further lowering STAT3 signaling by this mutant SHP-2 could result in a subtle bias toward stem cell self-renewal divisions over events leading to differentiated cells, providing a possible explanation for the germline selective advantage.
STAT3 and Receptor Tyrosine Kinase Connections
Apert syndrome is a form of craniosynostosis, and MEN2B is characterized by aggressive thyroid cancer and variable penetrance of hyperplasia or tumors in the adrenal glands. Apert syndrome is dominated by recurrent c.755C>G (p.Ser252Trp) and c.758C>G (p.Pro253Arg) mutations in the receptor tyrosine kinase gene fibroblast growth factor receptor II (FGFR2 [MIM 176943]).30 The recurrent MEN2B mutation c.2943T>C (p.Met918Thr) arises in the receptor tyrosine kinase gene RET (“rearranged during transfection” proto-oncogene [MIM 164761]).31 By using the testis dissection and mutation detection method, we previously showed that each of these three RAMP disease sites also do not undergo hypermutation but rather that the unexpectedly high mutation rate per generation appears to be the consequence of germline selection.13–15 A study by others on one of the two Apert syndrome mutations using sperm samples also proposed selection over hypermutation.32
Activation of both the normal RET and FGFR2 receptor kinases have been shown to play a critical role in mouse SSC self-renewal mediated by the PI3K/AKT, SFK, and RAS/MAPK signaling pathways.33–36 The Apert syndrome and MEN2B disease mutations result in hyperactivation of the FGFR2 and RET receptor tyrosine kinase downstream signaling pathways, respectively.37–41 Interestingly, there might be a connection between STAT3 inhibition and the germline selective advantage provided by the Apert syndrome and MEN2B mutations. Studies on self-renewal in genetically modified mouse germline stem cell cultures in the presence of the growth factors required for self-renewal examined the roles of activating H-ras mutations and four cyclin proteins important for the progression of the cell cycle including cyclin D1 (G1/S-specific cyclin D1, CCND1 [MIM 168461]).42 These authors concluded that there is a complicated relationship among the different cyclins regarding their contribution to SSC self-renewal but suggested a role for CCND1 in directing SSC toward the differentiation pathway. This is relevant to our discussion because it has been found that CCND1 can represses the synthesis of STAT3 protein, as well as bind to STAT3 to inhibit its activity in nongermline cells.43
Based on our interpretation of the NS, Apert syndrome and MEN2B results we propose that an important contribution to establishing a germline selective advantage might be repression of stem cell differentiation pathways rather than simply activation of self-renewal signals as has been previously emphasized.14,44 The construction of mouse SSC cell lines grown in chemically defined media and carrying the RAMP mutants we studied could be used to examine the biochemical effects of these mutations on SSC signaling, especially with regards to the role of STAT3 and CCND1.
Other PTPN11 Mutations
Excluding the NS mutation we studied, we calculate that 19 (37%) of the ∼47 other PTPN11 codons with NS disease mutations7 are highly recurrent with frequencies ranging from 240 to 720 times greater than the expected genome-wide mutation frequency (based on their relative frequency to that of the p.Asn308Asp mutation7). If a substantial fraction of these 19 mutations were also found to produce mutation clusters, it would suggest that the major mutational contributions to this common Mendelian disorder might be based on germline selection. Although this idea is appealing, PTPN11 mutations that produce a different disease must also be considered (LEOPARD syndrome [MIM 151100]). The two most common LEOPARD syndrome mutations (c.836A>G [p.Tyr279Cys] and c.1403C>T [p.Thr468Met]) have a recurrence rate approximately one-third that of the c.922A>G NS mutation7 and are candidates for a germline selection-mediated RAMP phenotype. However, these two LEOPARD syndrome mutations are dominant negative compared to the gain-of-function NS mutations.45 Can a germline selective advantage be explained by either a dominant-negative or a gain-of-function mutation? The fact that there are many overlapping clinical features of LEOPARD syndrome and NS supports this possibility and plausible explanations have been suggested.45 Only experimentation in spermatogonial stem cell lines will be able to answer this question definitively most likely by using mouse SSC or, eventually,46–48 pure cultures of human spermatogonial stem cells.
Impact of Germline Selection
Germline selection can explain the RAMP features present in NS, Apert syndrome, and MEN2B: the recurrent high mutation frequency, male mutation bias, and paternal age effect.3,14,25,44,49 That some mutations might have a positive selective advantage in the germline and yet provide a selective disadvantage to individuals who inherit them was considered by Hastings.50 Germline selection acts to increase the frequency at which a new mutation enters the population each generation significantly beyond that expected by its mutation rate per cell division, thereby disproportionately increasing the population’s mutational load. There are now documented cases of four such human mutations at three loci that appear to be examples of this phenomenon.
Acknowledgments
Research reported in this publication was supported by the National Institute of General Medical Sciences under award number R01GM36745 (N.A. and P.C.) and the National Heart, Lung and Blood Institute under award number HL071207 (B.D.G.) of the National Institutes of Health. The content is solely the responsibility of the authors and does not necessarily represent the official views of the National Institute of General Medical Sciences, National Heart, Lung and Blood Institute, or National Institutes of Health. One of the authors (B.D.G.) has the following conflict of interest: royalty payments for PTPN11 mutation testing for Noonan syndrome from GeneDx, Correlegan, Prevention Genetics, Lab Corp, Baylor College of Medicine and Harvard/Partners. We thank Jon Oatley for helpful discussions and Thomas Myers for Tma31FS DNA polymerase. (Research samples of Tma31FS can be obtained from Dr. Thomas W. Myers, thomas.myers@roche.com, Director, Program in Core Research, Roche Molecular Systems, 4300 Hacienda Drive, Pleasanton, CA 94588.)
Contributor Information
Peter Calabrese, Email: petercal@usc.edu.
Norman Arnheim, Email: arnheim@usc.edu.
Supplemental Data
Web Resources
The URLs for data presented herein are as follows:
Online Mendelian Inheritance in Man (OMIM), http://www.omim.org/
Simulation code and instructions for germline hot-spot and selection models, http://www.cmb.usc.edu/people/petercal/testis/pind.html
References
- 1.Tartaglia M., Gelb B.D. Noonan syndrome and related disorders: genetics and pathogenesis. Annu. Rev. Genomics Hum. Genet. 2005;6:45–68. doi: 10.1146/annurev.genom.6.080604.162305. [DOI] [PubMed] [Google Scholar]
- 2.Allanson, J.E., and Roberts, A.E. Noonan Syndrome. (2001 Nov 15 [Updated 2011 Aug 4]). In: Pagon, R.A., Bird, T.D., Dolan, C.R., et al., eds. GeneReviews™ [Internet]. Seattle (WA): University of Washington, Seattle; 1993-.
- 3.Tartaglia M., Cordeddu V., Chang H., Shaw A., Kalidas K., Crosby A., Patton M.A., Sorcini M., van der Burgt I., Jeffery S., Gelb B.D. Paternal germline origin and sex-ratio distortion in transmission of PTPN11 mutations in Noonan syndrome. Am. J. Hum. Genet. 2004;75:492–497. doi: 10.1086/423493. [DOI] [PMC free article] [PubMed] [Google Scholar]
- 4.Dance M., Montagner A., Salles J.P., Yart A., Raynal P. The molecular functions of Shp2 in the Ras/Mitogen-activated protein kinase (ERK1/2) pathway. Cell. Signal. 2008;20:453–459. doi: 10.1016/j.cellsig.2007.10.002. [DOI] [PubMed] [Google Scholar]
- 5.Grossmann K.S., Rosário M., Birchmeier C., Birchmeier W. The tyrosine phosphatase Shp2 in development and cancer. Adv. Cancer Res. 2010;106:53–89. doi: 10.1016/S0065-230X(10)06002-1. [DOI] [PubMed] [Google Scholar]
- 6.Mohi M.G., Neel B.G. The role of Shp2 (PTPN11) in cancer. Curr. Opin. Genet. Dev. 2007;17:23–30. doi: 10.1016/j.gde.2006.12.011. [DOI] [PubMed] [Google Scholar]
- 7.Tartaglia M., Gelb B.D. RAS signaling defects and Noonan syndrome. In: Epstein C.J., Erickson R.P., Wynshaw-Boris A., editors. Inborn Errors of Development. Oxford University Press; 2008. pp. 620–631. [Google Scholar]
- 8.Tartaglia M., Zampino G., Gelb B.D. Noonan syndrome: clinical aspects and molecular pathogenesis. Mol Syndromol. 2010;1:2–26. doi: 10.1159/000276766. [DOI] [PMC free article] [PubMed] [Google Scholar]
- 9.Jongmans M., Sistermans E.A., Rikken A., Nillesen W.M., Tamminga R., Patton M., Maier E.M., Tartaglia M., Noordam K., van der Burgt I. Genotypic and phenotypic characterization of Noonan syndrome: new data and review of the literature. Am. J. Med. Genet. A. 2005;134A:165–170. doi: 10.1002/ajmg.a.30598. [DOI] [PubMed] [Google Scholar]
- 10.Bertola D.R., Pereira A.C., Albano L.M., De Oliveira P.S., Kim C.A., Krieger J.E. PTPN11 gene analysis in 74 Brazilian patients with Noonan syndrome or Noonan-like phenotype. Genet. Test. 2006;10:186–191. doi: 10.1089/gte.2006.10.186. [DOI] [PubMed] [Google Scholar]
- 11.Jongmans M., Otten B., Noordam K., van der Burgt I. Genetics and variation in phenotype in Noonan syndrome. Horm. Res. 2004;62(Suppl 3):56–59. doi: 10.1159/000080500. [DOI] [PubMed] [Google Scholar]
- 12.Mendez H.M., Opitz J.M. Noonan syndrome: a review. Am. J. Med. Genet. 1985;21:493–506. doi: 10.1002/ajmg.1320210312. [DOI] [PubMed] [Google Scholar]
- 13.Choi S.K., Yoon S.R., Calabrese P., Arnheim N. A germ-line-selective advantage rather than an increased mutation rate can explain some unexpectedly common human disease mutations. Proc. Natl. Acad. Sci. USA. 2008;105:10143–10148. doi: 10.1073/pnas.0801267105. [DOI] [PMC free article] [PubMed] [Google Scholar]
- 14.Choi S.K., Yoon S.R., Calabrese P., Arnheim N. Positive selection for new disease mutations in the human germline: evidence from the heritable cancer syndrome multiple endocrine neoplasia type 2B. PLoS Genet. 2012;8:e1002420. doi: 10.1371/journal.pgen.1002420. [DOI] [PMC free article] [PubMed] [Google Scholar]
- 15.Qin J., Calabrese P., Tiemann-Boege I., Shinde D.N., Yoon S.R., Gelfand D., Bauer K., Arnheim N. The molecular anatomy of spontaneous germline mutations in human testes. PLoS Biol. 2007;5:e224. doi: 10.1371/journal.pbio.0050224. [DOI] [PMC free article] [PubMed] [Google Scholar]
- 16.Liu Q., Sommer S.S. Detection of extremely rare alleles by bidirectional pyrophosphorolysis-activated polymerization allele-specific amplification (Bi-PAP-A): measurement of mutation load in mammalian tissues. Biotechniques. 2004;36:156–166. doi: 10.2144/04361DD03. [DOI] [PubMed] [Google Scholar]
- 17.Knoblich J.A. Asymmetric cell division: recent developments and their implications for tumour biology. Nat. Rev. Mol. Cell Biol. 2010;11:849–860. doi: 10.1038/nrm3010. [DOI] [PMC free article] [PubMed] [Google Scholar]
- 18.Spradling A., Fuller M.T., Braun R.E., Yoshida S. Germline stem cells. Cold Spring Harb. Perspect. Biol. 2011;3:a002642. doi: 10.1101/cshperspect.a002642. [DOI] [PMC free article] [PubMed] [Google Scholar]
- 19.Ehmcke J., Schlatt S. A revised model for spermatogonial expansion in man: lessons from non-human primates. Reproduction. 2006;132:673–680. doi: 10.1530/rep.1.01081. [DOI] [PubMed] [Google Scholar]
- 20.Klein A.M., Nakagawa T., Ichikawa R., Yoshida S., Simons B.D. Mouse germ line stem cells undergo rapid and stochastic turnover. Cell Stem Cell. 2010;7:214–224. doi: 10.1016/j.stem.2010.05.017. [DOI] [PubMed] [Google Scholar]
- 21.Klein A.M., Simons B.D. Universal patterns of stem cell fate in cycling adult tissues. Development. 2011;138:3103–3111. doi: 10.1242/dev.060103. [DOI] [PubMed] [Google Scholar]
- 22.Heller C.G., Clermont Y. Spermatogenesis in man: an estimate of its duration. Science. 1963;140:184–186. doi: 10.1126/science.140.3563.184. [DOI] [PubMed] [Google Scholar]
- 23.Johnson L. Spermatogenesis and aging in the human. J. Androl. 1986;7:331–354. doi: 10.1002/j.1939-4640.1986.tb00943.x. [DOI] [PubMed] [Google Scholar]
- 24.Nistal M., Codesal J., Paniagua R., Santamaria L. Decrease in the number of human Ap and Ad spermatogonia and in the Ap/ Ad ratio with advancing age. New data on the spermatogonial stem cell. J. Androl. 1987;8:64–68. doi: 10.1002/j.1939-4640.1987.tb00950.x. [DOI] [PubMed] [Google Scholar]
- 25.Arnheim N., Calabrese P. Understanding what determines the frequency and pattern of human germline mutations. Nat. Rev. Genet. 2009;10:478–488. doi: 10.1038/nrg2529. [DOI] [PMC free article] [PubMed] [Google Scholar]
- 26.Neel B.G., Chan G., Dhanji S. SH2 Domain-Containing Protein-Tyrosine Phosphatases. In: Bradshaw R.A., Dennis E.A., editors. Handbook of cell signaling. Second Edition. Academic Press; San Diego, CA: 2010. pp. 771–810. [Google Scholar]
- 27.Zhang W., Chan R.J., Chen H., Yang Z., He Y., Zhang X., Luo Y., Yin F., Moh A., Miller L.C. Negative regulation of Stat3 by activating PTPN11 mutants contributes to the pathogenesis of Noonan syndrome and juvenile myelomonocytic leukemia. J. Biol. Chem. 2009;284:22353–22363. doi: 10.1074/jbc.M109.020495. [DOI] [PMC free article] [PubMed] [Google Scholar]
- 28.Oatley J.M., Kaucher A.V., Avarbock M.R., Brinster R.L. Regulation of mouse spermatogonial stem cell differentiation by STAT3 signaling. Biol. Reprod. 2010;83:427–433. doi: 10.1095/biolreprod.109.083352. [DOI] [PMC free article] [PubMed] [Google Scholar]
- 29.Kaucher A.V., Oatley M.J., Oatley J.M. NEUROG3 is a critical downstream effector for STAT3-regulated differentiation of mammalian stem and progenitor spermatogonia. Biol. Reprod. 2012;86:1–11. doi: 10.1095/biolreprod.111.097386. [DOI] [PMC free article] [PubMed] [Google Scholar]
- 30.Robin, N.H., Falk, M.J., and Haldeman-Englert, C.R. FGFR-Related Craniosynostosis Syndromes. (1998 Oct 20 [Updated 2011 Jun 7]). In: Pagon, R.A., Bird, T.D., Dolan CR, et al., eds. GeneReviews™ [Internet]. Seattle (WA): University of Washington, Seattle; 1993-.
- 31.Moline, J., and Eng, C. Multiple Endocrine Neoplasia Type 2. (1999 Sep 27 [Updated 2013 Jan 10]). In: Pagon, R.A., Bird, T.D., Dolan, C.R., et al., eds. GeneReviews™ [Internet]. Seattle (WA): University of Washington, Seattle; 1993-. [PubMed]
- 32.Goriely A., McVean G.A., Röjmyr M., Ingemarsson B., Wilkie A.O. Evidence for selective advantage of pathogenic FGFR2 mutations in the male germ line. Science. 2003;301:643–646. doi: 10.1126/science.1085710. [DOI] [PubMed] [Google Scholar]
- 33.Oatley J.M., Brinster R.L. Regulation of spermatogonial stem cell self-renewal in mammals. Annu. Rev. Cell Dev. Biol. 2008;24:263–286. doi: 10.1146/annurev.cellbio.24.110707.175355. [DOI] [PMC free article] [PubMed] [Google Scholar]
- 34.Yoshida S. Stem cells in mammalian spermatogenesis. Dev. Growth Differ. 2010;52:311–317. doi: 10.1111/j.1440-169X.2010.01174.x. [DOI] [PubMed] [Google Scholar]
- 35.Ishii K., Kanatsu-Shinohara M., Toyokuni S., Shinohara T. FGF2 mediates mouse spermatogonial stem cell self-renewal via upregulation of Etv5 and Bcl6b through MAP2K1 activation. Development. 2012;139:1734–1743. doi: 10.1242/dev.076539. [DOI] [PubMed] [Google Scholar]
- 36.Savitt J., Singh D., Zhang C., Chen L.C., Folmer J., Shokat K.M., Wright W.W. The in vivo response of stem and other undifferentiated spermatogonia to the reversible inhibition of glial cell line-derived neurotrophic factor signaling in the adult. Stem Cells. 2012;30:732–740. doi: 10.1002/stem.1028. [DOI] [PMC free article] [PubMed] [Google Scholar]
- 37.Eswarakumar V.P., Lax I., Schlessinger J. Cellular signaling by fibroblast growth factor receptors. Cytokine Growth Factor Rev. 2005;16:139–149. doi: 10.1016/j.cytogfr.2005.01.001. [DOI] [PubMed] [Google Scholar]
- 38.Turner N., Grose R. Fibroblast growth factor signalling: from development to cancer. Nat. Rev. Cancer. 2010;10:116–129. doi: 10.1038/nrc2780. [DOI] [PubMed] [Google Scholar]
- 39.Arighi E., Borrello M.G., Sariola H. RET tyrosine kinase signaling in development and cancer. Cytokine Growth Factor Rev. 2005;16:441–467. doi: 10.1016/j.cytogfr.2005.05.010. [DOI] [PubMed] [Google Scholar]
- 40.Runeberg-Roos P., Saarma M. Neurotrophic factor receptor RET: structure, cell biology, and inherited diseases. Ann. Med. 2007;39:572–580. doi: 10.1080/07853890701646256. [DOI] [PubMed] [Google Scholar]
- 41.Wells S.A., Jr., Santoro M. Targeting the RET pathway in thyroid cancer. Clin. Cancer Res. 2009;15:7119–7123. doi: 10.1158/1078-0432.CCR-08-2742. [DOI] [PubMed] [Google Scholar]
- 42.Lee J., Kanatsu-Shinohara M., Morimoto H., Kazuki Y., Takashima S., Oshimura M., Toyokuni S., Shinohara T. Genetic reconstruction of mouse spermatogonial stem cell self-renewal in vitro by Ras-cyclin D2 activation. Cell Stem Cell. 2009;5:76–86. doi: 10.1016/j.stem.2009.04.020. [DOI] [PubMed] [Google Scholar]
- 43.Germain D., Frank D.A. Targeting the cytoplasmic and nuclear functions of signal transducers and activators of transcription 3 for cancer therapy. Clin. Cancer Res. 2007;13:5665–5669. doi: 10.1158/1078-0432.CCR-06-2491. [DOI] [PubMed] [Google Scholar]
- 44.Goriely A., Wilkie A.O. Paternal age effect mutations and selfish spermatogonial selection: causes and consequences for human disease. Am. J. Hum. Genet. 2012;90:175–200. doi: 10.1016/j.ajhg.2011.12.017. [DOI] [PMC free article] [PubMed] [Google Scholar]
- 45.Kontaridis M.I., Swanson K.D., David F.S., Barford D., Neel B.G. PTPN11 (Shp2) mutations in LEOPARD syndrome have dominant negative, not activating, effects. J. Biol. Chem. 2006;281:6785–6792. doi: 10.1074/jbc.M513068200. [DOI] [PubMed] [Google Scholar]
- 46.Wu X., Schmidt J.A., Avarbock M.R., Tobias J.W., Carlson C.A., Kolon T.F., Ginsberg J.P., Brinster R.L. Prepubertal human spermatogonia and mouse gonocytes share conserved gene expression of germline stem cell regulatory molecules. Proc. Natl. Acad. Sci. USA. 2009;106:21672–21677. doi: 10.1073/pnas.0912432106. [DOI] [PMC free article] [PubMed] [Google Scholar]
- 47.He Z., Kokkinaki M., Jiang J., Dobrinski I., Dym M. Isolation, characterization, and culture of human spermatogonia. Biol. Reprod. 2010;82:363–372. doi: 10.1095/biolreprod.109.078550. [DOI] [PMC free article] [PubMed] [Google Scholar]
- 48.He Z., Kokkinaki M., Jiang J., Zeng W., Dobrinski I., Dym M. Isolation of human male germ-line stem cells using enzymatic digestion and magnetic-activated cell sorting. Methods Mol. Biol. 2012;825:45–57. doi: 10.1007/978-1-61779-436-0_4. [DOI] [PMC free article] [PubMed] [Google Scholar]
- 49.Yoon S.R., Qin J., Glaser R.L., Jabs E.W., Wexler N.S., Sokol R., Arnheim N., Calabrese P. The ups and downs of mutation frequencies during aging can account for the Apert syndrome paternal age effect. PLoS Genet. 2009;5:e1000558. doi: 10.1371/journal.pgen.1000558. [DOI] [PMC free article] [PubMed] [Google Scholar]
- 50.Otto S.P., Hastings I.M. Mutation and selection within the individual. Genetica. 1998;102-103:507–524. [PubMed] [Google Scholar]
Associated Data
This section collects any data citations, data availability statements, or supplementary materials included in this article.