
Figure 2.
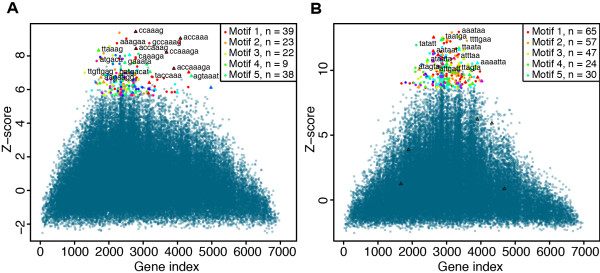
Enrichment of miR-9 and miR-128 seed sites in coding regions. (A) Word cluster plot shows enriched 6, 7 and 8mer words in coding regions after miR-9 transfection. The word cluster plot is described in Figure 2B. (B) Word cluster plot shows enriched 6, 7 and 8mer words in coding regions after miR-128 (7mer-m8 seed CACTGTG) transfection.