Abstract
Vertical scanning interferometry (VSI) provides a method for quantification of surface topography at the angstrom to nanometer level. Time-dependent VSI measurements can be used to study the surface-normal retreat across crystal and other solid surfaces during dissolution or corrosion processes. Therefore, VSI can be used to directly and nondestructively measure mineral dissolution rates with high precision. We have used this method to compare the abiotic dissolution behavior of a representative calcite (CaCO3) cleavage face with that observed upon addition of an environmental microbe, Shewanella oneidensis MR-1, to the crystal surface. From our direct observations, we have concluded that the presence of the microbes results in a significant inhibition of the rate of calcite dissolution. This inhibition appears to be a 2nd-order effect that is related to the formation of etch pits. The opening of etch pits was greatly inhibited in the presence of added bacteria, suggesting that the bacterial cells exert their effect by inhibiting the formation of etch pits at high-energy sites at the crystal surface caused by lattice defects, e.g., screw or point dislocations. The experimental methodology thus provides a nondestructive, directly quantifiable, and easily visualized view of the interactions of microbes and minerals during weathering (or corrosion) processes or during mineral precipitation.
Life continues to imprint its profound signature on the earth's surface, and the literature records a growing number of attempts to understand the nature of its role at scales ranging from global to microscopic (2, 3, 10, 31). At the microscopic level, the interactions between microorganisms and minerals have repercussions with a variety of implications for, e.g., the weathering of rocks, the formation of soils, and the biogeochemical cycling of chemical elements. At a broad level, there is consensus that life does have a role in rock weathering, though this role has been difficult to quantify, largely due to a lack of directly measured mineral dissolution data that include the effects of microorganisms.
However, there exists a large pool of abiotic mineral dissolution data, which has facilitated our understanding of dissolution kinetics exclusive of the quantifiable effects of organisms (11, 14, 24, 30). Historically, these studies have focused on the dissolution of carbonate minerals such as calcite or dolomite (26). Dissolution rates have typically been measured indirectly, by using mineral powders or single crystal weight loss techniques (reference 32 and citations therein). Direct studies have been performed using atomic force microscopy to gain much more detailed insight into step movement on crystal surfaces (8, 12, 13). Recently, crystal dissolution rates have been measured directly by vertical scanning interferometry (VSI) (1, 23, 24). These studies, in combination with a dissolution stepwave model (see below) (14, 15), help to explain the importance of “large-scale” direct observations at the crystal surface. Here, we extend this work, incorporating the critical effect of microorganisms on the dissolution of calcite.
Studies of surface interactions between microbes and carbonate minerals have traditionally focused on carbonate precipitation rather than dissolution (4, 28, 29). From such studies, it is generally agreed that carbonate precipitation is the result of chemical alteration of the aqueous environment (19). On the other hand, interactions between microbes and carbonates during mineral dissolution are less well documented. Organisms that can bore into carbonate rocks (7) are known; they are thought to do so via the excretion of organic acid. In general, organisms that excrete either CO2 or organic acids could impact the dissolution kinetics of carbonates via local changes in pH, acting via the following reaction:
 |
(1) |
Note that this formulation represents the overall dissolution reaction and does not imply any speculation about the actual reaction mechanism.
It was this type of mineral dissolution that we reasoned might be occurring if organisms were to attach to the surface of carbonate minerals—the copious excretion of CO2, leading to carbonate breakdown. We elected to test our hypothesis with the environmental microbe Shewanella oneidensis MR-1, an organism known to attach to many substrates of no metabolic significance, e.g., glass and plastic. MR-1 attachment to carbonate, to our knowledge, had not been studied previously, and such carbonate dissolution via local pH alteration, should it occur, would be in marked contrast to the better-known mineral dissolution abilities of MR-1, which involve redox changes during the reduction of iron or manganese oxides (18, 20, 27).
MATERIALS AND METHODS
S. oneidensis MR-1, isolated from Oneida Lake in New York state, is a member of the shewanellae, a widely distributed group of microbes found in a variety of aquatic environments, both marine and lacustrine. Shewanellae have been described as “interface organisms” because of their propensity to be found at redox interfaces in natural systems. They have remarkable anaerobic versatility, allowing them to utilize many different electron acceptors, including some solids such as iron and manganese oxides. When metabolizing iron and manganese oxides, shewanellae rapidly attach to, and form biofilms on, the mineral surface; these biofilms may enhance the rate of metal reduction (20, 27). In all these cases of mineral dissolution, the activity of the shewanellae involves the reduction of Mn(IV) or Fe(III) to its respective divalent cations and the resulting destabilization of the metal oxide. Several studies on the “nanoscale” interactions that occur between S. oneidensis and the metal oxide interface during metal reduction have been reported (2, 19, 21, 22, 33).
The goal of our studies was distinctly different. Dissolution of carbonate minerals should occur via a nonredox mechanism, with no apparent (energetic) advantage to the organism catalyzing the dissolution. Thus, we set out asking some simple questions about MR-1, with the expectation that local dissolution might occur as a result of localized CO2 and/or organic acid accumulation. (i) Is MR-1 able to attach to the calcite (101̄4) cleavage surface at all? (ii) If so, can MR-1 recognize and respond positively or negatively to the high surface free energy sites at which etch pits typically form? (“Positively” means that MR-1 would be attracted by these surface sites; “negatively” means that MR-1 would avoid the sites.) (iii) Can MR-1 impact the rate of calcite dissolution or precipitation?
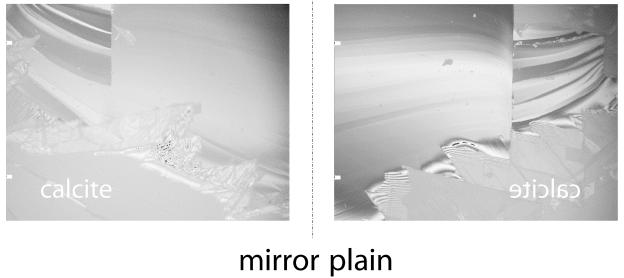
All calcite cleavage fragments [Miller index value, (101̄4)] used in these experiments were split from a single natural, untreated crystal of optical-quality calcite. This calcite is well characterized and has been used in a variety of experimental dissolution studies before (1, 16, 17). Mirror-image pairs of crystal samples were created by cleaving a large single crystal along a (101̄4) cleavage plane. This procedure of sample generation facilitated the exposure of equivalent sites on the surface of each of the two crystal samples (Fig. 1). We assume that the outcrops of line defects, e.g., screw dislocations, within the crystal lattice on one cleavage face will occur in a mirror pattern at the other cleavage face, too. The topographies of all (101̄4) sample surfaces were then characterized with a VSI. VSI is a noninvasive technique used to quantitatively map the topographies of surfaces that reflect light (1, 23-25). By use of a Mirau interferometric objective with a magnification of ×50, the MICROXAM MP8 (ADE-Phase Shift) provides a field of view of 164 by 124 μm per measurement. The system's vertical resolution is better than 2 nm if a white light source is used. Resolution improves to 0.7 Å if a narrow band of green light, i.e., 550 ± 10 nm, is used. Under these conditions, the lateral resolution is about 0.5 μm. A single vertical scan of a 4-μm height difference takes less than 2 s (scan rate, 2.1 μm/s) and gathers as many as 100,000 height data at a time.
FIG. 1.
(101̄4) Mirror cleavage faces of calcite as used in the experiments. For a detailed discussion of the use of mirror cleavage faces, see the text.
Dissolution (corrosion) or growth processes that occur at the mineral-fluid interface can be quantified directly and spatially resolved, because these processes cause surface-normal retreat or advance of the crystal topography. The resulting height changes of the surface are measured by VSI as a function of time (23) according to the equation.
 |
(2) |
where Δh/Δt is the surface-normal retreat (or advance) velocity (v) of dissolution (or growth) at the surface, expressed in meters per second. The rate constant, k, is then computed by dividing by the molar volume (AzV) of the material dissolved or grown, as follows:
 |
(3) |
Rates computed in this way have units of flux (moles per square meter per second).
Organisms were prepared by inoculating 50% Luria-Bertani (LB) broth at 25°C with MR-1 cells from frozen (−80°C) stock. After 24 h, these inoculants were split into separate 15-ml centrifuge tubes of 10% LB broth with the addition of 10 mM sodium lactate. These cultures were incubated for 48 h at 27°C.
pH measurements of the growth medium containing the MR-1 cells were taken before and after application to the calcite crystals with subsequent attachment of the microbes. The initial pH was 6.47. After a 30-min run duration, the pH of the fluid-organism suspension in contact with the calcite surface was substantially unchanged at 6.59.
RESULTS AND DISCUSSION
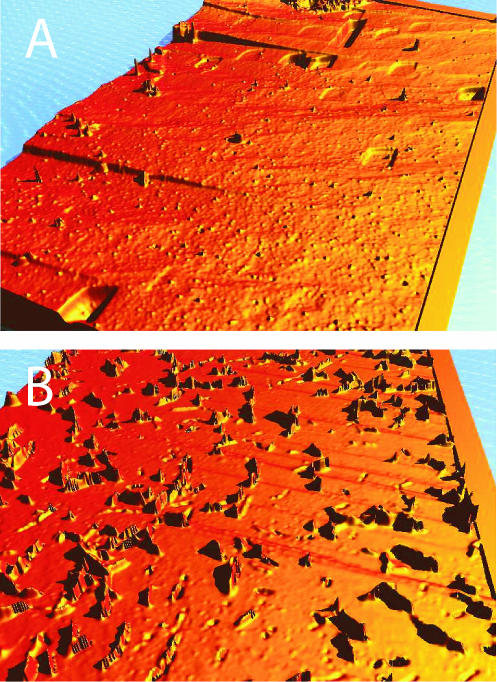
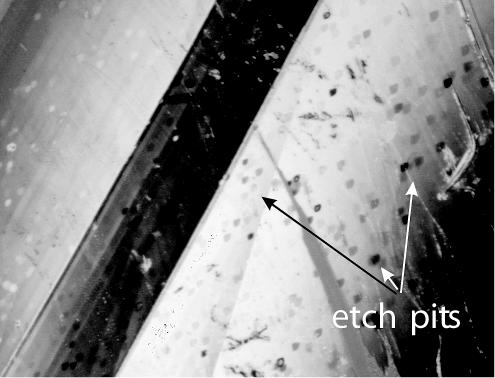
By etching (dissolving) the surface of one calcite sample—recall that we have a pair of cleaved mirror samples—with the sterile microbial growth medium for a few minutes, it was possible to detect if and where etch pits formed on the surface (Fig. 2A). Etch pits are usually assumed to form at high-energy sites, e.g., the outcrops of screw dislocations on the crystal surface (5, 6). Their actual morphology is controlled mainly by the crystallography of the lattice and the composition of the solution. As an result of our experiments, we observed that dissolution experiments with no inoculation (controls) always produced calcite surfaces that exhibited a large number of crystallographically defined etch pits (25), even at almost neutral pH conditions (Fig. 2 and 3). This result is in agreement with those of many other abiotic calcite dissolution studies (1, 16, 17, 25, 26).
FIG. 2.
(A) Three-dimensional height map of crystallographically defined rhombohedral etch pits in (101̄4) cleavage faces of calcite. (B) False-color image (height map) of a calcite surface with MR-1. The image was taken with a 50× Mirau objective, i.e., the field of view is about 162 by 122 μm, and the height difference is about 1 μm.
FIG. 3.
Interferogram showing a large number of etch pits in a calcite cleavage face, representing a relatively high dislocation density. Note the typical shape of the pits as described, e.g., by Arvidson et al. (1) and Lea et al. (16).
The surface of each corresponding cleavage sample was then inoculated with aerobically grown MR-1 cells within the same growth medium. By using (101̄4) calcite cleavage faces, the microbes were exposed to a charge-neutral crystal surface. Thus, we did not introduce charge variables that would affect the sticking efficiency of the microbes (9). VSI measurements showed that MR-1 cells, when added to the solution, would quickly settle on and then attach to the calcite surface. Most surprisingly, the organisms had a dramatic inhibitory effect on the formation of etch pits (Fig. 2B), as seen by comparison to experiments without inoculation (controls).
This unexpected result is consistent with MR-1 having the ability to detect the high-energy sites, attach to them, and inhibit the opening of the nascent etch pits. Recognition of and attachment to these energetically distinct sites must happen rapidly, before the individual etch pit opens from a hollow core (5, 6) or a point defect to a size larger than that of the individual organism. We know from the control experiments that after a run duration of about 10 min, the first generation of etch pits is significantly larger than the MR-1 organisms (diameter, approximately 600 nm; length, about 2 μm). Therefore, the edges of the pits could not be directly controlled by MR-1 after a 10-min run duration.
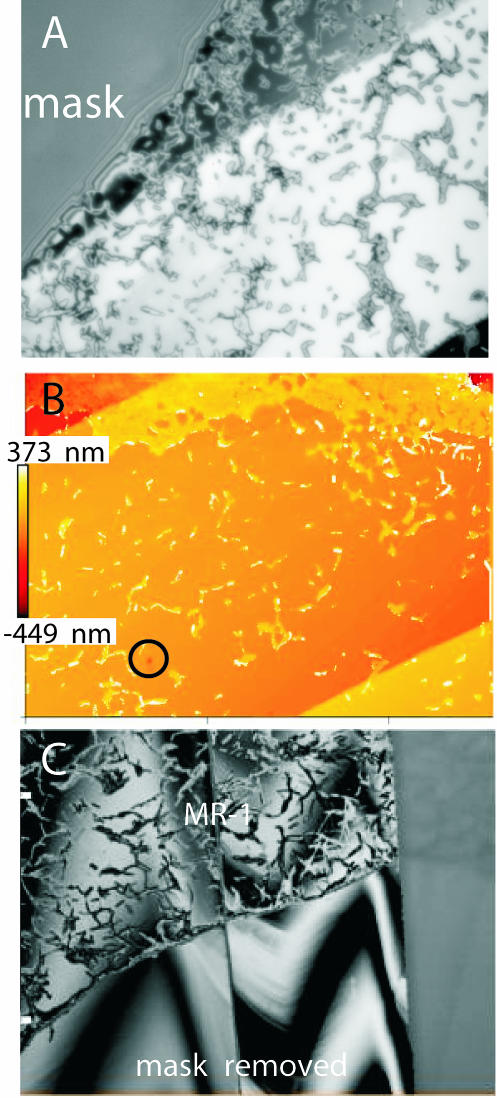
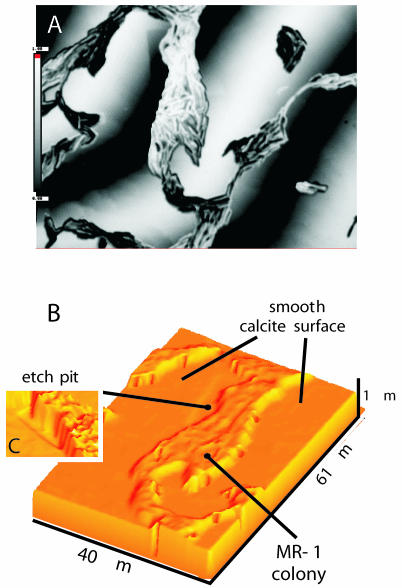
If we follow the model recently introduced by Lasaga and Lüttge (14, 15), the edges of etch pits are the sources of “dissolution stepwaves,” i.e., trains of crystallographically determined steps that move across the crystal surface and cause its retreat. According to this model, the velocity and spacing of the stepwaves together with the formation of etch pits determine the overall abiotic dissolution rate of a particular crystal surface. Based on this model, it can be inferred that MR-1 inhibited not only the formation of etch pits but the entire abiotic dissolution mechanism of a calcite surface almost completely. Our VSI measurements presented here have confirmed this inference. To achieve the measurements of absolute surface-normal retreat (or advance), several micrometer-sized spots on the pristine calcite surface were covered (masked) with silicone rubber (Fig. 4A) (23) to protect parts of the pristine, untreated sample surface from dissolution and/or bacterial attack. These individual masks were taken off at later stages of the experiments. All vertical changes in the surface topography were then quantified by taking interferograms, which were digitized with a charge-coupled device camera and converted into topographic maps (Fig. 5). Each topographic map represents a part of the reacted crystal surface that includes at least one spot of the unreacted, pristine reference surface. By comparing the height of the reacted surface with the height of the reference spot(s), all measurements become absolute. For samples inoculated with MR-1, no measurable surface-normal retreat could be detected. That means that the presence of MR-1 reduced the calcite dissolution rate to values below the detection limit of the VSI method.
FIG. 4.
(A) Reflected-light image showing MR-1 colonies and single individuals with superimposed interference fringes. (B) Two-dimensional false-color height map calculated from the interferogram. Three different terraces can be identified. At the upper part of the image, MR-1 has started successfully to establish a closed biofilm. (C) Interferogram showing a section of the calcite surface. The upper part of the image is covered with MR-1, while the lower part shows the pristine calcite surface after removal of the mask. No significant height difference was measured between the “reacted” and “pristine” parts of the surface, indicating that MR-1 had successfully blocked the global dissolution of this calcite face.
FIG. 5.
(A) Interferogram showing MR-1 colonies in height resolution. (B) Three-dimensional height map calculated from the interferogram. (C) Detail with strongly exaggerated z-scale. The image shows a shallow etch pit that is no longer deepening into the crystal surface because MR-1 has successfully blocked the high-energy site in the bottom of the pit.
In some rare cases, etch pits were observed on the inoculated crystal, though they were much shallower than the etch pits observed in control experiments (Fig. 5). As Fig. 5 shows, MR-1 had successfully stopped the vertical “growth,” i.e., the deepening of the etch pit, by moving into the pit and occupying the etch pit bottom. This observation supports our suspicion that it is the organisms, not the protective covering of organic secretion, that are responsible for the inhibition of etch pit formation. One might predict that if the number of organisms in the beginning of the dissolution process is insufficient, a significant number of etch pits will open. Experimental work that seeks to test this hypothesis is under way. Because crystal edges dissolve significantly faster than flat surfaces, additional work is required to determine if MR-1 can also effectively inhibit the dissolution of these edges.
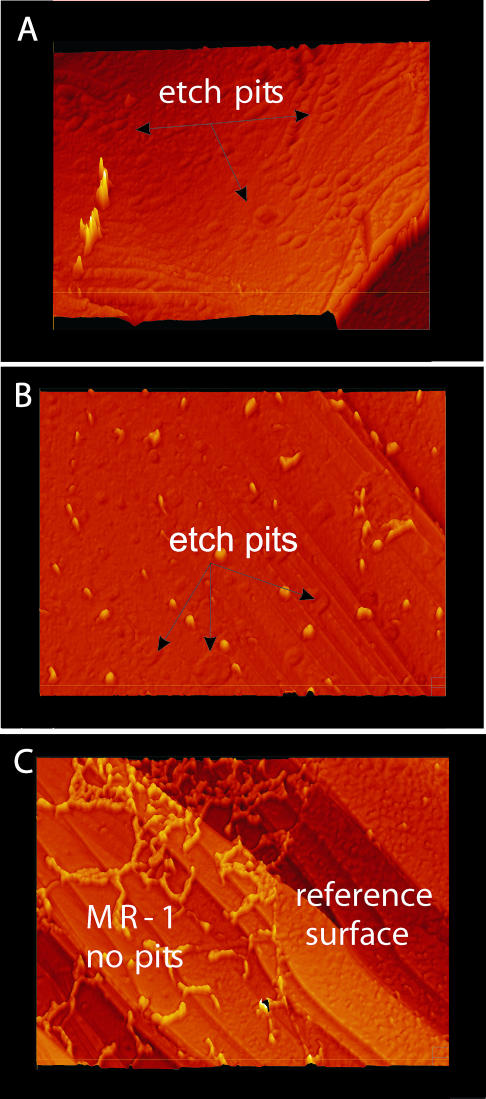
Here, we present results of additional so-called “live-dead” experiments, which we conducted to determine whether MR-1 cells have to be alive in order to prevent the etch pits from opening. MR-1 cells were killed by exposure to 20 μg of chloramphenicol/μl and 0.5 mM carbonyl cyanide m-chlorophenylhydrazone (CCCP; a protonophore) added to the growth medium (0.1% LB medium plus 10 mM sodium lactate) on a shaker platform for 15 min. The VSI maps in Fig. 6 summarize the results of these experiments after a 15-min run duration, showing convincingly that only living cells cause the inhibitory effects we are reporting. Similar results were achieved in experiments with a 3-h run duration. The control experiments without any cells confirmed the previous findings that the abiotic growth medium causes the formation of pits (Fig. 6A). The same solution with dead MR-1 cells added also causes the formation of pits in calcite (Fig. 6B). Only experiments with living MR-1 cells significantly reduced or even entirely prevented the formation of pits (Fig. 6C).
FIG. 6.
Results of live-dead experiments. (A) Etched calcite surface of the control experiment without MR-1 organisms; (B) calcite surface with dead MR-1; (C) calcite surface with live MR-1 organisms. Images were taken with a 50× Mirau objective. The total height difference was 1.60 μm for panel B and 1.65 μm for panel C; field of view, 162.4 by 122 μm.
A further observation from our VSI study is that after a (living) MR-1 cell has found and attached to a certain site on the crystal surface, it then penetrates the surface itself, creating irregularly shaped pits and trenches that it fills with approximately one-third of its own “body,” by volume (Fig. 2B). This observation was quantified by height measurements of MR-1 on the calcite surface as well as by depth measurements of trenches from which the microbes had been removed. One might imagine that this entrenchment confers certain advantages. For example, there may be specific sites on the microbial surface capable of attachment to the calcite surface, and that attachment may trigger the creation of biofilm-forming enzymes or of the exopolymeric substances which bind the biofilm together.
A final point noted was the unusual and complex morphology of the attached MR-1 cells as they grew on the calcite surface. According to our spectrophotometric measurements, the organisms used in the experiment are in late-log phase or early-stationary phase; that is, measurements with the spectrophotometer show maximal density. This being the case, it is interesting that the biofilm propagated rapidly enough on the calcite surface that it was already densely honeycombed after a 90-min run duration. Because the pH does not decrease in the medium supporting the organisms as they form a film on the crystal surface, one might speculate that the organisms are using the carbon and preventing the transport of CO2 into the bulk fluid. As expected, the cells divided in a polar fashion, forming strings of organisms (Fig. 5A and B), but they did not form rounded colonies as they might on an agar surface. Similar morphologies have been seen in early formation of Shewanella biofilms on metal oxides (K. H. Nealson, personal communication). In the case of metal oxides, strings of microbes eventually coalesce to form a continuous biofilm. In our experiment, the chains became entrenched, ultimately forming structurally complex colonies. One might surmise, for purely geometric reasons, that the trenches will ultimately coalesce, creating a very different surface topography underlying a continuous biofilm like that typically formed on metal oxide surfaces.
MR-1 substantially slows the dissolution rate of the calcite crystal. Therefore, we conclude that the MR-1 biofilm is the major factor controlling calcite solubility under experimental conditions. This surprising result provides a quantitative foundation for earlier speculations that microbes could have a substantial role in the stabilization of carbonates in an aqueous environment and that one should expect entirely different dissolution kinetics in an environment devoid of their presence. One might expect biofilms to stabilize other mineral surfaces rather than aid in their corrosion, and the experimental protocol that we have developed positions us to address such questions.
Acknowledgments
This work was supported by grants DOE-FG03-02ER63331 and DE-FG03-02ER63427 from the U.S. Department of Energy (DOE) and by grant EAR-0125667 from the National Science Foundation (NSF).
We thank K. H. Nealson, R. S. Arvidson, K. J. Davis, T. A. Fewless, M. S. Beig, and J. C. Liu for thoughtful discussions and two anonymous reviewers for insightful and helpful comments that significantly improved this paper.
REFERENCES
- 1.Arvidson, R. S., I. E. Ertan, J. E. Amonette, and A. Lüttge. 2003. Variation in calcite dissolution rates: a fundamental problem? Geochim. Cosmochim. Acta 67:1623-1634. [Google Scholar]
- 2.Banfield, J. F., and R. J. Hamers. 1997. Processes at minerals and surfaces with relevance to microorganisms and prebiotic synthesis. Rev. Mineral. 35:81-122. [Google Scholar]
- 3.Berner, R. A., A. C. Lasaga, and R. M. Garrels. 1983. The carbonate-silicate geochemical cycle and its effect on atmospheric carbon dioxide over the past 100 million years. Am. J. Sci. 283:641-683. [DOI] [PubMed] [Google Scholar]
- 4.Boquet, E., A. Boronat, and A. Ramos-Cormenzana. 1973. Production of calcite (calcium-carbonate) crystals by soil bacteria is a general phenomenon. Nature 246:527-553. [Google Scholar]
- 5.Cabrera, N., and M. M. Levine. 1956. On the dislocation theory of evaporation of crystals. Philos. Mag. 1:450-458. [Google Scholar]
- 6.Cabrera, N., M. M. Levine, and J. S. Plaskett. 1954. Hollow dislocations and etch pits. Phys. Rev. 96:1153-1111. [Google Scholar]
- 7.Campbell, S. E., and K. Cole. 1984. Developmental studies on cultured endolithic conchocelis (Rhodophyta). Hydrobiologia 116:201-208. [Google Scholar]
- 8.Davis, K. J., P. M. Dove, and J. J. De Yoreo. 2000. The role of Mg2+ as an impurity in calcite growth. Science 290:1134-1137. [DOI] [PubMed] [Google Scholar]
- 9.Escher, A., and W. G. Characklis. 1990. Modeling the initial events in biofilm accumulation, p. 445-486. In W. G. Characklis and K. C. Marshall (ed.), Biofilms. J. Wiley & Sons, New York, N.Y.
- 10.Garrels, R. M., and A. Lerman. 1984. Coupling of the sedimentary sulfur and carbon cycles: an improved model. Am. J. Sci. 284:989-1007. [Google Scholar]
- 11.Hamilton, J. P., S. L. Brantley, C. G. Pantano, L. J. Criscenti, and J. D. Kubicki. 2001. Dissolution of nepheline, jadeite and albite glasses: toward better models for aluminosilicate dissolution. Geochim. Cosmochim. Acta 65:3683-3702. [Google Scholar]
- 12.Higgins, S. R., D. Bosbach, C. M. Eggleston, and K. G. Knauss. 2000. Kink dynamics and step growth on barium sulfate (001): a hydrothermal scanning probe microscopy study. J. Phys. Chem. B 104:6978-6982. [Google Scholar]
- 13.Jordan, G., and W. Rammensee. 1998. Dissolution rates of calcite (101̄4) obtained by scanning force microscopy: microtopography-based dissolution kinetics on surface with anisotropic step velocities. Geochim. Cosmochim. Acta 62:941-947. [Google Scholar]
- 14.Lasaga, A. C., and A. Lüttge. 2001. Variation of crystal dissolution rate based on a dissolution stepwave model. Science 291:2400-2404. [DOI] [PubMed] [Google Scholar]
- 15.Lasaga, A. C., and A. Lüttge. 2003. A model for crystal dissolution. Eur. J. Mineral. 15:603-615. [Google Scholar]
- 16.Lea, A. S., J. E. Amonette, D. R. Baer, Y. Liang, and N. G. Colton. 2001. Microscopic effects of carbonate, manganese, and strontium ions on calcite dissolution. Geochim. Cosmochim. Acta 65:369-379. [Google Scholar]
- 17.Liang, Y., D. R. Baer, J. M. McCoy, J. E. Amonette, and J. P. LaFemina. 1996. Dissolution kinetics at the calcite-water interface. Geochim. Cosmochim. Acta 60:4883-4887. [Google Scholar]
- 18.Little, B., P. Wagner, K. Heart, R. Ray, D. Lavoie, K. Nealson, and C. Aguilar. 1998. The role of biomineralization in microbially influenced corrosion. Biodegradation 9:1. [DOI] [PubMed] [Google Scholar]
- 19.Little, B. J., P. A. Wagner, and Z. Lewandowski. 1997. Spatial relationships between bacteria and mineral surfaces. Rev. Mineral. 35:123-159. [Google Scholar]
- 20.Little, B. J., P. Wagner, K. Hart, R. Ray, D. Lavoie, K. Nealson, and C. Aguilar. 1997. The role of metal-reducing bacteria in microbiologically influenced corrosion, paper 215. In Proceedings of the CORROSION/97 Research Topical Symposia. NACE International, Houston, Tex.
- 21.Lovley, D. R., and E. J. Phillips. 1988. Novel mode of microbial energy metabolism: organic carbon oxidation coupled to dissimilatory reduction of iron or manganese. Appl. Environ. Microbiol. 54:1472-1480. [DOI] [PMC free article] [PubMed] [Google Scholar]
- 22.Lower, S. K., M. F. Hochella, Jr., and T. J. Beveridge. 2001. Bacterial recognition of mineral surfaces: nanoscale interactions between Shewanella and alpha-FeOOH. Science 292:1360-1363. [DOI] [PubMed] [Google Scholar]
- 23.Lüttge, A., E. W. Bolton, and A. C. Lasaga. 1999. An interferometric study of the dissolution kinetics of anorthite: the role of reactive surface area. Am. J. Sci. 299:652-678. [Google Scholar]
- 24.Lüttge, A., U. Winkler, and A. C. Lasaga. 2003. Interferometric study of the dolomite dissolution: a new conceptual model for mineral dissolution. Geochim. Cosmochim. Acta 67:1099-1116. [Google Scholar]
- 25.MacInnis, I. N., and S. L. Brantley. 1992. The role of dislocations and surface morphology in calcite dissolution. Geochim. Cosmochim. Acta 105:1113-1126. [Google Scholar]
- 26.Morse, J. W., and R. S. Arvidson. 2002. The dissolution kinetics of major sedimentary carbonate minerals. Earth Sci. Rev. 58:51-84. [Google Scholar]
- 27.Myers, C., and K. H. Nealson. 1988. Bacterial manganese reduction and growth with manganese oxide as the sole electron acceptor. Science 240:1319-1321. [DOI] [PubMed] [Google Scholar]
- 28.Novitsky, J. A. 1981. Calcium-carbonate precipitation by marine-bacteria. Geomicrobiology 2:375-388. [Google Scholar]
- 29.Pentecost, A., and J. Bauld. 1988. Nucleation of calcite on the sheaths of cyanobacteria using a simple diffusion cell. Geomicrobiology 6:129-135. [Google Scholar]
- 30.Rosso, J. J., and J. D. Rimstidt. 2000. A high resolution study of forsterite dissolution rates. Geochim. Cosmochim. Acta 64:797-811. [Google Scholar]
- 31.Westbroek, P. 1991. Life as a geological force. W. W. Norton & Co., New York, N.Y.
- 32.White, A. F., and S. L. Brantley (ed.). 1995. Reviews in mineralogy, vol. 31. Chemical weathering rates of silicate minerals. Mineralogical Society of America, Washington, D.C.
- 33.Zachara, J. M., J. K. Fredrickson, S. M. Lee, D. W. Kennedy, S. C. Smith, and P. L. Gassman. 1998. Bacterial reduction of crystalline Fe3+ oxides in single phase suspensions and subsurface material. Am. Mineral. 83:1426-1443. [Google Scholar]


