

Abstract
A previously described mathematical model of Zn absorption as a function of total daily dietary Zn and phytate was fitted to data from studies in which dietary Ca, Fe and protein were also measured. An analysis of regression residuals indicated statistically significant positive relationships between the residuals and Ca, Fe and protein, suggesting that the presence of any of these dietary components enhances Zn absorption. Based on the hypotheses that (1) Ca and Fe both promote Zn absorption by binding with phytate and thereby making it unavailable for binding Zn and (2) protein enhances the availability of Zn for transporter binding, the model was modified to incorporate these effects. The new model of Zn absorption as a function of dietary Zn, phytate, Ca, Fe and protein was then fitted to the data. The proportion of variation in absorbed Zn explained by the new model was 0·88, an increase from 0·82 with the original model. A reduced version of the model without Fe produced an equally good fit to the data and an improved value for the model selection criterion, demonstrating that when dietary Ca and protein are controlled for, there is no evidence that dietary Fe influences Zn absorption. Regression residuals and testing with additional data supported the validity of the new model. It was concluded that dietary Ca and protein modestly enhanced Zn absorption and Fe had no statistically discernable effect. Furthermore, the model provides a meaningful foundation for efforts to model nutrient interactions in mineral absorption.
Keywords: Mathematical models, Zinc absorption, Calcium, Iron, Protein
We have previously described the development of a mathematical model of daily Zn absorption as a function of total daily dietary Zn and phytate based on the understanding that Zn absorption is a transporter-mediated process and that phytate inhibits Zn absorption by binding with Zn in the gut to form an unabsorbable complex(1). In subsequent publications, we have reported on the application of the model and provided updated parameter estimates and model evaluation based on additional data available since the original publication(2–4). The current parameter estimates were derived from fitting the model to seventy-two mean data from isotope studies of total daily Zn absorption in healthy adults of both sexes. The fit of the model to these data produced an R2 value of 0·81, indicating that 81 % of the variance in absorbed Zn is explained by dietary Zn and phytate. Other dietary factors are known to influence Zn absorption as well(5) and three of these dietary factors (Ca, Fe and protein) were measured for a majority of the data in the model database. This additional information afforded the opportunity to use the model to investigate whether and in what manner these dietary components affected Zn absorption in these studies. The information would also provide the basis for modification and testing of a new model incorporating any observed effects. Such a model, if validated, could then be used to predict how combinations of all these dietary factors influence Zn absorption and potentially contribute to our understanding of the underlying mechanisms that have an impact on Zn absorption, including the role of nutrient interactions.
Methods
Of the seventy-two data modelled by the current model, forty-three included measurements of dietary Ca, Fe and protein(6–11). These data were used for the model development and selection described here. Most of the data came from a single publication(11). The dietary protein data in this publication(11) were reported as a percentage of dietary energy, but the authors provided the data in units of g/d. The details on the values of all dietary variables and Zn absorption are provided in Table 1. With the exception of one study where several milligrams of ferrous sulphate were added to study diets to balance the Fe content(10), none of the dietary quantities being modelled was from supplements or obvious fortification. The data for each of the variables had approximately normal distributions except for phytate which had a skewed distribution with a heavy upper tail. All study diets were composed of foods normally consumed in the country where the study took place except for one study diet which consisted solely of maize tortillas(8). Most data came from studies conducted in the USA, though there were also data from Denmark(7,9) and Korea(10).
Table 1.
Values of the dietary predictor variables and absorbed zinc for the forty-three data used in the full model* (Mean values, standard deviations and ranges)
| Variables | Mean | SD | Range |
|---|---|---|---|
| Dietary Zn (mg/d) | 10.6 | 4.6 | 4.3–21.0 |
| Dietary phytate (mg/d) | 1130 | 1150 | 246–3730 |
| Median | 690 | ||
| Dietary Ca (mg/d) | 866 | 183 | 430–1250 |
| Dietary protein (g/d) | 81.3 | 19.7 | 35.0–113 |
| Dietary Fe (mg/d) | 15.6 | 5.8 | 5.5–25.4 |
| Absorbed Zn (mg/d) | 3.04 | 0.95 | 1.44–5.10 |
| Fractional absorption | 0.32 | 0.12 | 0.14–0.69 |
The median value is also shown for the phytate data since they had a skewed distribution. Other variables had median values similar to the means.
Data for the three potential new dietary predictors of Zn absorption were compared with residuals from the existing model to examine relationships with the variation in absorption not accounted for by dietary Zn and phytate. Based on the observed relationships, a series of mathematical models were then created to incorporate hypothetical effects of these dietary factors into the existing model. Functional model selection consisted of fitting all the alternative models to the data and choosing an optimal model based on goodness of fit, simplicity, and plausibility of parameter estimates and prediction behaviour. The chosen functional model was then used in a variable selection process where the contributions of the predictor variables were evaluated. This was accomplished by fitting reduced versions of the model having all possible combinations of the three new predictor variables and testing the associated parameters to find the best model, defined as the model having the minimum Akaike's information criterion (AIC) value and statistically significant parameters. Parameter significance was evaluated using partial F tests on the extra sums of squares from ANOVA comparisons of models with and without a given parameter. Because the model selected as the best included dietary Ca and protein but not Fe as predictors, additional data from the original model database were available for further validation of the model. Predictive validity was assessed using the mean-squared prediction error (MSPR) and comparison of parameter estimates with and without the additional data. Approximate 95% CI for the parameter estimates were calculated using the profile likelihood method.
Throughout the modelling process, regression residuals were examined to investigate relationships between variables, evaluate model validity and to detect outliers and departures from regression assumptions. The coefficient of multiple determination R2, interpreted as the proportion of variability in absorbed Zn explained by the modelled predictor variables, was used to assess goodness of fit and to characterise the relative influence of predictors on Zn absorption. The reported R2 values were confirmed to be accurate and meaningful by replicating the fit with a model modified to address potential problems with R2 use in non-linear regression.
Models were fitted to data by means of non-linear regression analysis using DataFit version 9.0 (Oakdale Engineering) and R, a language and environment for statistical computing, version 2.13 (The R Foundation for Statistical Computing, www.R-project.org). Other statistical analyses were performed with GraphPad Prism version 5.04 (GraphPad Software). The level of significance used was 0·05.
Results
When the existing dietary Zn and phytate model was fitted to the subset of data including Ca, Fe and protein, significant relationships were observed between the residuals and each of the variables with P values of 0·014, 0·0057 and 0·029, respectively. This suggested that some of the unexplained variation in absorbed Zn could be attributed to each of these variables. Furthermore, all of these relationships were positive, indicating that each dietary component enhanced Zn absorption.
In response to these findings, the model was modified to incorporate hypothetical actions of the three dietary factors on the absorption process. It was hypothesised that both Ca and Fe promoted Zn absorption by binding with phytate, thereby eliminating its availability for binding Zn. Protein and its digestion products were hypothesised to also affect phytate availability for Zn binding or to enhance Zn availability for transporter binding by a non-specific mechanism, perhaps by increasing Zn solubility in the gut. A variety of mathematical formulations were created to incorporate these hypothetical actions into the model. Each model was fitted to the data and the results evaluated. The functional model having the optimum combination of relative simplicity, goodness of fit to the data, quality of parameter estimates and plausible prediction behaviour can be expressed as:
| (1) |
The variables TDZ, TDP, TDC, TDF and TDPr represent total daily dietary Zn, phytate, Ca, Fe and protein, respectively. TAZ is the total daily absorbed Zn. All variables are in units of mmol/d except protein which is in g/d. The parameters AMAX, KT, KP, BCa, BFe and BPr are defined as maximum Zn absorption, Zn-transporter equilibrium dissociation constant, Zn-phytate equilibrium dissociation constant, Ca parameter, Fe parameter and protein parameter, respectively.
Fitting the model to the data produced an R2 of 0·88 and an AIC of 40·0. This compared with an R2 of 0·82 and an AIC of 50·0 when the original model was fitted to the Zn and phytate measurements for these forty-three data. Fitting of the reduced models indicated that the model with the addition of just dietary Ca and protein as predictor variables was the best model. The results of this variable selection process are summarised in Table 2 as a stepwise process where the parameters associated with each variable are removed one at a time to test for significance and calculate the AIC for the reduced model. Table 2 shows that a minimum AIC value of 38·1 was attained when Fe, having the least significant parameter, was removed from the full model. The R2 for the fit of this model was 0·88, unchanged from that of the full model. The next step then involved removing additional parameters from the model without Fe, with the result that the two remaining parameters were found to be significant by partial F test and the AIC value was not improved by removing either of them. The Zn and phytate parameters do not appear in Table 2 for two reasons: they are the essential core of the model and are not being evaluated in this variable selection process and, furthermore, the structure of the model precludes testing them individually with the F test.
Table 2.
Results of model selection shown as a stepwise process*
| Omitted parameters | P | AIC |
|---|---|---|
| Full model | ||
| B Ca | 0.098 | 41.2 |
| B Pr | 0.080 | 41.6 |
| B Fe | 0.80 | 38.1 |
| Model without Fe | ||
| B Ca | 0.0092 | 43.8 |
| B Pr | 0.020 | 42.2 |
AIC, Akaike's information criterion; BCa, Ca parameter; BPr, protein parameter; BFe, Fe parameter.
The AIC values reflect omission of the parameters from the model. The minimum AIC value was attained with the omission of dietary Fe from the full model. The full model had an AIC of 40.0. The P values from partial F tests of the extra sums of squares are consistent with the AIC, showing that the Fe parameter was clearly not significant and that the remaining parameters were significant after the removal of Fe.
The revised equation for the selected model with Ca and protein predictors is:
| (2) |
The parameter estimates and approximate 95% CI from fitting this model to the data are listed in Table 3. Examinations of the residuals from the fitted models revealed no serious concerns with deviations from the models or error variance and distribution. There were no outliers among the data.
Table 3.
Parameter estimates with approximate 95% CI from fitting the selected model to the initial dataset and the dataset augmented with the validation data*
| Initial data
(n 43) |
Augmented data
(n 54) |
|||
|---|---|---|---|---|
| Parameters | Estimate | 95% CI | Estimate | 95% CI |
| A MAX | 0.083 | 0.075, 0.093 | 0.084 | 0.076, 0.095 |
| K T | 0.059 | 0.015, 0.46 | 0.069 | 0.022, 0.38 |
| K P | 0.31 | 0.088, 0.80 | 0.44 | 0.19, 0.90 |
| B Ca | 0.021 | 0.0089, 0.026 | 0.017 | 0.0091, 0.022 |
| B Pr | 0.013 | 0.0018, 0.14 | 0.012 | 0.0017, 0.092 |
AMax, maximum Zn absorption; KT, Zn-transporter equilibrium dissociation constant; KP, Zn-phytate equilibrium dissociation constant; BCa, Ca parameter; BPr, protein parameter.
The CI were calculated using the profile likelihood method.
With the removal of dietary Fe from the selected model, an opportunity to validate the predictive capability of the model with additional data became available. The existing model database contained twelve data with Ca and protein measurements that were not used initially since they did not also measure Fe(12–17). Of these data (from Lowe et al.(14) and Hunt & Beiseigel(17)), three were not used for validation because their Ca values were much higher (>1500 mg/d) than those used to develop the model. The TAZ values for the nine remaining data were predicted using the model and parameter estimates just described and the MSPR was calculated from the comparison of the measured and predicted TAZ values. The MSPR of 0·188 was close enough to the model's mean-squared error of 0·121 to support the model's predictive validity. Of the twelve additional data (one(14) appeared to be an influential outlier when included in the analysis and was removed), eleven were then combined with the forty-three data already being used and the model was fitted to the augmented dataset for the purpose of improving the parameter estimates. The inclusion of the data with higher dietary Ca values also effectively extended the useful range of the model in that variable. The new parameter estimates and 95% CI are shown in Table 3.
Using the parameter estimates from fitting the augmented dataset, the model was used to predict the effects of dietary Ca and protein on Zn absorption for several fixed levels of phytate, Ca and protein (Figs. 1 and 2). The values of 600 and 2400 mg/d of phytate, 600 and 1200 mg/d of Ca and 40 and 100 g/d of protein were chosen to represent low and high dietary intakes, respectively. For the selected nutrient values, including protein set equal to 60 g/d, and the range of dietary Zn plotted, an increase in Ca from 600 to 1200 mg/d was predicted to increase Zn absorption by a maximum of almost 0·5 mg/d. Similarly, with Ca set at 1000 mg/d, an increase from 40 to 100 g/d of protein was predicted to increase Zn absorption by as much as 0·6 mg/d.
Fig. 1.
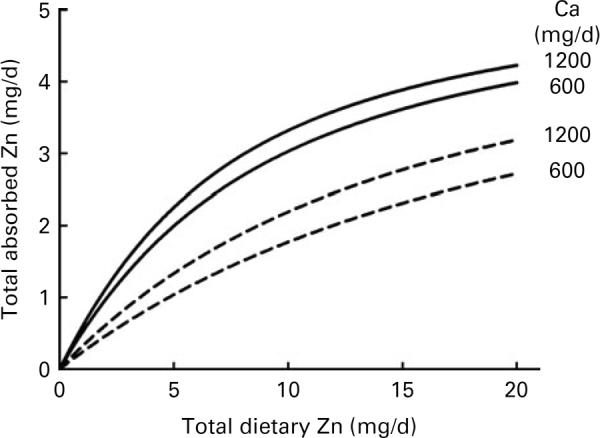
Model-predicted effect of dietary calcium on zinc absorption relative to dietary zinc intake for calcium intakes of 600 and 1200 mg/d at dietary phytate levels of 600 (—) and 2400 (---) mg/d. Dietary protein was fixed at 60 g/d.
Fig. 2.
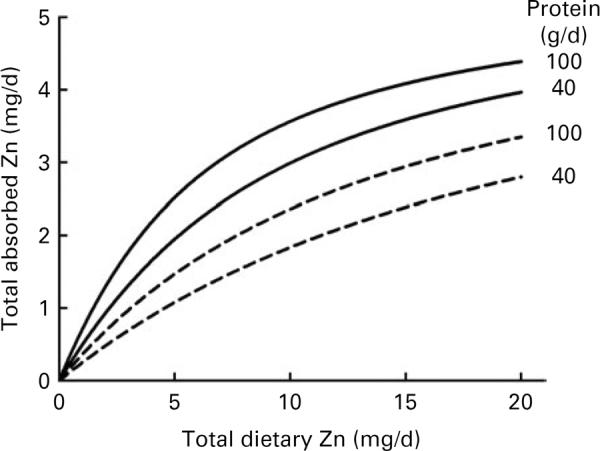
Model-predicted effect of dietary protein on zinc absorption relative to dietary zinc intake for protein intakes of 40 and 100 g/d at dietary phytate levels of 600 (—) and 2400 (---) mg/d. Dietary calcium was fixed at 1000 mg/d.
Discussion
Additional dietary factors affecting zinc absorption
The present results indicate that dietary Ca and protein modestly enhanced Zn absorption. Moreover, considering the R2 values observed for the models, it appeared that Ca and protein in the study diets together had an impact on Zn absorption that was on average an order of magnitude less than that of dietary Zn and phytate. Nonetheless, the model predicted that a sizeable change in either Ca or protein, with the other dietary factors unchanged, can have a non-trivial effect on Zn absorption (Figs. 1 and 2).
Studies of the effect of Ca from natural dietary and supplemental sources on Zn absorption have produced a mixed picture. Some studies of supplemental Ca have demonstrated no effect on Zn retention or balance(18–20), while others have shown a negative impact on Zn balance(21). Furthermore, Ca and phytate have been shown to interact to inhibit Zn bioavailability in animal studies(22,23). There has also been evidence of this effect in human subjects(24). On the other hand, Sandström et al.(25) observed enhanced Zn absorption when dietary Ca was increased by the addition of dairy products to a high-phytate bread meal; no change in absorption occurred with a low-phytate white bread meal. Additionally, Lönnerdal et al.(26) found Zn absorption from a soya formula to increase when Ca was added to the formula. These results prompted them to hypothesise that the increased Ca in the gut was complexing with phytate, thus making it unavailable to bind Zn. This is the mechanism that we have proposed and implemented in our model. More recently, Hunt & Beiseigel(17) reported data suggesting that Ca enhanced Zn absorption, but the effect was not significant when they controlled for dietary Zn and phytate. Contrary to our model, their data showed the enhancing effect of Ca to be more pronounced at low phytate levels, though this Ca × phytate interaction was also statistically insignificant. Perhaps, because the finding was insignificant, the authors did not hypothesise a mechanism to explain it. Nor do we have a mechanism to propose at this time. As described above, the low-Ca data from the study of Hunt & Beiseigel(17) were included in the validation data and all of the data included were in the augmented dataset to which the model was ultimately fit. The inclusion of these data contributed to changes in the parameter estimates (Table 3), but the statistical results were essentially unaffected.
While differences in experimental methods may have played a role, the contradictory findings of the Ca studies may also reflect the existence of complicating nutrient interactions extending beyond that with phytate. This possibility argues for the development of more comprehensive models of Zn absorption which will require more data than presently available. It is of interest to note that the effect of Ca on Zn absorption was not apparent in the raw dietary data used here; there was no correlation between dietary Ca and absorbed Zn (r 0·15, P=0·29). The relationship became evident in the regression residuals once dietary Zn and phytate were controlled for by the original model.
Studies of dietary protein and Zn absorption have also produced conflicting results. Dietary protein and protein digestion products such as casein phosphopeptides have been observed to enhance Zn absorption(25,27), inhibit absorption(28) and to have no effect(27,28). And, again, proposed explanations have pointed to nutrient interactions with evidence of phytate, in particular, having a role. To explore protein–phytate interaction, an alternative form of the model with protein acting on phytate availability for Zn binding was tried. The fit and parameter estimates were inferior, though, and that model was rejected. This supports the other hypothesis that protein improves Zn absorption by means of a mechanism that promotes Zn availability for transporter binding. With protein, there is also the factor of source, animal or plant, having an effect(5). Though the models combine protein from all sources together, many of the protein data modelled here were quantified by source. Therefore, it was possible to look for evidence of an effect of protein source on Zn absorption by looking for trends in the residuals related to protein source. None was found, though, so modelling by protein type was not pursued at this time. It is also noteworthy that efforts to study the influence of protein quantity and source have been confounded by the effect of varying quantities of Zn in the study diets(24,29), a problem that can be remedied with the use of a model like that described here to control for dietary Zn.
Studies of the impact of Fe on Zn absorption have generally shown that Fe fortification of test meals does not affect Zn absorption(30–33), but that non-haem Fe administered with Zn in aqueous solution or supplement tablets in the fasting state does inhibit the absorption of Zn, with the magnitude of the effect related to the Fe:Zn molar ratio(30,31,34,35). Fe–Zn molar ratios in the studies varied from 0 to 30 for test doses in aqueous solution and up to 25 in test meals. The results from many of these studies have been summarised by Whittaker(36). The sources of the data being modelled here reported that there were no supplements given during the studies and that with the one exception noted earlier, there was no intentional Fe fortification of the study diets. Though none was reported, it is possible that there were commercially fortified foods in the diets, but, if so, this is considered to be inconsequential. The Fe:Zn molar ratios varied from 0·8 to 4·0. These data are essentially different from those cited above in that Fe content was from natural dietary sources and not manipulated to any extent. More importantly, Fe was ingested in meals and, as such, the absence of an effect is consistent with previous findings that Fe in meals, even at high Fe:Zn ratios, does not significantly influence Zn absorption.
The initial evidence of a strong positive association between dietary Fe and Zn absorption observed in the raw dietary data and residuals analysis was novel. While this relationship disappeared when Ca and protein were controlled for in the model, the full model, nonetheless, did predict a small enhancing effect (≤0·1 mg/d) of Fe on Zn absorption. This effect was insignificant, of course, but it does hint at the existence of a hitherto unobserved Zn–Fe interaction. Given that Fe does bind with phytate, the notion of Fe enhancing Zn absorption as hypothesised in the model is not inconceivable.
Model development, selection and application
As described, the models investigated here were derived from an existing model of Zn absorption as a function of dietary Zn and phytate. The manner in which the additional dietary factors of Ca, Fe and protein were incorporated into the model varied, but simpler mechanisms that met other criteria were preferred in the model selection process. It was discovered that simple models that fit the data best could, however, have conceptual flaws in their mathematical formulations that produced questionable or clearly erroneous predictions. Thus, in selecting the model expressed in equation 1, a small sacrifice in goodness of fit and certainty of parameter estimates was made for the sake of conceptual integrity and prediction reliability.
The hypothesis that Fe and Ca have an impact on Zn absorption by binding with phytate are supported by plentiful evidence that Fe(37–39) and Ca(37,40,41) absorption are also inhibited by this very binding reaction. Furthermore, support for the manner in which this proposed mechanism was implemented in the functional model (equation 2) is provided by the fact that the parameter BCa may be conceived of as similar to Ca–phytate binding affinity. Its magnitude (a value of 0·02 in Table 3) relative to the reciprocal of KP (a value of 2), Zn–phytate binding affinity, is consistent with reports(42,43) that the Zn–phytate bond is stronger than the Ca–phytate bond at slightly alkaline pH. In contemplating approaches for modelling dietary mineral interactions, it is conceivable that the phytate binding reaction could serve as the foundation of a single model of Zn, Ca and Fe absorption and interactions.
While the parameter estimates may eventually prove to be useful in understanding nutrient interactions in the Zn absorption process, the primary value of the model is in demonstrating the effects of Ca, Fe and protein on Zn absorption and as a tool for predicting Zn absorption from diets with any combination of these nutrients. As pointed out above, the improvement in prediction accuracy over that provided by the existing Zn–phytate model is modest, though. If the model is to be applied to predict Zn absorption from specified levels of dietary Zn, phytate, Ca and protein, it is recommended that the parameter estimates shown for the augmented dataset in Table 3 be used. If absorption is being predicted from just dietary Zn and phytate, the parameter estimates from a previous publication(4) should be used.
The reality is certainly more complex than represented by the model, but it appears to fit the data without evidence of inadequacy. It should also be kept in mind that success in fitting the data does not prove the hypotheses. If and when sufficient data become available, it is likely that deficiencies with the models will become evident and that more complex modelling approaches will be required. It is also possible that additional data could change conclusions about the significance of the dietary variables. Nonetheless, the model developed here makes the best use of the limited available data and its validity has been demonstrated to the extent possible with the current data.
Acknowledgements
This study was supported by HarvestPlus (8057 and 8207) and the National Institutes of Health (K24 DK083772). L. V. M. developed the models and performed the analyses. N. F. K. and K. M. H. oversaw the work. All authors participated in the writing of the manuscript and approved the final manuscript.
Abbreviations
- AIC
Akaike's information criterion
- MSPR
mean-squared prediction error
Footnotes
The authors declare that there are no conflicts of interest.
References
- 1.Miller LV, Krebs NF, Hambidge KM. A mathematical model of zinc absorption in humans as a function of dietary zinc and phytate. J Nutr. 2007;137:135–141. doi: 10.1093/jn/137.1.135. [DOI] [PMC free article] [PubMed] [Google Scholar]
- 2.Hambidge KM, Miller LV, Westcott JE, et al. Dietary reference intakes for zinc may require adjustment for phytate intake based upon model predictions. J Nutr. 2008;138:2363–2366. doi: 10.3945/jn.108.093823. [DOI] [PMC free article] [PubMed] [Google Scholar]
- 3.Rosado JL, Hambidge KM, Miller LV, et al. The quantity of zinc absorbed from wheat is enhanced by biofortification. J Nutr. 2009;139:1920–1925. doi: 10.3945/jn.109.107755. [DOI] [PMC free article] [PubMed] [Google Scholar]
- 4.Hambidge KM, Miller LV, Westcott JE, et al. Zinc bioavailability and homeostasis. Am J Clin Nutr. 2010;91:1478S–1483S. doi: 10.3945/ajcn.2010.28674I. [DOI] [PMC free article] [PubMed] [Google Scholar]
- 5.Lönnerdal B. Dietary factors influencing zinc absorption. J Nutr. 2000;130:1378S–1383S. doi: 10.1093/jn/130.5.1378S. [DOI] [PubMed] [Google Scholar]
- 6.Hunt JR, Gallagher SK, Johnson LK, et al. High- versus low-meat diets: effects on zinc absorption, iron status, and calcium, copper, iron, magnesium, manganese, nitrogen, phosphorus, and zinc balance in postmenopausal women. Am J Clin Nutr. 1995;62:621–632. doi: 10.1093/ajcn/62.3.621. [DOI] [PubMed] [Google Scholar]
- 7.Knudsen E, Sandström B, Solgaard P. Zinc, copper and magnesium absorption from a fibre-rich diet. J Trace Elem Med Biol. 1996;10:68–76. doi: 10.1016/S0946-672X(96)80014-9. [DOI] [PubMed] [Google Scholar]
- 8.Hambidge KM, Huffer JW, Raboy V, et al. Zinc absorption from low-phytate hybrids of maize and their wild-type isohybrids. Am J Clin Nutr. 2004;79:1053–1059. doi: 10.1093/ajcn/79.6.1053. [DOI] [PubMed] [Google Scholar]
- 9.Bach Kristensen M, Hels O, Morberg CM, et al. Total zinc absorption in young women, but not fractional zinc absorption, differs between vegetarian and meat-based diets with equal phytic acid content. Br J Nutr. 2006;95:963–967. doi: 10.1079/bjn20051486. [DOI] [PubMed] [Google Scholar]
- 10.Kim J, Paik HY, Joung H, et al. Effect of dietary phytate on zinc homeostasis in young and elderly Korean women. J Am Coll Nutr. 2007;26:1–9. doi: 10.1080/07315724.2007.10719579. [DOI] [PubMed] [Google Scholar]
- 11.Hunt JR, Beiseigel JM, Johnson LK. Adaptation in human zinc absorption as influenced by dietary zinc and bioavailability. Am J Clin Nutr. 2008;87:1336–1345. doi: 10.1093/ajcn/87.5.1336. [DOI] [PubMed] [Google Scholar]
- 12.Wada L, Turnlund JR, King JC. Zinc utilization in young men fed adequate and low zinc intakes. J Nutr. 1985;115:1345–1354. doi: 10.1093/jn/115.10.1345. [DOI] [PubMed] [Google Scholar]
- 13.Hunt JR, Mullen LK, Lykken GI. Zinc retention from an experimental diet based on the US FDA Total Diet Study. Nutr Res. 1992;12:1335–1344. [Google Scholar]
- 14.Lowe NM, Shames DM, Woodhouse LR, et al. A compartmental model of zinc metabolism in healthy women using oral and intravenous stable isotope tracers. Am J Clin Nutr. 1997;65:1810–1819. doi: 10.1093/ajcn/65.6.1810. [DOI] [PubMed] [Google Scholar]
- 15.Hunt JR, Matthys LA, Johnson LK. Zinc absorption, mineral balance, and blood lipids in women consuming controlled lactoovovegetarian and omnivorous diets for 8 wk. Am J Clin Nutr. 1998;67:421–430. doi: 10.1093/ajcn/67.3.421. [DOI] [PubMed] [Google Scholar]
- 16.Pinna K. Doctoral Dissertation. University of California; 1999. Effect of a low zinc intake on zinc homeostasis and immune function in adult men. [Google Scholar]
- 17.Hunt JR, Beiseigel JM. Dietary calcium does not exacerbate phytate inhibition of zinc absorption by women from conventional diets. Am J Clin Nutr. 2009;89:839–843. doi: 10.3945/ajcn.2008.27175. [DOI] [PubMed] [Google Scholar]
- 18.Dawson-Hughes B, Seligson F, Hughes VA. Effects of calcium carbonate and hydroxyapatite on zinc and iron retention in postmenopausal women. Am J Clin Nutr. 1986;44:83–88. doi: 10.1093/ajcn/44.1.83. [DOI] [PubMed] [Google Scholar]
- 19.McKenna A, Ilich J, Andon M, et al. Zinc balance in adolescent females consuming a low- or high-calcium diet. Am J Clin Nutr. 1997;65:1460–1464. doi: 10.1093/ajcn/65.5.1460. [DOI] [PubMed] [Google Scholar]
- 20.Spencer H, Kramer L, Norris C, et al. Effect of calcium and phosphorus on zinc metabolism in man. Am J Clin Nutr. 1984;40:1213–1218. doi: 10.1093/ajcn/40.6.1213. [DOI] [PubMed] [Google Scholar]
- 21.Wood R, Zheng J. High dietary calcium intakes reduce zinc absorption and balance in humans. Am J Clin Nutr. 1997;65:1803–1809. doi: 10.1093/ajcn/65.6.1803. [DOI] [PubMed] [Google Scholar]
- 22.Forbes RM, Parker HM, Erdman JW. Effects of dietary phytate, calcium and magnesium levels on zinc bioavailability to rats. J Nutr. 1984;114:1421–1425. doi: 10.1093/jn/114.8.1421. [DOI] [PubMed] [Google Scholar]
- 23.Fordyce EJ, Forbes RM, Robbins KR, et al. Phytate*calcium/zinc molar ratios: are they predictive of zinc bioavailability? J Food Sci. 1987;52:440–444. [Google Scholar]
- 24.Sandström B, Cederblad Å. Zinc absorption from composite meals. II. Influence of the main protein source. Am J Clin Nutr. 1980;33:1778–1783. doi: 10.1093/ajcn/33.8.1778. [DOI] [PubMed] [Google Scholar]
- 25.Sandström B, Arvidsson B, Cederblad Å, et al. Zinc absorption from composite meals. I. The significance of wheat extraction rate, zinc, calcium and protein content in meals based on bread. Am J Clin Nutr. 1980;33:739–745. doi: 10.1093/ajcn/33.4.739. [DOI] [PubMed] [Google Scholar]
- 26.Lönnerdal B, Cederblad Å, Davidsson L, et al. The effect of individual components of soy formula and cow's milk formula on zinc bioavailability. Am J Clin Nutr. 1984;40:1064–1070. doi: 10.1093/ajcn/40.5.1064. [DOI] [PubMed] [Google Scholar]
- 27.Hansen M, Sandström B, Jensen M, et al. Casein phosphopeptides improve zinc and calcium absorption from rice-based but not from whole-grain infant cereal. J Pediatr Gastroenterol Nutr. 1997;24:56–62. doi: 10.1097/00005176-199701000-00014. [DOI] [PubMed] [Google Scholar]
- 28.Davidsson L, Almgren A, Sandström B, et al. Zinc absorption in adult humans: the effect of protein sources added to liquid test meals. Br J Nutr. 1996;75:607–613. doi: 10.1079/bjn19960163. [DOI] [PubMed] [Google Scholar]
- 29.Sandström B, Almgren A, Kivistö B, et al. Effect of protein level and protein source on zinc absorption in humans. J Nutr. 1989;119:48–53. doi: 10.1093/jn/119.1.48. [DOI] [PubMed] [Google Scholar]
- 30.Sandström B, Davidsson L, Cederblad Å, et al. Oral iron, dietary ligands and zinc absorption. J Nutr. 1985;115:411–414. doi: 10.1093/jn/115.3.411. [DOI] [PubMed] [Google Scholar]
- 31.Valberg LS, Flanagan PR, Chamberlain MJ. Effects of iron, tin and copper on zinc absorption in humans. Am J Clin Nutr. 1984;40:536–540. doi: 10.1093/ajcn/40.3.536. [DOI] [PubMed] [Google Scholar]
- 32.Davidsson L, Almgren A, Sandström B, et al. Zinc absorption in adult humans: the effect of iron fortification. Br J Nutr. 1995;74:417–425. doi: 10.1079/bjn19950145. [DOI] [PubMed] [Google Scholar]
- 33.Fairweather-Tait SJ, Wharf SG, Fox TE. Zinc absorption in infants fed iron-fortified weaning food. Am J Clin Nutr. 1995;62:785–789. doi: 10.1093/ajcn/62.4.785. [DOI] [PubMed] [Google Scholar]
- 34.Solomons NW, Jacob RA. Studies on the bioavailability of zinc in humans: effect of heme and nonheme iron on the absorption of zinc. Am J Clin Nutr. 1981;34:475–482. doi: 10.1093/ajcn/34.4.475. [DOI] [PubMed] [Google Scholar]
- 35.O'Brien KO, Zavaleta N, Caulfield LE, et al. Prenatal iron supplements impair zinc absorption in pregnant Peruvian women. J Nutr. 2000;130:2251–2255. doi: 10.1093/jn/130.9.2251. [DOI] [PubMed] [Google Scholar]
- 36.Whittaker P. Iron and zinc interactions in humans. Am J Clin Nutr. 1998;68:442S–446S. doi: 10.1093/ajcn/68.2.442S. [DOI] [PubMed] [Google Scholar]
- 37.Lopez HW, Leenhardt F, Coudray C, et al. Minerals and phytic acid interactions: is it a real problem for human nutrition? Int J Food Sci Technol. 2002;37:727–739. [Google Scholar]
- 38.Sandberg A-S, Brune M, Carlsson N-G, et al. Inositol phosphates with different numbers of phosphate groups influence iron absorption in humans. Am J Clin Nutr. 1999;70:240–246. doi: 10.1093/ajcn.70.2.240. [DOI] [PubMed] [Google Scholar]
- 39.Hallberg L, Rossander L, Skånberg A-B. Phytates and the inhibitory effect of bran on iron absorption in man. Am J Clin Nutr. 1987;45:988–996. doi: 10.1093/ajcn/45.5.988. [DOI] [PubMed] [Google Scholar]
- 40.Fredlund K, Isaksson M, Rossander-Hulthén L, et al. Absorption of zinc and retention of calcium: dose-dependent inhibition of phytate. J Trace Elem Med Biol. 2006;20:49–57. doi: 10.1016/j.jtemb.2006.01.003. [DOI] [PubMed] [Google Scholar]
- 41.Hambidge KM, Krebs NF, Westcott JL, et al. Calcium absorption from tortilla meals prepared from low-phytate maize. Am J Clin Nutr. 2005;82:84–87. doi: 10.1093/ajcn.82.1.84. [DOI] [PMC free article] [PubMed] [Google Scholar]
- 42.Oberleas D, Cahn H-C. Complexation properties of phytate with selected cation in vitro. Trace Elem Electr. 1997;14:173–176. [Google Scholar]
- 43.Vohra P, Gray GA, Kratzer FH. Phytic acid–metal complexes. Proc Soc Exp Biol Med. 1965;120:447–449. doi: 10.3181/00379727-120-30559. [DOI] [PubMed] [Google Scholar]