Abstract
Osteoporosis is common disorder of elderly population all over the world as well as in India. The presence of osteoporosis predicts fracture risk. Fragility fracture has marked morbidity as well as mortality. Thus, osteoporosis has marked therapeutic and economic implications. Osteoporosis is defined by low bone mineral density (BMD). The gold-standard method to assess BMD is dual X-ray absorptiometry (DXA). In India, hologic and lunar machines are most commonly used to measure BMD; these machines have their own normative data from which patients BMD is compared and results are generated. As per recommendations, all postmenopausal women and men above 70 years need BMD estimation other than quite a few other specific indications as well. With increasing life expectancy, increased awareness of osteoporosis, and availability of DXA machines, there is flooding of requests for BMD estimation. In view of all this, it becomes imperative on part of physicians, orthopedicians, rheumatologists, and endocrinologists alike to be fully aware about pitfalls in BMD assessment by DXA and interpretation of BMD reports.
Keywords: Bone mineral density, dual energy x-ray absorptiometry, osteoporosis, osteopenia
INTRODUCTION
Osteoporosis as a term was defined for the first time by Fuller Albright in 1950s as too little bone.[1] NIH in 1988 defined osteoporosis as a skeletal disorder characterized by compromised bone strength predisposing a person to an increased risk of fracture. Bone strength primarily reflects the integration of bone density and bone quality.[2] NIH later updated its definition of osteoporosis in 2001 as a systemic skeletal disease characterized by low bone mass and microarchitectural deterioration of bone tissue leading to enhanced bone fragility and consequent increase in fracture risk.[3] Although this definition covers all components of osteoporosis, estimation of bone mineral mass and microarchitectural structure has been a difficult preposition. In view of these difficulties, world health organization (WHO) in 1994 gave operational definition of osteoporosis as follows: Normal: Bone mineral density (BMD) higher than 1 SD below the young adult mean; Osteopenia, or low bone mass: BMD between 1 and 2.5 SD below the young adult mean; Osteoporosis: BMD lower than and equal to 2.5 SD below the young adult mean and Established (or severe) osteoporosis: BMD lower than 2.5 SD below the young adult mean and the presence of one or more fragility fractures.[4] There are different techniques to assess BMD. Densitometric techniques have evolved over last century from initial use of dental radiographs of mandible by dentists to quantitative morphometry using plain radiographs, ultrasonography-based methods, dual energy absorptiometry, and finally CT scan-based modalities like peripheral quantitative computed tomography (QCT) and high resolution QCT.[5,6] Peripheral X-ray absorptiometry (DXA) systems, which are portable and less expensive can be used for screening and as risk assessment tools, but cannot be used for diagnosis, treatment, and follow-up.[7]
Osteoporosis is a disease predominantly affecting elderly population with significant morbidity and mortality. In Asia, the percentage of elderly population above 65 years of age is likely to increase from 5.3% in 1995 to 9.3% in 2025, implying increased number of people exposed to osteoporosis and increased prevalence of osteoporosis. Thus, osteoporosis presently has attained epidemic proportions because of increased life expectancy and other life style factors.[8] Osteoporosis represents a major public health problem because of its association with low-energy trauma or fragility fractures. It has been estimated that 1 of 3 women more than 50 years of age is affected with osteoporosis.[9] One of 5 men more than 50 years of age is affected with osteoporosis and by 60 years of age in USA 50% of women are osteoporotic.[10] In India, expert groups peg the number of osteoporosis patients at approximately 26 million (2003 figures), with the numbers projected to increase to 36 million by 2013.[11]
The gold-standard technique for estimation of BMD is the DXA technique because of their reproducibility, large normative data, non-invasive nature, little time requirement for procedure, and minimal radiation exposure.[12] Presently, in India DXA machines, manufactured by Hologic and Lunar, are available to assess BMD. Hologic machine uses fan beam technology while Lunar machine uses a pencil beam technique for assessment of BMD. With availability of DXA machines and increasing awareness about bone health, BMD measurement has become common in larger cities.[8] In coming time, primary care physician will often see BMD reports, which they will have to interpret and take decision on treatment. Most often than not, whenever a primary care physician is given a BMD report he looks at final conclusion which is computer generated and makes decision accordingly. This may be misleading and a wrong interpretation of report can cause inappropriate treatment. Hence, it is essential for every primary care physician to be aware of pitfalls in interpretation of BMD report.
PITFALLS IN INDICATION
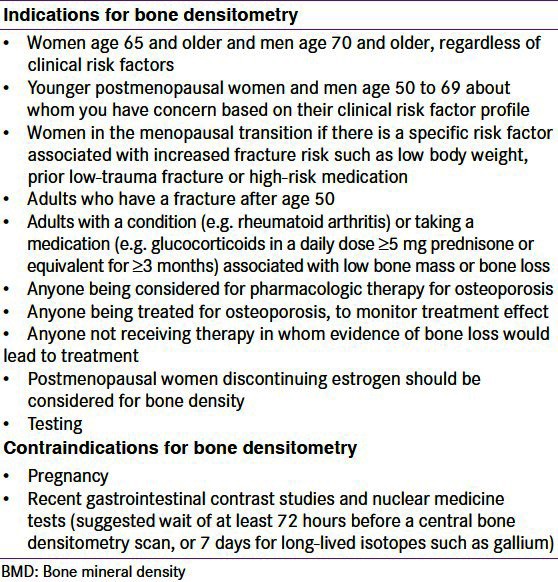
First question should be asked as to why BMD was done? Indications for BMD are given in Table 1. However, in India we will find BMD done for other than indications on the behest of patient's request or inappropriate physician's advice. Osteoporosis is defined particularly with population-based fracture studies in postmenopausal women above the age of 50 years. Suppose when it is done in menstruating women below the age of 50 years, interpretation becomes difficult. An average age of menopause in Indian women is 46 years[13] which is earlier by 3 and 5 years from other Asian[14] and Caucasian women.[15] With this in mind should we advise Indian women to undergo BMD 5 years earlier than recommended by National Osteoporosis Foundation[16] or International Society of Clinical Densitometry?[17] Also peak BMD in Indian women is reported less than Caucasian counterpart.[18] This will also cause early onset of osteoporosis with accelerated bone less with onset of menopause. This is further supported by recent data in healthy Indian population, where 25% of males and 42% of female above the age of 50 years was found to be osteoporotic.[9] There is requirement of studies evaluating relation between fracture risk BMD data in our population to form cut off criteria for BMD.
Table 1.
Indications and contraindications to bone mineral density measurement
PITFALLS IN MEASUREMENTS OF BONE MINERAL DENSITY
Next we look at the X-ray photo given in the report. In this we must be aware of positioning and anatomical variation in population, which can lead to erroneous report.
At L1-L4
A. Positioning: In BMD assessment at L1–L4 level, first requirement is correct positioning of patient. The spinous process should be centered in straight midline and should include part of the sacrum (ilium) and part of a vertebra with ribs (usually T12) [Figure 1a]. Rotation of spine [Figure 1b] leads to low estimation of BMD. Vertebral area increases with increasing rotation up to 50°-60° in either direction from midline. Although BMC almost remains neutral, but BMD is assessed as BMC per area so it leads to falsely low BMD assessment. From neutral to 60°, the decrease in BMD is almost 20%.[19] In patients with scoliosis, measurement of BMD becomes invalid because pateint can not be positioned straight.
Figure 1.
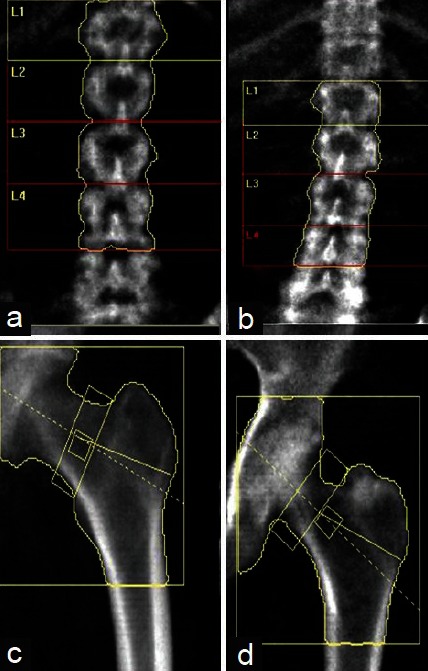
Correct position (Right panel) and anatomy of vertebral column and left femur, and incorrect position (Left Panel) and anatomy of vertebral column (not centered as spinous process are rotated) and left femur (inadequate rotation as lesser trochanter not visible)
B. Anatomical variation: During evaluation of BMD, sometimes there can be 6 lumbar vertebrae or floating 12th rib which can lead to wrong numbering of vertebra by software of the machines [Figure 2a]. Hence, vertebrae should be counted from sacrum or vertebrae can be identified by morphology. L1 is U shaped, L2 is V shaped, L3 is Y shaped and L4 is H-shaped and L5 appears as a capital I lying on its side. Also, on lateral view 12th rib overlaps L1 and pelvis overlaps L4, which can help in identifying lumbar vertebrae in case of confusion.[20]
Figure 2.
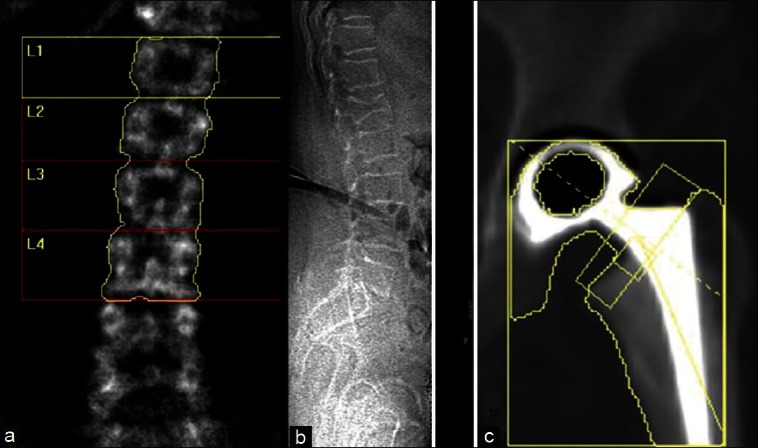
Anatomical variation and artifact: (a) Six lumbar vertebrae, (b) Compression fracture visible of lateral film, (c) Hip prosthesis
Among lumbar vertebrae, L1 has lowest BMD which increases from L1 to L4.[20] One study has shown that 17% of skeletons examined had an abnormal pattern of vertebral segmentation and rib placement other than 5 lumbar vertebrae and lowest ribs on T12.[21] In the case of the absence of 12th rib vertebrae, T12 will be mislabeled as L1 leads to lowering of BMD at L1 and BMC averages from L1 to L4 will also be lowered.[20] Vice-versa, in the presence of six lumbar vertebrae; L2 can be labeled as L1 if counted from below, overestimating BMD.
C. Normal progression: In assessing BMD at L1–L4, take average of all four vertebra if possible and do not infer any conclusion if BMD is low only in one vertebra [Figure 3]. In the case of sudden change in BMD from one to next vertebra, look for the presence of fracture or any other artifact like osteosclerosis, aortic calcification [Figure 4], etc., If one or two vertebrae are affected, they should be excluded from final interpretation [Figure 5]. In Figure 5, report suggests osteopenia, but after exclusion of vertebra with old fracture corrected report revealed osteoporosis leading to different therapeutic outcome and implications for patient. If more than three vertebrae are affected and only one vertebra is available, then it is better to ignore BMD report at lumbar spine and decision should be based on BMD at femoral neck.
Figure 3.
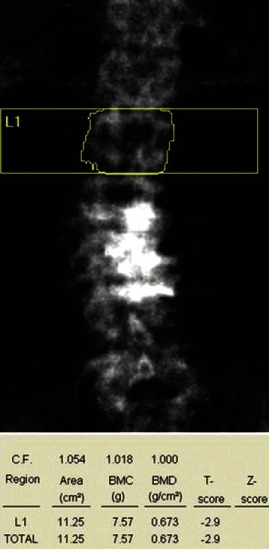
Bone mineral density measured and reported on one vertebra
Figure 4.
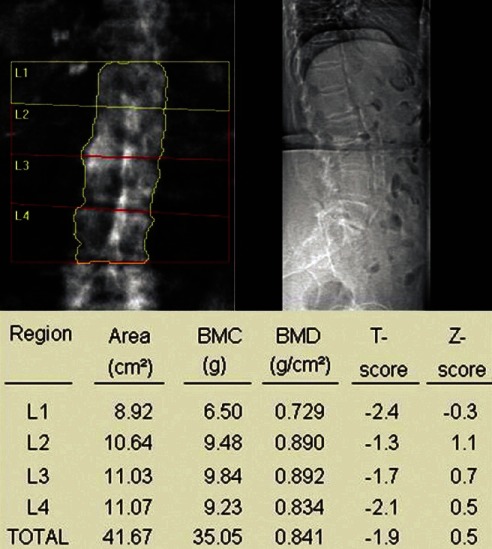
Aortic calcification – leading to an increase in bone mineral density at L2 (also observe the difference of more than 1 SD between L1 and L2)
Figure 5.
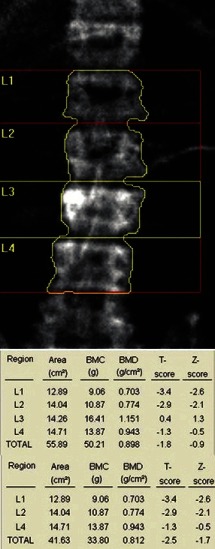
Fracture of L3 vertebra causing erroneously high bone mineral density (BMD) (osteopenia), but after exclusion BMD report shows osteoporosis
D. Artifacts: While assessing BMD at lumbar spine in antero-posterior view, one must look for artifacts. Artifacts can be metallic objects like surgical clips, navel rings, barium sulfate, metal from zipper, coin, clip, or other object. In the case of artifacts like osteoarthritis, fracture [Figure 2b], end plate sclerosis, calcified aorta, radio-opaque material (e.g. thorotrast) correction should be made by removal of artifacts, or exclusion of vertebra. Osteoporotic fractures commonly occurs in the T7–T9 and T12–L2 regions.[22] Osteophytes can also lead to overestimation of BMD. The magnitude of increase in BMD due to osteophytes vary from 9.5% at L4 to 13.9% at L1.[23] In one study, the effect of osteophytes on BMD was sufficient enough to cause 50% of men and 25% of women with osteopenia to be misdiagnosed and 20% of men and 10% of women with osteoporosis were misdiagnosed because of osteophytes.[24] Thus, the effect of osteophytes can be dramatic. Aortic calcification is believed to be common in elderly, i.e., up to 30%.[23] However, the effect of aortic calcification on BMD is believed to be insignificant. In a recent ex vivo study of cadavers, removal of aorta leads to an average decrease in BMD by 5%.[25] Facet sclerosis can also significantly affect BMD.[26] Other possible artifacts which have been reported include pancreatic calcifications, renal stones, gall stones, contrast agents, ingested tablets. Some objects like tantalium clips used in vascular surgery, lead bullets have very high density and appear as black hole on DXA in place of white.[27] These lead to increased BMD estimation.
At proximal femur
A. Positioning: In BMD assessment at femoral neck, lesser trochanter should be just visible [Figure 1c]. The absence [Figure 1d] or overvisualization of lesser trochanter lead to falsely high BMD values. In positioning of femur internal rotation of femur by 15-20% is required which brings femoral neck axis parallel to plane of scan table. In one cadaveric study, the mean increase in BMD at femur neck was 2.8% in the anteverted position as compared to the neutral position.[28] Hip analysis includes one midline, which should be centered for correct analysis and division of regions. BMD at femoral neck if highest at proximal and lowest at distal part. Femoral neck box is placed differently in GE lunar and Hologic machines, hence may give different results. In GE Lunar, it is placed at narrowest part, which is half way between the femoral head and the trochanter, whereas in Hologic, it is placed at the most distal part of the femoral neck.
B. Artifacts: Structural changes and artifacts interfering with DXA at proximal femur are less often as compared to spine. Osteoarthritic changes at hip joint may cause increased BMD assessment in femoral neck and Ward's area. However, the trochantric region is not affected by osteoarthritis and thus is the preferred site to evaluate patients in patients with osteoarthritis of hip.[29] Scoliosis however has been seen to cause lower bone densities on the side of convexity.[30] Proximal femur fracture and implants render BMD assessment inaccurate at the femur site [Figure 2c]. If femur cannot be rotated due to arthritis or pain, BMD should not be done on that side and other side femur can be used because generally there is no effect of leg dominance on BMD estimation.[31]
C. Ward's area: Another important thing to be remembered is regarding Ward's area. Ward's area was originally called Ward's triangle, which is formed by intersection of three trabecular bundles running from greater trochanter to head and lesser trochanter to head and one bundle joining greater and lesser trochanter. Ward's area should not be used for interpretation of BMD.[32]
Forearm in densitometry
BMD assessment at forearm is quite variable in the sense that different sites are used to assess BMD. Commonly measured sites are 33% or one third site, the 50% or 10% sites, the 5 and 8 mm sites and ultradistal sites. Sites mentioned in percentage are based on location of site in relation to overall length of the ulna. So 50% site on radius means site on the radius which is directly across from the site on ulna that marks 50% on ulnar length, not 50% of radial length. 5 or 8 mm site are the location where separation between radius and ulna is 5 or 8 mm, respectively. 33% and 50% sites are considered mid radial sites, while 10% site is considered as distal site. The ultradistal site is usually centered at 5% of ulnar length. Significance of these sites is such that they reflect percentage of cortical bone at these sites. The ultradistal site has around 66% of trabecular bone.[28] Authors preferably use 33% site to assess forearm BMD at their center if forearm DXA is required to assess cortical bone BMD.
Unlike proximal femur, arm dominance has a profound effect on BMD at forearm. In healthy individual, BMC at 33% radial site differs by 6-9% between dominant and non-dominant arm.[33] Difference of 3% is reported at 8 mm site.[34] Traditionally, non-dominant arm is used to assess BMD and most data is also from non-dominant arm, thus it is advisable to assess BMD of non-dominant forearm.
Forearm site is relatively free of artifacts and confounding factors which are seen in lumbar spine. Prior fracture of forearm leads to an increase in BMC by 20% at distal radius as compared to non-fractured forearm irrespective of dominant or non-dominant forearm.[35]
Also, movement artifacts are quite common in forearm BMD as up to 20% of scans in the oldest study group. Movement leads to underestimation of BMD.[36]
PITFALLS IN INTERPRETATION OF BMD DATA
In the BMD report you will see BMC; BM area and BMD value; T-score; and Z-score. In this, BMD is the measured parameter and allows the calculation of the bone mineral content (BMC) in grams with the help of two-dimensional projected area in cm2 of the bone (s) and BMD; thus, the units of BMD are g/cm2. The T-score is calculated using the formula: (patient's BMD – young normal mean)/SD of young, normal, healthy Caucasian female. Z-score is calculated similarly to the T-score, except that the patient's BMD is compared with an age-matched (and race- and gender-matched) mean, and the result expressed as a SD score.[37] Numerical assessment is also quite important in BMD estimation and in the case of atypical results, one should review image and take history and correct for that defect. At L1–L4, normally BMD should increase from L1 to L4 and variation of T score by more than 1 SD should raise suspicion of some anatomical variation or artifact.[20] In premenopausal women, a low Z-score (below –2.0) indicates that bone density is lower than expected and should trigger a search for an underlying cause [Table 2].
Variation in BMD according to ethnicity: The prevalence of osteoporosis among older population (>50 years of age) varies widely in different races and ethnicity. Indian population is placed at higher risk of osteoporosis.[9] Among different populations, the prevalence of osteoporosis is as follows: US Caucasian (Women – 18%; Men – 6%); Europe (Denmark – 41% women; 18% men; Sweden – 21% women; men – 6%); Taiwan (11.4% women and 1.6% men); and India (42.5% women and 24.8% men) have osteoporosis.[9]
Importance of population-based normative data on peak BMD—GE Lunar and recent Hologic machines use the database for young-normal Caucasians to calculate T-scores, regardless of the race of the subject. Indian population is mixture of various racial denominations. Recently, few studies have assessed the peak BMD in normal healthy Indian males and females and have shown it to be significantly lower than values reported in white Caucasian populations.[38] For example, the peak BMD at femoral neck in females ranged from 0.850 ± 0.101 g/cm2 to 0.967 ± 0.107 g/cm2 depending on the model and manufacturer of the DXA machine used, which is significantly lower than that reported in US and European populations.[39,40,41] A population-bases ICMR study reported peak mean BMD values in women were 0.901 ± 0.111, 0.538 ± 0.044, and 0.954 ± 0.095 at the hip, forearm, and spine. The ICMR study has proposed the cut-off values for diagnosing osteoporosis in women as 0.624, 0.428, and 0.717 gm/cm2 compared to 0.637, 0.539 and 0.774 at hip, forearm and spine respectively from reference data for Hologic machines.[41] This could be attributed to differences in frame size, height, vertebral size, hip width and BMI, and nutritional and genetic factors.[9] This data have not been validated against fracture risk in the population. And this normative data did not find place in available machines. Hence, comparing normal Indian population BMD with peak value of Caucasian population may lead to overestimation of osteoporosis. The prevalence of osteoporosis significantly decreases when Indian reference data is applied.[9] Hence, applying peak BMD data of Caucasians to define cutoffs for osteoporosis and osteopenia in Indian population remains an issue for debate.
Which skeletal site to use for diagnosis? If possible measure BMD at both lumbar spine and proximal femur. At lumbar spine, reported BMD is an average of BMD from L1 to L4. Accept BMD from either of femur neck or total femur, whichever is lower.[42] Final reporting of BMD is based on lowest T/Z score among average L1–L4 and proximal femur.[42] In the case of doubt review image quality and accuracy of scan acquisition and analysis. The lateral spine and Ward's triangle region of the hip should not be used for diagnosis, because these sites overestimate osteoporosis and results can be false positive. Radial BMD (33% site or 1/3rd radial site in non-dominant arm) can be used for estimation of osteoporosis only when BMD cannot be measured at lumbar vertebrae or femur or in very obese pateints, in patients of hyperparathyroidismand males receiving androgen deprivation therapy.[32] Also, radial BMD can be used for population screening in view of its high negative predictitvity.
Table 2.
Causes of secondary osteoporosis

BMD estimation in pediatric population
Before interpreting pediatric DXA scan, a physician should be clear that diagnosis of osteoporosis can not be reached on the basis of BMD alone because till now there is paucity of data which corelates BMD scores with fracture risk, also BMD estimation is affected by bone area which is variable in children.[43] Diagnosis of osteopororsis in children requires the presence of clinically significant fracture history and low BMD or low bone mass (Z score <−2.0). Clinically significant fracture history is defined as one or more of the following: Long bone fracture of lower exterimities, vertebral compression fracture, or two or more fractures of long bone of upper extremities.[44]
PITFALLS IN FOLLOW-UP
For follow-up of patients who are on antiosteoporosis therapy, repeat BMD can be done after 1 to 2 years of therapy as per different guidelines, while patients for whom BMD was done and it does not fulfill the criteria for treatment, repeat BMD can be planned depending on T-score of patient. As per one recent study, interval period of screening may be 15 years for women with normal bone density or mild osteopenia (T score, greater than −1.50) at the initial assessment, 5 years for women with moderate osteopenia (T score, −1.50 to −1.99), and 1 year for women with advanced osteopenia (T score, −2.00 to −2.49).[45] Authors also propose that interval of BMD can be predicted on the basis of original bone mineral content and rate of decline in bone mineral content in post menopausal (1-2% in perimenopausal age for 10 years and 0.5-1% thereafter and same in elderly males). For example, if a postmenopausal woman has BMD value of 0.900 gm/cm2 at lumbar spine. For Hologic machines, reference peak BMD at spine is 1.047 ± 0.110 gm/cm2. BMD at −2.5 SD will be 0.774 gm/cm2. If we take maximum possible loss of BMD at 2%, then it will take at least 7 years (0.900-0.774/0.018) to develop osteoporosis. Hence, BMD can be repeated safely after 7 years. Finally, repeat BMD should be performed on the same machine and preferably by same technician as some variability occurs on repeat measurement. This variability is calculated by least significant change (LSC) for that machine and technician. LSC is calculated to determine if observed change is a true interval change as opposed to observer's variability. In order to be 95% sure that change is true interval change rather than observer variability, monitoring interval should be more than LSC. LSC is calculated by formula LSC = 2.8 × Precision error. Thus, finally monitoring time interval = expected gain in BMD/LSC.[37]
Another important issue during follow up is use of different BMD machine for subsequent BMD assessment. In such a situation, it is advised to standardize BMD (sBMD) as per different machines. Conversion tables are available on internet and reader is referred to use them for conversion BMD from one machine to another.[46] sBMD at femoral neck is calculated by formula: sBMD = 1000 (a + b × BMD), where for Hologic machines a = 0.019 and b = 1.087 and for Lunar machines a = –0.023 and b = 0.939.[40] Similarly, for calculating sBMD at spine, the formula for Hologic is: 1.0550 (BMD – 0.972) +1.0436, and for Lunar is: 0.9683 (BMD – 1.100) +1.0436.[47,48]
In conclusion, correct interpretationof BMD requires attention to detail in anthropometric information, patient positioning, correct scan analysis (definition of ROI), BMD pattern of individual vertebrae, and identification of artefacts.
Footnotes
Source of Support: Nil
Conflict of Interest: None declared
REFERENCES
- 1.Forbes AP. Fuller albright. His concept of postmenopausal osteoporosis and what came of it. Clin Orthop Relat Res. 1991;269:128–41. [PubMed] [Google Scholar]
- 2.Osteoporosis prevention, diagnosis, and therapy. [Last cited on 2012 Jul 09];NIH Consens Statement. 2000 17:1–45. Available from: http://consensus.nih.gov/2000/2000osteoporosis111html.htm . [PubMed] [Google Scholar]
- 3.Osteoporosis Prevention, Diagnosis, and Therapy. NIH Consensus Development Panel on osteoporosis Prevention, Diagnosis, and Therapy. JAMA. 2001;285:785–95. doi: 10.1001/jama.285.6.785. [DOI] [PubMed] [Google Scholar]
- 4.Genant HK, Cooper C, Poor G, Reid I, Ehrlich G, Kanis J, et al. Interim report and recommendations of the World Health Organization Task-Force for Osteoporosis. Osteoporos Int. 1999;10:259–64. doi: 10.1007/s001980050224. [DOI] [PubMed] [Google Scholar]
- 5.Link TM. Osteoporosis imaging: State of the art and advanced imaging. Radiology. 2012;263:3–17. doi: 10.1148/radiol.12110462. [DOI] [PMC free article] [PubMed] [Google Scholar]
- 6.Genant HK, Jiang Y. Advanced imaging assessment of bone quality. Ann N Y Acad Sci. 2006;1068:410–28. doi: 10.1196/annals.1346.038. [DOI] [PubMed] [Google Scholar]
- 7.Eis SR, Lewiecki EM. Peripheral bone densitometry: Clinical applications. Arq Bras Endocrinol Metabol. 2006;50:596–602. doi: 10.1590/s0004-27302006000400005. [DOI] [PubMed] [Google Scholar]
- 8.Mithal A, Dhingra V, Lau E, Stenmark J, Nauroy L. Nyon, Swizterland: International Osteoporosis Foundation; 2009. The Asian audit: Epidemiology, costs and burden of osteoporosis in Asia 2009. [Google Scholar]
- 9.Marwaha RK, Tandon N, Garg MK, Kanwar R, Narang A, Sastry A, et al. Bone health in healthy Indian population aged 50 years and above. Osteoporos Int. 2011;22:2829–36. doi: 10.1007/s00198-010-1507-8. [DOI] [PubMed] [Google Scholar]
- 10.Bone health and osteoporosis: A report of the Surgeon-General. Rockville: US Department of Health and Human Services, Office of the Surgeon General; 2004. Department of Health and Human Services. [Google Scholar]
- 11.Handa R. New Delhi: Osteoporosis Society of India; [Last accessed on 2012 June 26]. 2003 Action plan osteoporosis: Consensus statement of the expert group meeting; pp. 1–40. Available from: http://www.osteofound.org/press_centre/fact_sheet.html . [Google Scholar]
- 12.Blake GM, Fogelman I. The role of DXA bone density scans in the diagnosis and treatment of osteoporosis. Postgrad Med J. 2007;83:509–17. doi: 10.1136/pgmj.2007.057505. [DOI] [PMC free article] [PubMed] [Google Scholar]
- 13.Singh M. Early age of natural menopause in India, a biological marker for early preventive health programs. Climacteri. 2012;15:581–6. doi: 10.3109/13697137.2011.643514. [DOI] [PubMed] [Google Scholar]
- 14.Loh FH, Khin LW, Saw SM, Lee JJ, Gu K. The age of menopause and the menopause transition in a multiracial population: A nation-wide Singapore study. Maturitas. 2005;52:169–80. doi: 10.1016/j.maturitas.2004.11.004. [DOI] [PubMed] [Google Scholar]
- 15.Kato I, Toniolo P, Akhmedkhanov A, Koenig KL, Shore R, Zeleniuch-Jacquotte A. Prospective study of factors influencing the onset of natural menopause. J Clin Epidemiol. 1998;51:1271–6. doi: 10.1016/s0895-4356(98)00119-x. [DOI] [PubMed] [Google Scholar]
- 16.Washington D.C: National Osteoporosis Foundation; 2003. Physician's Guide to Prevention and Treatment of Osteoporosis. [Google Scholar]
- 17.The International Society for Clinical Densitometry: 2007 Official positions and pediatric official positions. 2007. [Assessed on 26 June 2012]. Available from: http://www.iscd.org/visitors/pdfs/ISCD 2007. Officia lPositions -Combined -Adult and Pediatric.pdf .
- 18.Shatrugna V, Ammini AC, Tandon N, Goswami R, Gupta N, Bhatia E, et al. New Delhi: ICMR Publication; Published by Director General; 2010. Population based reference standards of peak bone mineral density of Indian males and females: An ICMR multi task force study. [Google Scholar]
- 19.Giraradi FP, Parvataneni HK, Sandhu HS, Cammisa FP, Jr, Grewal H, Schneider R, et al. Correlation between vertebral body rotation and two-dimensional vertebral bone density measurement. Osteoporos Int. 2001;12:738–40. doi: 10.1007/s001980170049. [DOI] [PubMed] [Google Scholar]
- 20.Peel NF, Johnson A, Barrington NA, Smith TW, Eastell R. Impact of anomalous vertebral segmentation on measurements of bone mineral density. J Bone Miner Res. 1993;8:719–23. doi: 10.1002/jbmr.5650080610. [DOI] [PubMed] [Google Scholar]
- 21.Bornstein PE, Peterson RR. Numerical variation of the presacral vertebral column in three population groups in north America. Am J Phys Anthropol. 1966;25:139–46. doi: 10.1002/ajpa.1330250205. [DOI] [PubMed] [Google Scholar]
- 22.Nevitt MC, Ross PD, Palermo L, Musliner T, Genant HK, Thompson DE. Association of prevalent vertebral fractures, bone density, and alendronate treatment with incident vertebral fractures: Effect of number and spinal location of fractures. The Fracture Intervention Trial Research Group. Bone. 1999;25:613–9. doi: 10.1016/s8756-3282(99)00202-1. [DOI] [PubMed] [Google Scholar]
- 23.Rand T, Seidl G, Kainberger F, Resch A, Hittmair K, Schneider B, et al. Impact of spinal degenerative changes on the evaluation of bone mineral density with dual energy X-ray absorptiometry (DXA) Calcif Tissue Int. 1997;60:430–3. doi: 10.1007/s002239900258. [DOI] [PubMed] [Google Scholar]
- 24.Liu G, Peacock M, Eilam O, Dorulla G, Braunstein E, Johnston CC. Effect of osteoarthritis in the lumbars pine and hip on bone density and diagnosis of osteoporosis in elderly men and women. Osteoporos Int. 1997;7:564–9. doi: 10.1007/BF02652563. [DOI] [PubMed] [Google Scholar]
- 25.Cherney DD, Laymon MS, McNitt A, Yuly S. A study on the influence of calcified intervertebral disk and aorta in determining bone mineral density. J Clin Densitom. 2002;5:193–8. doi: 10.1385/jcd:5:2:193. [DOI] [PubMed] [Google Scholar]
- 26.Drinka PJ, DeSmet AA, Bauwens SF, Rogot A. The effect of overlying calcification on lumbar bone densitometry. Calcif Tissue Int. 1992;50:507–10. doi: 10.1007/BF00582163. [DOI] [PubMed] [Google Scholar]
- 27.Morgan SL, Lopez-Ben R, Nunnally N, Burroughs L, Fineberg N, Tubbs RS, et al. “Black hole artifacts”: A new potential pitfall for DXA accuracy? J Clin Densitom. 2008;11:266–75. doi: 10.1016/j.jocd.2007.11.005. [DOI] [PubMed] [Google Scholar]
- 28.Cheng XG, Nicholson PH, Boonen S, Brys P, Lowet G, Nijs J, et al. Effects of anteversion on femoral bone mineral density and geometry measured by dual energy X-ray absorptiometry: A cadaver study. Bone. 1997;21:113–7. doi: 10.1016/s8756-3282(97)00083-5. [DOI] [PubMed] [Google Scholar]
- 29.Preidler KW, White LS, Tashkin J, McDaniel CO, Brossmann J, Andresen R, et al. Dual-energy X-ray absorptiometric densitometry in osteoarthritis of the hip. Influence of secondary bone remodeling of the femoral neck. Acta Radiol. 1997;38:539–42. doi: 10.1080/02841859709174383. [DOI] [PubMed] [Google Scholar]
- 30.Hans D, Biot B, Schott AM, Meunier PJ. No diffuse osteoporosis in lumbar scoliosis but lower femoral bone density on the convexity. Bone. 1996;18:15–7. doi: 10.1016/8756-3282(95)00421-1. [DOI] [PubMed] [Google Scholar]
- 31.Petley GW, Taylor PA, Murrills AJ, Dennison E, Pearson G, Cooper C. An investigation of the diagnostic value of bilateral femoral neck bone mineral density measurements. Osteoporos Int. 2000;11:675–9. doi: 10.1007/s001980070065. [DOI] [PubMed] [Google Scholar]
- 32.Watts NB, Adler RA, Bilezikian JP, Drake MT, Eastell R, Orwoll ES, et al. Osteoporosis in men: An endocrine society clinical practice guideline. J Clin Endocrinol Metab. 2012;97:1802–22. doi: 10.1210/jc.2011-3045. [DOI] [PubMed] [Google Scholar]
- 33.Karjalainen P, Alhava EM. Bone mineral content of the forearm in a healthy population. Acta Radiol Oncol Radiat Phys Biol. 1976;16:199–208. doi: 10.3109/02841867709134313. [DOI] [PubMed] [Google Scholar]
- 34.Borg J, Mollgaard A, Riis BJ. Single X-ray absorptiometry: Performance characteristics and comparison with single-photon absorptiometry. Osteoporos Int. 1995;5:377–81. doi: 10.1007/BF01622260. [DOI] [PubMed] [Google Scholar]
- 35.Akesson K, Gardsell P, Sernbo I, Johnell O, Obrant KJ. Earlier wrist fracture: A confounding factor in distal forearm bone screening. Osteoporos Int. 1992;2:201–4. doi: 10.1007/BF01623927. [DOI] [PubMed] [Google Scholar]
- 36.Berntsen GK, Tollan A, Magnus JH, Søgaard AJ, Ringberg T, Fønnebø V. The tromsø study: Artifacts in forearm densitometry-prevalence and effects. Osteoporos Int. 1999;10:425–32. doi: 10.1007/s001980050249. [DOI] [PubMed] [Google Scholar]
- 37.El Maghraoui A, Mounach A, Gassim S, Ghazi M. Vertebral fracture assessment in healthy men: Prevalence and risk factors. Bone. 2008;43:544–8. doi: 10.1016/j.bone.2008.05.008. [DOI] [PubMed] [Google Scholar]
- 38.Malhotra N, Mithal A. Osteoporosis in Indians. Indian J Med Res. 2008;127:263–8. [PubMed] [Google Scholar]
- 39.Tandon N, Marwaha RK, Kalra S, Gupta N, Dudha A, Kochupillai N. Bone mineral parameters in healthy young Indian adults with optimal vitamin D availability. Natl Med J India. 2003;16:298–302. [PubMed] [Google Scholar]
- 40.Makker A, Mishra G, Singh BP, Tripathi A, Singh MM. Normative bone mineral density data at multiple skeletal sites in Indian subjects. Arch Osteoporos. 2008;3:25–37. [Google Scholar]
- 41.New Delhi: ICMR: Published by Director General; 2010. Population based reference standards of Peak Bone Mineral Density of Indian males and females – an ICMR multi-center task force study; pp. 1–24. [Google Scholar]
- 42.Clinician's Guide to Prevention and Treatment of Osteoporosis. Washington, DC: National Osteoporosis Foundation; 2008. National Osteoporosis Foundation. [Google Scholar]
- 43.Shaw NJ. Management of osteoporosis in children. Eur J Endocrinol. 2008;159(Suppl 1):S33–9. doi: 10.1530/EJE-08-0282. [DOI] [PubMed] [Google Scholar]
- 44.Skeletal health assessment in children and adolescents (males and females ages 5-19) [Last assessed on 2012 June 26]. Available from: http://www.iscd.org .
- 45.Gourlay ML, Fine JP, Preisser JS, May RC, Li C, Lui LY, et al. Study of Osteoporotic Fractures Research GroupBone-density testing interval and transition to osteoporosis in older women. N Engl J Med. 2012;366:225–33. doi: 10.1056/NEJMoa1107142. [DOI] [PMC free article] [PubMed] [Google Scholar]
- 46. [Last assessed on 2012 June 26]. Available from: http://courses.washington.edu/bonephys/opBMDs.html .
- 47.Lu Y, Fuerst T, Hui S, Genant HK. Standardization of bone mineral density at femoral neck, trochanter and ward's triangle. Osteoporos Int. 2001;12:438–44. doi: 10.1007/s001980170087. [DOI] [PubMed] [Google Scholar]
- 48.Hui SL, Gao S, Zhou XH, Johnston CC, Jr, Lu Y, Glüer CC, et al. Universal standardization of bone density measurements: A method with optimal properties for calibration among several instruments. J Bone Miner Res. 1997;12:1463–70. doi: 10.1359/jbmr.1997.12.9.1463. [DOI] [PubMed] [Google Scholar]


