Abstract
Microbial ecologists have discovered novel rRNA genes (rDNA) in mesophilic soil habitats worldwide, including sequences that affiliate phylogenetically within the division Crenarchaeota (domain Archaea). To characterize the spatial distribution of crenarchaeal assemblages in mesophilic soil habitats, we profiled amplified crenarchaeal 16S rDNA sequences from diverse soil ecosystems by using PCR-single-stranded-conformation polymorphism (PCR-SSCP) analysis. PCR-SSCP profiles provide a measure of relative microbial diversity in terms of richness (number of different phylotypes as estimated from the number of unique PCR-SSCP peaks) and evenness (abundance of each phylotype as estimated from the relative area under a peak). Crenarchaeal assemblages inhabiting prairie, forest, turf, and agricultural soils were characterized at six sampling locations in southern and central Wisconsin. Phylotype richness was found to be more stable than evenness among triplicate samples collected within 30 cm at each sampling location. Transformation of the PCR-SSCP data by principal-component analysis, followed by statistical testing (analysis of variance [P < 0.0001] and least-significant-difference analysis [α = 0.5]), supported the conclusion that each location exhibited a unique profile. To further characterize the spatial distribution of crenarchaeal assemblages at one location, additional soil samples (a total of 30) were collected from agricultural field plots at the Hancock Agricultural Research Station. PCR-SSCP revealed a patchy spatial distribution of crenarchaeal assemblages within and between these plots. This mosaic of crenarchaeal assemblages was characterized by differences in phylotype evenness that could not be correlated with horizontal distance (15 to 30 m) or with depth (0 to 20 cm below the surface). Crenarchaeal 16S rDNA clone libraries were produced and screened for unique SSCP peaks. Clones representing the dominant phylotypes at each location were identified, sequenced, and found to group phylogenetically with sequences in crenarchaeal clade C1b.
The combination of microbial ecology and molecular phylogeny has revealed that the majority of microbes in natural ecosystems have not been cultivated in the laboratory (19, 32). Of the possible millions of microbial species inhabiting Earth, fewer than 5,000 have been characterized (52), exemplifying the tremendous gap in our understanding of microbial life on this planet. Reports of novel 16S rRNA genes (rDNA) PCR amplified and cloned from the environment have become commonplace. But characterization of the corresponding organisms in their native habitats is still challenging, thus limiting our understanding of the niche most microbes occupy in the global ecosystem.
The growing collection of environmental 16S rDNA sequences includes members of the archaeal division Crenarchaeota, which have been found in marine, aquatic, and terrestrial environments (for a review, see reference 10). Quantitative filter hybridization (5) and real-time PCR quantification (31) of 16S rRNA sequences from mesophilic soils have estimated that crenarchaeotes represent approximately 1% and 0.5 to 3.0%, respectively, of the total soil microbial community. Crenarchaeal 16S rDNA sequences from one monophyletic clade, C1b (9, 10), have been recovered from a variety of habitats around the globe, including earthworm casts (15), termite guts (14), a geothermal vent (57), a river estuary (8), freshwater sediments (17), an acid mine (50), and a variety of soils (3-6, 15, 25, 30, 31, 33, 36, 37, 39, 45, 53, 55). In Wisconsin, C1b rDNA sequences have been recovered from soil at the University of Wisconsin West Madison Agricultural Research Station (3) and crenarchaeotes have been found to colonize plant roots grown in soil from this same location (45).
PCR-based 16S rDNA profiling provides a rapid characterization of the most abundant phylotypes present within an environmental sample without the prerequisite of first culturing the microbe in the laboratory. While the comparison of two amplified 16S rDNA profiles provides an estimate of how alike or dissimilar two microbial assemblages may be, the results must be interpreted cautiously. Any PCR-based technique, including the comparison of 16S rDNA clone libraries, is subject to PCR biases (35, 48, 49) and may not accurately reflect cell counts of microbes in the environment owing to 16S rDNA copy number variability (12). In addition, 16S rDNA comprising less than approximately 0.1% of the available PCR template will be outcompeted during the reaction, thus eliminating detection of these rare phylotypes by PCR profiling (11, 26, 29, 56).
A variety of molecular profiling methods suitable for microbial ecology have been developed, including denaturant or temperature gradient gel electrophoresis (28, 29), ribosomal intergenic spacer analysis (4), terminal restriction fragment length polymorphism (24), and single-stranded-conformational polymorphism (SSCP) (23). The sensitivity of PCR-SSCP for detecting novel sequences in a population of small DNA fragments (<200 nucleotides [nt]) approaches that of sequencing (16, 44), and the technique has been successfully adapted for molecular ecology (47) to profile microbial 16S rDNAs (23, 51). PCR-SSCP is based on the separation of PCR fragments of the same length that differ in sequence composition. Each novel sequence has the potential to form a distinct single-stranded secondary structure that will migrate a unique distance through a polyacrylamide gel. The resulting peaks (each representing a phylotype) may thus represent one or possibly a few comigrating sequences. PCR-SSCP has been a useful tool for monitoring microbes within a variety of environments (22, 34, 40-43), including monitoring of community dynamics in bioreactors (2, 58).
The objective of this study was to analyze the spatial distribution of crenarchaeal assemblages in soil. We used PCR-SSCP to identify crenarchaeal phylotypes and to quantify their relative abundance in replicated soil samples collected at six locations in southern and central Wisconsin. We also sampled replicated plots in an agricultural field (within 350 m2) to determine the underlying spatial variability of crenarchaeal assemblages in relation to horizontal distance and vertical soil depth. Finally, clone libraries of 16S rDNA (∼1,320 nt) were screened for sequences representing the dominant PCR-SSCP phylotypes amplified from the six sampling locations.
MATERIALS AND METHODS
Sample collection.
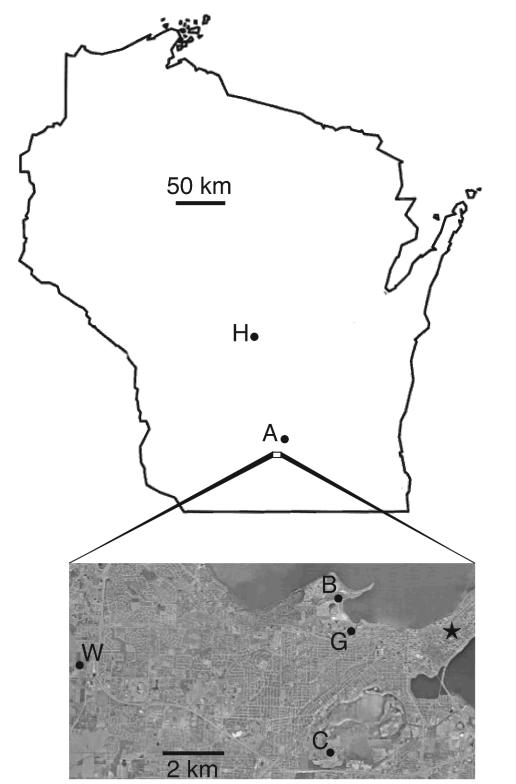
Soil samples were collected from various locations in Wisconsin (Fig. 1), including a previously sampled site at the University of Wisconsin West Madison Agricultural Research Station (3, 45). Soil collection site descriptions and coordinates in meters (Universal Transverse Mercator, zone 16) are listed in Table 1. Three 2-g (fresh weight) soil samples were collected at each location with autoclave-sterilized implements. These three samples were collected along a transect, 15 cm apart at a 0- to 3-cm depth.
FIG. 1.
Map identifying the soil sampling locations used in this study. Designations are defined in Table 1. The star denotes the Wisconsin state capitol building in Madison. The aerial photograph was compiled from data provided by the U.S. Geological Survey.
TABLE 1.
Soil collection site descriptions
| Soil ecosystem | Label | Sampling location | Soil series (classification) | Collection date | UTMa (zone 16) coordinates |
|---|---|---|---|---|---|
| Turf | W | West Madison Agricultural Research Station | Plano silt loam (Typic Argiudoll) | 6/27/01 | 4,771,047.0 293,856.4 |
| Turf | G | Walnut St. Research Fields, UWb Campus | Colwood silt loam (Typic Haplaquoll) | 7/10/01 | 4,772,035.3 302,724.8 |
| Forest | B | Picnic Point, UW Campus Natural Areas | Kidder silt loam (Typic Hapludalf) | 6/27/01 | 4,773,237.6 302,338.9 |
| Prairie | C | Curtis Prairie, UW Arboretum | Sable silty clay loam (Typic Haplaquoll) | 6/27/01 | 4,768,082.3 301,955.3 |
| Agricultural | A | Arlington Agricultural Research Station | Plano silt loam (Typic Argiudoll) | 6/27/01 | 4,796,409.2 309,516.3 |
| Agricultural | H | Hancock Agricultural Research Station | Plainfield sand (Typic Udipsamment) | 7/10/01 | 4,888,127.1 296,924.8 |
UTM, Universal Transverse Mercator.
UW, University of Wisconsin.
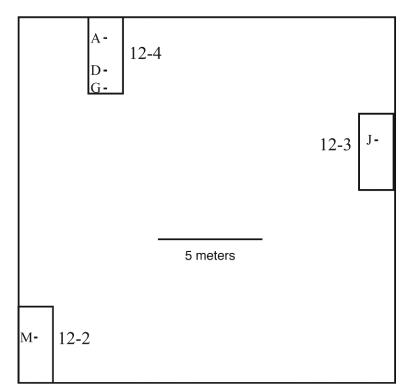
Additional samples from the University of Wisconsin Hancock Agricultural Research Station were collected in the same manner on 10 July 2001 from three plots, designated 12-4, 12-3, and 12-2 (see Fig. 4), that were part of a randomized, replicated field trial. Each plot was 3.7 by 7.6 m. Plot layout and crop history are described elsewhere (46). At the time of soil collection for this study, the plots had been fallow for 8 months. For depth comparisons, a 20-cm-deep soil core was collected from each plot and a 2-g (fresh weight) soil sample taken at 2, 6, 10, 15, and 20 cm below the ground was collected from the center of each core with autoclave-sterilized implements. All soil samples were immediately frozen in liquid nitrogen and stored in the laboratory at −80°C until processing.
FIG. 4.
Diagram of the spatial distribution of soil samples collected at replicated Hancock Agricultural Research Station field plots 12-4, 12-3, and 12-2. Plots are shown as rectangles. Soil samples (A through O) were collected along 0.3-m transects identified by dashes. Each transect represents three soil samples 15 cm apart at a 0- to 3-cm depth. Transect designations: A, soil samples A, B, and C; D, soil samples D, E, and F; G, soil samples G, H, and I; J, soil samples J, K, and L; M, soil samples M, N, and O.
DNA extraction.
For nucleic acid extraction, 0.1 to 0.5 g of each soil sample was transferred to a 2-ml screw-cap microcentrifuge tube containing 0.6 mg of 0.1-mm-diameter zirconium-silica beads, 0.6 mg of 1.0-mm-diameter zirconium-silica beads, and one 2.5-mm diameter silica bead (BioSpec Products Inc., Bartlesville, Okla.). To each tube, 1 ml of TEND (50 mM Tris, 50 mM EDTA, 100 mM NaCl, 1× Denhardt's reagent [38]) extraction buffer was added. Denhardt's reagent has been shown to improve DNA purity when included in soil extractions (54) and decreased impurities associated with the DNA extracted in this study (data not shown). Samples were sonicated for 1 min in a Branson 2200 bath sonicator and then homogenized in a Bio 101 Fast Prep bead beater (Bio 101, Inc., Vista, Calif.) at 5.5 m/s for 30 s. Samples were centrifuged at 13,000 × g for 5 min at 6°C to pellet soil and cellular debris. The supernatant containing DNA was collected for purification.
DNA purifications. (i) Selective binding to silica.
Each DNA sample was mixed with an equal volume of MEGP binding solution, pH <7.5 (50 mM MOPS [pH 7.0], 4 M guanidine thiocyanate, 20 mM EDTA, 0.00002% phenol red sodium salt), in a 96-well assay block (2-ml vol per well). Samples were transferred, with multichannel pipettes, to a Whatman UniFilter GF/B microplate 800 (Whatman Inc., Ann Arbor, Mich.). DNA was bound to the GF/B filter at the bottom of each well by pulling the liquid sample through the filter with a microplate vacuum filtration apparatus. The GF/B filters were rinsed once with 200 μl of MEGP and twice with 200 μl of MENE rinse solution (10 mM MOPS [pH 7.4], 1 mM EDTA, 100 mM NaCl, 55% ethanol). GF/B filters were dried under a vacuum for 5 min. DNA was eluted twice with 30 μl of 10 mM Tris, pH 8.0, that had been heated to 65°C. The two DNA eluates were pooled.
(ii) Microspin column chromatography.
Sepharose CL-2B resin was rinsed five times with 1 volume of sterile, MilliQ (SMQ)-purified water to remove the 20% (vol/vol) ethanol resin storage solution. After rinsing, the resin was resuspended in SMQ-purified water to produce a 60% (vol/vol) slurry. Spin columns were packed as follows. Eight hundred microliters of slurry was transferred to each well of a UniFilter GF/B 800 microplate and centrifuged at 30 × g for 1 min. Two hundred microliters of additional slurry per column was packed twice by subsequent centrifugations at 30 × g for 1 min. Column eluates were discarded after each packing centrifugation. After packing, 50 μl of DNA solution was transferred to the top of each column and centrifuged at 30 × g for 1 min to collect the first eluate. Additional eluates were collected after addition of 50 μl of SMQ-purified water to the top of each column, followed by centrifugation at 30 × g for 1 min. Most of the DNA was present in the second, third, and fourth eluates, which were pooled for a total volume of 150 μl. Silica binding, followed by CL-2B spin column purification, was performed twice for each soil sample.
PCR-SSCP.
Each 20-μl PCR mixture consisted of 1× Promega buffer A, 2 mM MgCl2, 50 μM deoxynucleoside triphosphate (Promega, Madison, Wis.), 10 pmol of each primer, 10 μg of nonacetylated bovine serum albumin (Ambion Inc., Austin, Tex.), 1.0 U of Taq polymerase (Promega), and 1 μl of purified soil DNA. Reactions were performed in a Robocycler Gradient 96 Thermocycler (Stratagene) with 1 cycle of 94°C for 1 min and 35 cycles of 94°C for 30s, 55°C for 1.5 min, and 72°C for 1.5 min, followed by 1 cycle of 72°C for 5 min. The crenarchaeal biased primers used for PCR-SSCP were 133FN6F (5′-GCGGATCCGCGGCCGCCTCAGTAACACGTAGTCAACA-3′; modified from reference 45) and 248R5P (5′-GCCATTACCTCACCAACAGC-3′; this study). The 133FN6F primer includes a NotI restriction site and a fluorescent label (6-FAM) attached to the 5′ end. 248R5P is phosphorylated at the 5′ end. PCR products were checked by electrophoresis of 1/10 of the reaction mixture on a 2% agarose gel (38), followed by ethidium bromide staining. PCR negative controls containing SMQ-purified water in place of soil DNA routinely produced no detectable band.
SSCP nondenaturing polyacrylamide gels (1× MDE; BMA, Rockland, Maine) were cast in accordance with the manufacturer's instructions. Glycerol was not added to the MDE gels as it decreased sensitivity by producing broader peaks (data not shown). Sample preparation for SSCP included a fivefold dilution of the PCR with SMQ-purified water, followed by desalting of a 10-μl aliquot of each reaction mixture with Sephadex G50 microspin columns (1) packed in a UniFilter GF/B 800 microplate. After the removal of excess salts, 1 μl of each PCR product was mixed with 1 μl of SSCP loading buffer (60% deionized formamide, 25% ROX GeneFlo 625 standard [ChimerX, Milwaukee, Wis.], 7.5% 100 mM NaOH, 7.5% blue dextran EDTA [blue dextran at 50 mg/ml, EDTA at 50 mM]). Samples were denatured at 94°C for 2 min and then immediately transferred onto ice. The reproducibility of gel profiles (replicates of the same amplification products) was high. Initial experiments used lambda exonuclease (New England Biolabs, Beverly, Mass.) to produce single-stranded products by selective digestion of the 5′ phosphorylated strand produced with primer 248R5P. This digestion step was found to be unnecessary and was discontinued for later samples. Immediate cooling of the denatured PCR products produced enough single-stranded molecules for sufficient detection. Also, the single-stranded molecules detected in this study could be identified without exonuclease digestion since they all migrated more slowly than any double-stranded or heteroduplex molecules. A 0.5-μl aliquot of each sample was spotted onto a membrane comb. The MDE gel was loaded onto an ABI PRISM 377 DNA Sequencer connected to an external cooling water bath. The SSCP gel temperature was maintained at 23°C during the entire 5-h run. The GS RUN 60W CHILLER module was selected in the ABI PRISM 377 collection software to maintain a constant wattage. The peak size (relative migration distance) and peak area (area under the curve) were determined with GeneScan software version 3.1 (Applied Biosystems, Foster City, Calif.). Peak height cutoffs ranged from 5 to 50 relative fluorescence units, depending on the signal intensity. Samples were aligned on the basis of the internal size standard present in each lane.
Statistical analyses.
Data files containing peak size and peak area were exported from GeneScan software. Files were adjusted manually when GeneScan misaligned or incorrectly identified peaks common to multiple electropherograms. Statistical analysis was conducted in SAS (release 8.2; SAS Institute, Cary, N.C.). Principal-component analysis (PCA) and analysis of variance were performed by the PRINCOMP and GLM procedures, respectively.
Clone library construction and screening.
PCR for clone libraries was conducted as described above, except that primers 133F (45) and 1492R (5′-GGYTACCTTGTTACGACTT-3′) (27) were used. PCRs for each sampling location (a total of six) were purified with a QIAquick PCR purification kit (QIAGEN, Valencia, Calif.) and T/A cloned with a pGEM-T Vector System I kit (Promega) in accordance with the manufacturers' instructions. Individual clones were screened via colony PCR with 133FN6F and 248R5P. Reaction conditions were the same as those stated above for environmental templates. PCR products were prepared and separated on MDE gels as described above.
Sequencing and phylogenetic analysis.
Sequencing was accomplished with the ABI Prism BigDye Terminator system. Each clone was sequenced with forward and reverse primers (T7 and SP6) spanning the multiple cloning site to achieve at least twofold coverage over the entire cloned fragment. Areas of ambiguity were resequenced with internal primers 530F (21) and 755R (45) as necessary until a consensus sequence was obtained. Sequences were checked for chimeras with the CHECK_CHIMERA program of the Ribosomal Database Project (7) and by partial treeing as previously described (20). Two putative chimeric sequences were detected and removed from further analysis.
Phylogenetic analysis.
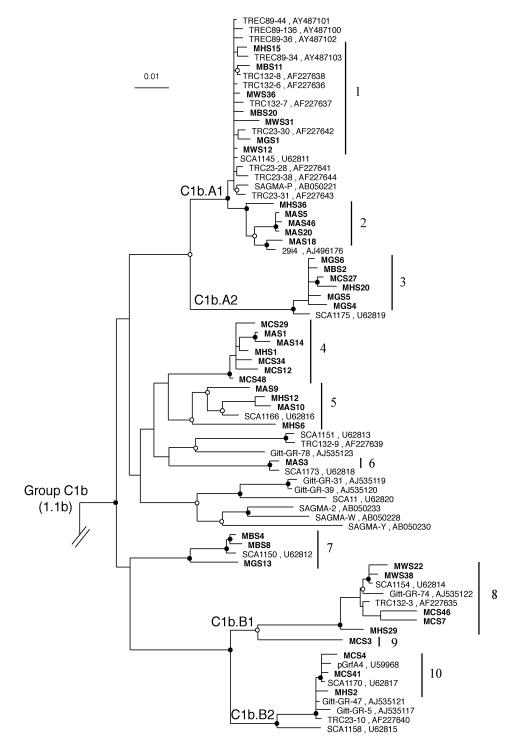
For phylogenetic tree construction, only sequences of >1,300 nt were aligned. The multiple-sequence alignment was refined manually to remove regions of ambiguity, and any columns containing unresolved gaps or missing sequence were removed from the data set used for tree construction. The tree was inferred from 1,228 positions of the aligned sequences by the maximum-likelihood method, FASTDNAMI, within the ARB software environment (http://www.arb-home.de/). Phylogenetic trees were also inferred by using evolutionary distance, ARB neighbor joining (with Olsen correction), and maximum parsimony (DNAPARS from the PHYLIP software package, v. 3.55) (13). Results from these methods were in close agreement. The outgroups used in generating the tree have been omitted from Fig. 8 for clarity. These outgroups included the C1a sequences SAGMA-10 (accession no. AB050240), SAGMA-11 (accession no. AB050241), SAGMA-D (accession no. AB050208), SAGMA-X, (accession no. AB050229), APA3-0 cm (accession no. AF119136), CRA8-11 cm (accession no. AF119127), and Cenarchaeum symbiosum (accession no. U51469); C2 sequence pGrfC26 (accession no. U59986); cultured Crenarchaeota sequences Sulfolobus shibatae (accession no. M32504) and Sulfolobus solfataricus (accession no. D26490); and Euryarchaeota sequences Archaeoglobus fulgidus (accession no. X05567), Halobacterium halobium (accession no. M11583), Methanococcus jannaschii (accession no. U67473), and Methanopyrus kandleri (accession no. M59932).
FIG. 8.
Inferred phylogenetic tree of Crenarchaeota C1b sequences. The clones identified in this study are in boldface. Clades A1, A2, B1, and B2 have been identified previously (45), and the groups numbered 1 to 10 correspond to clone groupings designated in Fig. 9. Bootstrap values (100 resamplings within DNAPARS) for branch positions are indicated as filled circles for strong support (>75% bootstrap value) and as unfilled circles for moderate support (50 to 74% bootstrap values). Branch points without circles are unresolved (<50% bootstrap values). GenBank accession numbers are included after the clone names. The scale bar represents 0.01 change per nucleotide.
Nucleotide sequence accession numbers.
Sequences have been deposited in GenBank under accession numbers AY522861 to AY522902.
RESULTS
PCR-SSCP profiles of six disparate sampling locations.
Following purification by silica binding and Sepharose CL-2B spin column chromatography, greater than 90% of the extracted DNA samples yielded PCR products detectable by agarose gel electrophoresis. A second round of purification was necessary to obtain a sufficiently pure template for the remaining samples. To maintain uniformity, all samples were purified by two rounds of silica binding, followed by Sepharose CL-2B spin column chromatography. After two rounds of purification, every soil sample evaluated in this study produced a 133FN6F-248R5P PCR product of the expected size.
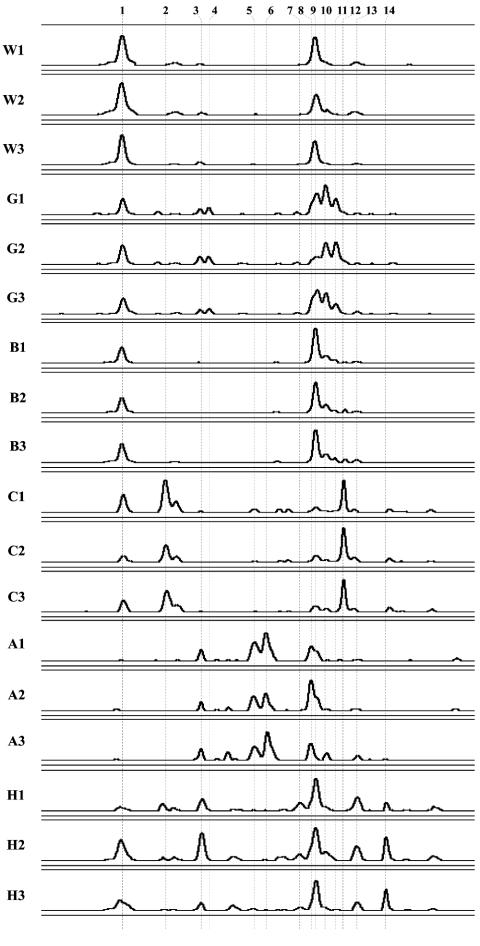
To assess the distribution of crenarchaeal phylotypes in disparate soil ecosystems, four sampling locations (Table 1) in Madison and two others in south central Wisconsin were chosen (Fig. 1). The variability of phylotype richness (number of unique PCR-SSCP peaks) and evenness (relative peak area within an electropherogram) for each soil were estimated from three independent soil samples collected 15 cm apart along a transect (all within 0.3 m). The PCR-SSCP primers used in this study, 133FN6F and 248R5P, span a polymorphic region (positions 133 to 248 of the Escherichia coli numbering) near the 5′ end of the crenarchaeal 16S rDNA. This pair of primers is not specific for all known mesophilic soil crenarchaeal sequences but does match the crenarchaeal sequences previously recovered at the West Madison Agricultural Research Station (3, 45) without mismatches. Each of the six sampling locations produced a distinct PCR-SSCP profile (Fig. 2).
FIG. 2.
PCR-SSCP electropherograms of independent soil samples collected at six locations. Designations: turf, West Madison Agricultural Research Station (W); turf, Walnut St. Research Fields (G); forest, Picnic Point (B); prairie, Curtis prairie (C); agricultural field, Arlington Agricultural Research Station (A); agricultural field, Hancock Agricultural Research Station (H). Three independent soil samples collected 15 cm apart at each location are numbered 1, 2, and 3. For comparisons between samples, individual electropherograms were aligned on the basis of a common internal lane standard. The y axis was adjusted for each electropherogram and represents relative fluorescence intensity, the x axis represents the relative migration distance of the PCR-SSCP DNA fragment. Representative clones for the dominant phylotypes, labeled 1 through 14 across all samples, are MWS38, MCS34, MCS7, MBS11, MCS48, MAS3, MHS15, MAS18, MWS12, MGS4, MGS13, MCS4, MHS2, and MHS12, respectively.
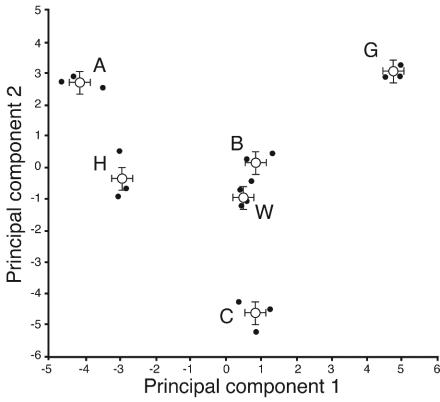
The area under each unique SSCP peak in the data set was calculated from data tables generated by GeneScan software. This information was transformed to a relative peak area for each electropherogram, making possible the direct comparison of independent samples amplified in different PCRs. The transformed data for each electropherogram were organized into a matrix for PCA. The matrix columns represented each unique phylotype present in the data set, and matrix rows designated each soil sample. The numerical variables within the matrix were the calculated relative abundance values for each PCR-SSCP peak. The first principal component (prin1) explained 25.6% of the variability present in the data set, and prin2 explained a further 20.2%. Analysis of variance indicated significant differences (P < 0.0001) for both prin1 and prin2. To determine which locations were distinct, least-significant-difference (LSD) values were calculated. LSD t-test groupings (α = 0.5) supported the hypothesis that each sampling location was significantly different from every other location (Fig. 3).
FIG. 3.
PCA of PCR-SSCP profiles from the following six Wisconsin soil ecosystems: turf, West Madison Agricultural Research Station (W); turf, Walnut St. Research Fields (G); forest, Picnic Point (B); prairie, Curtis prairie (C); agricultural field, Arlington Agricultural Research Station (A); agricultural field, Hancock Agricultural Research Station (H). prin1 (25.6%) and prin2 (20.2%) together explained 45.8% of the variance. The filled circles denote the principal-component values from each sampling location. The mean value for each location is labeled with an open circle. Error bars around the mean value indicate the LSD for prin1 and prin2. Nonoverlapping error bars indicate evidence of a significant difference (LSD t-test groupings at α = 0.5) between sampling locations.
Spatial distribution of crenarchaeotes within one sampling location.
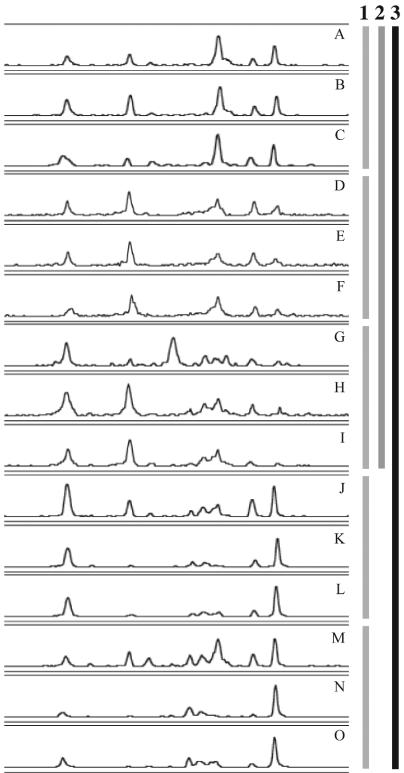
Replicated fallow control plots were sampled in a field experiment (46) at the Hancock Agricultural Research Station (Fig. 4). Soil samples A to I (Fig. 5) were collected at plot 12-4 and were within 30 m2 of each other. Two other plots were sampled in this field, 12-3 (soil samples J to L) and 12-2 (soil samples M to O). All samples were collected within 350 m2. In general, evenness was found to vary more than richness in the samples from this agricultural field, and this variation was not correlated with distance. Samples A to C and D to F produced similar electropherograms within short distances, while samples G to I, J to L, and M to O exhibited more variability within short distances.
FIG. 5.
PCR-SSCP electropherograms from independent soil samples (A through O) collected at different locations within an agricultural field at the Hancock Agricultural Research Station. The y axis was adjusted for each electropherogram and represents relative fluorescence intensity, and the x axis represents relative migration distance. Soil samples A to I, J to L, and M to O were collected in replicated plots 12-4, 12-3, and 12-2, respectively. Profiles sharing marker 1 are along a 0.3-m transect. Profiles sharing marker 2 or 3 are within 30 or 350 m2 of each other, respectively.
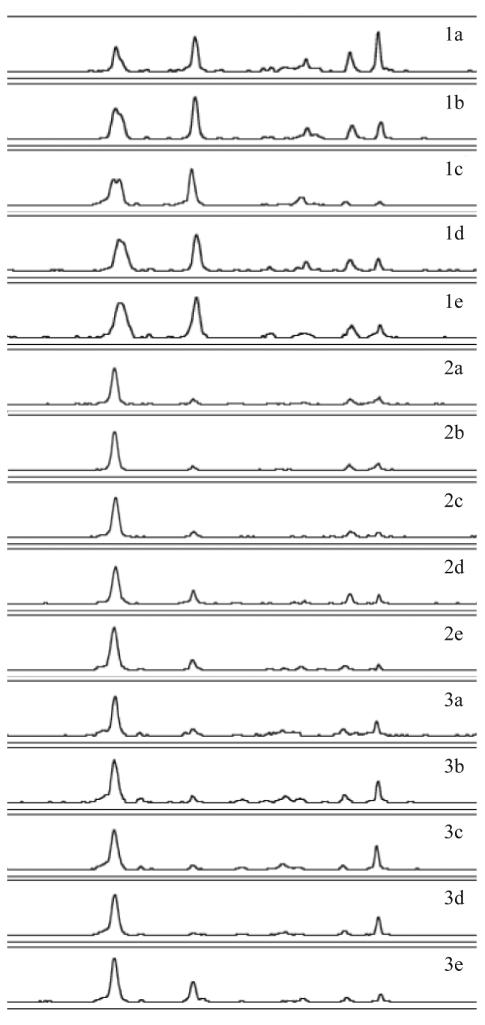
To explore the influence of soil depth on crenarchaeal assemblages, we collected independent soil cores at plots 12-4, 12-3, and 12-2 and sampled 2, 6, 10, 15, and 20 cm below the surface (Fig. 6). Soil cores 1, 2, and 3 were collected from plots 12-4, 12-3, and 12-2, respectively (Fig. 5). There was marked variability between soil cores. Soil core 1 contained a greater percentage of peak 3 (Fig. 2 numbering) than did soil core 2 or 3. In general, there was no reproducible effect of depth on crenarchaeal assemblage. The set of electropherograms for each core appeared more similar to each other than to electropherograms from different cores taken at similar depths. This data set suggests that variation in crenarchaeal assemblages by depth is less pronounced than the variation observed over horizontal distance in this agricultural soil.
FIG. 6.
PCR-SSCP electropherograms from independent soil samples collected at five depths (2, 6, 10, 15, and 20 cm below ground, designated a, b, c, d, and e, respectively). The y axis was adjusted for each electropherogram and represents relative fluorescence intensity, and the x axis represents relative migration distance. Three soil cores, numbered 1, 2, and 3, were collected in replicated agricultural field plots 12-4, 12-3, and 12-2, respectively.
Construction and screening of clone libraries.
Primers 133F and 1492R were used to amplify nearly full-length 16S rDNA sequences. A sample of 222 clones from all libraries was screened for unique SSCP peaks by colony PCR with SSCP primers 133FN6F and 284R5P. PCR products were separated on MDE gels, and 44 clones including representatives from the 14 dominant phylotypes identified in Fig. 2 were sequenced. Two putative chimeric sequences were identified and removed from further analysis. Representative clones for the 14 phylotypes were identified by overlaying PCR-SSCP profiles (soil profiles and clone profiles) with GeneScan software to identify peaks that migrated the same distance through the MDE gel. The clones are as follows (numbers correspond to those in Fig. 2): 1, MWS38; 2, MCS34; 3, MCS7; 4, MBS11; 5, MCS48; 6, MAS3; 7, MHS15; 8, MAS18; 9, MWS12; 10, MGS4; 11, MGS13; 12, MCS4; 13, MHS2; 14, MHS12.
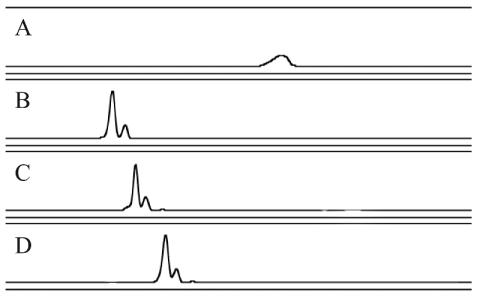
We identified four clones that generated abnormal SSCP profiles (Fig. 7). MHS6 generated a broad peak that may represent a single-stranded secondary structure that is unstable under the conditions used in this study. MCS12, MHS1, and MCS34 generated a doublet consisting of a major SSCP peak followed by a slower-migrating minor peak. Each of these clones produced a characteristic doublet and migrated a unique distance through the gel. This result may indicate two stable single-stranded secondary structures for each clone. These four abnormal SSCP patterns were observed on multiple MDE gels and from multiple PCRs, including a PCR with purified plasmid as the template.
FIG. 7.
PCR-SSCP electropherograms of clones producing aberrant SSCP patterns. Clone MHS6 (A) produced a characteristic broad peak. Clones MCS12 (B), MHS1 (C), and MCS34 (D) produced characteristic doublets. The y axis was adjusted for each electropherogram and represents relative fluorescence intensity, and the x axis represents relative migration distance.
Phylogenetic analysis.
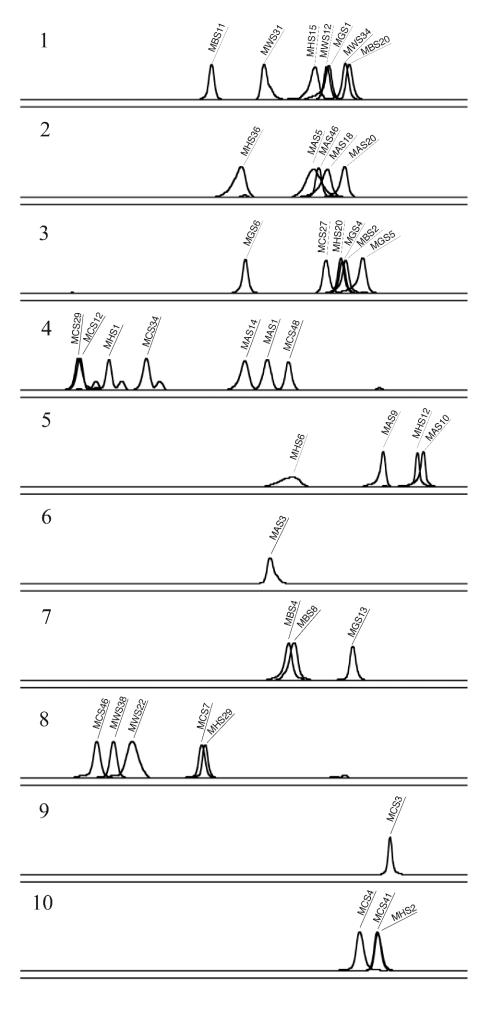
The forty-two sequences identified in this study were all found to group phylogenetically in C1b (Fig. 8). A number of clones grouped within previously identified clades C1b.A1, C1b.A2, C1b.B1, and C1b.B2 (45). Clones MHS15, MBS11, MWS36, MBS20, MWS31, MGS1, MWS12, MHS36, MAS5, MAS46, MAS20, and MAS18 grouped within C1b.A1. Clones MGS6, MBS2, MCS27, MHS20, MGS5, and MGS4 grouped within C1b.A2. Clones MWS22, MWS38, MCS46, and MCS7 grouped within C1b.B1. Clones MHS29 and MCS3 placed as outgroups to C1b.B1 and may represent an extended monophyletic clade C1b.B1. Clones MCS4, MCS41, and MHS2 grouped within C1b.B2. Overall tree topology was confirmed by comparing trees generated by the evolutionary-distance, maximum-parsimony, and maximum-likelihood methods. The three clones producing a PCR-SSCP doublet, MCS12, MHS1, and MCS34, were found to cluster together in the phylogenetic tree, although they did not form a monophyletic clade.
DISCUSSION
To explore crenarchaeal assemblages inhabiting disparate ecosystems, replicated independent soil samples were collected at six locations representing prairie, forest, turf, and agricultural ecosystems. The PCR-SSCP electropherograms from three of these locations, West Madison turf (W), Picnic Point forest (B), and Curtis prairie (C) generated very low within-site variability (Fig. 2), suggesting that crenarchaeal relative diversity is stable within the sampled area at these locations. In general, richness was consistent within each location while evenness varied at some locations, namely, the Hancock Agricultural Research Station (H), Arlington Agricultural Research Station (A), and Walnut St. turf (G) locations. Ordination of prin1 and prin2 showed that each sampling location produced a unique cluster that was significantly different (LSD α = 0.5) from every other cluster (Fig. 3). For the analysis of crenarchaeal PCR-SSCP profiles, we avoided calculated diversity indices as they have been reported to produce inaccurate estimates for samples containing low species numbers. For a review of the suitability of ecological diversity indices applied to molecular soil microbiology, see reference 18.
The effects of a number of different variables on crenarchaeal assemblages were considered in this data set. First, comparisons between two turf sites and between two agricultural sites revealed different PCR-SSCP profiles, suggesting that macroscopic habitat descriptions are not predictive of the crenarchaeal assemblage inhabiting the soil. Furthermore, the two most similar sets of profiles, turf at West Madison (W) and forest at Picnic Point (B), represent different ecosystems yet group by PCA more closely than the two turf locations (W and G). Second, soil classification could not predict the similarity of crenarchaeal assemblages. The replicated soils, Typic Haplaquolls (G and C) and Typic Argiudolls (W and A), did not form distinct clusters in PCA. Finally, the spatial distance between these sampling locations does not predict the similarity of crenarchaeal assemblages. The two closest sites, B and G (0.8 km apart), were less similar than B and W (5.7 km apart). Of the variables considered, the best predictor of crenarchaeal assemblage was found to be small-scale distance (within 0.3 m). That is, soil samples collected within 0.3 m provide the best prediction of the crenarchaeal assemblage profile for an unknown soil sample.
To explore the spatial variation within a single uniform ecosystem, soil samples were collected from plots within an agricultural field at the Hancock Agricultural Research Station. The soil type, Plainfield sand (Typic Udipsamment), was consistent throughout all of the plots, and the plots were treated identically (46). These samples revealed a heterogeneous distribution of phylotypes that was not correlated with horizontal distance. Of the five sets of samples collected along a 0.3-m transect, only two exhibited nearly identical profiles, A to C and D to F (Fig. 5). The other three sets of 0.3-m samples, G to I, J to L, and M to O, showed greater changes in phylotype evenness. Two of the soil samples collected the farthest apart, J and M, were more similar to each other (in both richness and evenness) than to the samples closest to them, samples K and L and samples N and O, respectively. In addition, no reproducible effect of depth on crenarchaeal assemblage was detected (Fig. 6). Although some variability among these agricultural soil samples (horizontal and depth samples) was observed, in general, the Hancock electropherograms (Fig. 5 and 6) appeared more similar to each other than to any of the electropherograms from the other sampling locations (Fig. 2).
The Hancock soil data suggest that individual crenarchaeal phylotypes are able to dominate undefined patches of soil throughout this uniform agricultural field. The result is a mosaic distribution of patches inhabited by different dominant crenarchaeal phylotypes. No single variable considered in this study could sufficiently explain the observed differences between electropherograms. The diversity of crenarchaeotes within a single soil sample may thus be the result of a complex interaction of environmental and biological factors. For instance, soil type alone may not be the primary determinant of crenarchaeal diversity, but it may be an important factor when combined with the presence of a specific bacterial clade. In future experiments, PCR-SSCP profiling would be a suitable tool to estimate the influence of different environmental factors on crenarchaeal diversity by providing the means to rapidly screen permutations of many environmental conditions.
Six 16S rDNA clone libraries were generated to survey the crenarchaeal sequences present at each sampling site and to identify individual clones corresponding to the dominant phylotypes present in the soil samples. To include longer sequences for phylogenetic tree construction, the libraries were generated with primers 133FN6F and 1492R (∼1,320 nt amplified) and then screened by PCR-SSCP (133FN6F and 248R5P, ∼115 nt amplified) to identify unique phylotypes. Most of the 16S rDNA clones sequenced (38 of 42) generated an SSCP profile consisting of a single sharp peak (Fig. 7 and 9), suggesting that this region of the crenarchaeal 16S rDNA often forms stable single-stranded molecules and is well suited for PCR-SSCP. However, grouping of the PCR-SSCP profiles by phylogeny (Fig. 9) reveals that most peaks cannot be matched to distinct phylogenetic clades. Cloned sequences grouping together within the phylogenetic tree did not always form distinct clusters of PCR-SSCP peaks. Some phylogenetic clades can be distinguished from each other, i.e., C1b.B1 and C1b.B2, but most groupings cannot be distinguished, i.e., C1b.A1 and C1b.A2.
FIG. 9.
Individual PCR-SSCP profiles of 42 clones grouped according to phylogenetic placement. Groups 1 to 10 are identified in Fig. 8. The y axis was adjusted for each electropherogram and represents relative fluorescence intensity, and the x axis represents relative migration distance.
This study exemplifies the importance of collecting replicated samples in the study of mesophilic soil Crenarchaeota. Pooling multiple samples provides a means to limit misrepresentation of the diversity in environmental samples, but to be effective, the pooling strategy should be based on an understanding of the underlying variability. For instance, a single pooled soil sample composed of A and B (Fig. 5) would produce a much different estimate of crenarchaeal diversity within a Hancock Agricultural Research Station field than a pooled sample of N and O. The importance of replicated sampling is further exemplified by the data from the soil depth profiles (Fig. 6). Individual cores did produce differences in crenarchaeal assemblages according to depth. For instance, soil core sample 3e contains a slightly higher relative proportion of phylotype 3 (Fig. 2 numbering) at 20 cm below the surface. Individually, this result could be interpreted as preferential subsurface colonization of this phylotype, but comparison to soil core 1, samples 1a to 1e, reveals that this phylotype can be a dominant member at all of the depths sampled. These results highlight the importance of replicated sampling to distinguish the aberrant chance event from a true representation of the microbial community in the environment.
In conclusion, characterizing many independent samples allows the preservation of environmental variability, which may provide insights into the ecological significance of crenarchaeotes. Without adequate sampling, meaningful biological variation may be obscured. The results described in this paper provide a basis for designing sampling strategies to test hypotheses about crenarchaeal diversity in mesophilic soils. For instance, to determine whether crenarchaeal assemblages in the rhizosphere are distinct from bulk soil in native environments, many samples at different locations would be necessary to account for variation between sampling sites.
Acknowledgments
This work was supported by the Storkan-Hanes Foundation, Novartis AG, and the McKnight Foundation.
We thank Dick Wolkowski for soil classifications, the University of Wisconsin Biotech Center for sharing expertise with the ABI 377, Bret Larget and Teri Balser for statistical consultations, and Holly Simon and two anonymous reviewers for comments on an early draft. Holly Simon is also thanked for providing unpublished data.
REFERENCES
- 1.Ausubel, F. M., R. Brent, R. E. Kingston, R. E. Moore, J. G. Seidman, J. A. Smith, and K. Struhl (ed.). 2003. Current protocols in molecular biology, vol. 1. John Wiley & Sons, Inc., New York, N.Y.
- 2.Beaulieu, M., V. Becaert, L. Deschenes, and R. Villemur. 2000. Evolution of bacterial diversity during enrichment of PCP-degrading activated soils. Microb. Ecol. 40:345-355. [DOI] [PubMed] [Google Scholar]
- 3.Bintrim, S. B., T. J. Donahue, J. Handelsman, G. P. Roberts, and R. M. Goodman. 1997. Molecular phylogeny of archaea from soil. Proc. Natl. Acad. Sci. USA 94:277-282. [DOI] [PMC free article] [PubMed] [Google Scholar]
- 4.Borneman, J., and E. W. Triplett. 1997. Molecular microbial diversity in soils from eastern Amazonia: evidence for unusual microorganisms and microbial population shifts associated with deforestation. Appl. Environ. Microbiol. 63:2647-2653. [DOI] [PMC free article] [PubMed] [Google Scholar]
- 5.Buckley, D. H., J. R. Graber, and T. M. Schmidt. 1998. Phylogenetic analysis of nonthermophilic members of the kingdom Crenarchaeota and their diversity and abundance in Soils. Appl. Environ. Microbiol. 64:4333-4339. [DOI] [PMC free article] [PubMed] [Google Scholar]
- 6.Chin, K. J., T. Lukow, and R. Conrad. 1999. Effect of temperature on structure and function of the methanogenic archaeal community in an anoxic rice field soil. Appl. Environ. Microbiol. 65:2341-2349. [DOI] [PMC free article] [PubMed] [Google Scholar]
- 7.Cole, J. R., B. Chai, T. L. Marsh, R. J. Farris, Q. Wang, S. A. Kulam, S. Chandra, D. M. McGarrell, T. M. Schmidt, G. M. Garrity, and J. M. Tiedje. 2003. The Ribosomal Database Project (RDP-II): previewing a new autoaligner that allows regular updates and the new prokaryotic taxonomy. Nucleic Acids Res. 31:442-443. [DOI] [PMC free article] [PubMed] [Google Scholar]
- 8.Crump, B. C., and J. A. Baross. 2000. Archaeaplankton in the Columbia River, its estuary and adjacent coastal ocean, USA. FEMS Microbiol. Ecol. 31:231-239. [DOI] [PubMed] [Google Scholar]
- 9.Delong, E. F. 1998. Everything in moderation: Archaea as ‘non-extremophiles’. Curr. Opinion Genet. Dev. 8:649-654. [DOI] [PubMed] [Google Scholar]
- 10.Delong, E. F., and N. R. Pace. 2001. Environmental diversity of Bacteria and Archaea. Syst. Biol. 50:470-478. [PubMed] [Google Scholar]
- 11.Dunbar, J., L. O. Ticknor, and C. R. Kuske. 2000. Assessment of microbial diversity in four southwestern United States soils by 16S rRNA gene terminal restriction fragment analysis. Appl. Environ. Microbiol. 66:2943-2950. [DOI] [PMC free article] [PubMed] [Google Scholar]
- 12.Farrelly, V., F. A. Rainey, and E. Stackebrandt. 1995. Effect of genome size and rrn gene copy number on PCR amplification of 16S ribosomal-RNA genes from a mixture of bacterial species. Appl. Environ. Microbiol. 61:2798-2801. [DOI] [PMC free article] [PubMed] [Google Scholar]
- 13.Felsenstein, J. 1993. PHYLIP (phylogeny inference package), 3.55 ed. Department of Genetics, University of Washington, Seattle.
- 14.Friedrich, M. W., D. Schmitt-Wagner, T. Lueders, and A. Brune. 2001. Axial differences in community structure of Crenarchaeota and Euryarchaeota in the highly compartmentalized gut of the soil-feeding termite Cubitermes orthognathus. Appl. Environ. Microbiol. 67:4880-4890. [DOI] [PMC free article] [PubMed] [Google Scholar]
- 15.Furlong, M. A., D. R. Singleton, D. C. Coleman, and W. B. Whitman. 2002. Molecular and culture-based analyses of prokaryotic communities from an agricultural soil and the burrows and casts of the earthworm Lumbricus rubellus. Appl. Environ. Microbiol. 68:1265-1279. [DOI] [PMC free article] [PubMed] [Google Scholar]
- 16.Hayashi, K., and D. W. Yandell. 1993. How sensitive is PCR-SSCP? Hum. Mutat. 2:338-346. [DOI] [PubMed] [Google Scholar]
- 17.Hershberger, K. L., S. M. Barns, A.-L. Reysenbach, S. C. Dawson, and N. R. Pace. 1996. Wide diversity of Crenarchaeota. Nature 384:420. [DOI] [PubMed] [Google Scholar]
- 18.Hill, T. C. J., K. A. Walsh, J. A. Harris, and B. F. Moffett. 2003. Using ecological diversity measures with bacterial communities. FEMS Microbiol. Ecol. 43:1-11. [DOI] [PubMed] [Google Scholar]
- 19.Hugenholtz, P., B. M. Goebel, and N. R. Pace. 1998. Impact of culture-independent studies on the emerging phylogenetic view of bacterial diversity. J. Bacteriol. 180:4765-4774. [DOI] [PMC free article] [PubMed] [Google Scholar]
- 20.Hugenholtz, P., and T. Huber. 2003. Chimeric 16S rDNA sequences of diverse origin are accumulating in the public databases. Int. J. Syst. Evol. Microbiol. 53:289-293. [DOI] [PubMed] [Google Scholar]
- 21.Lane, D. J., B. Pace, G. J. Olsen, D. A. Stahl, M. L. Sogin, and N. R. Pace. 1985. Rapid determination of 16S ribosomal-RNA sequences for phylogenetic analyses. Proc. Natl. Acad. Sci. USA 82:6955-6959. [DOI] [PMC free article] [PubMed] [Google Scholar]
- 22.Lee, D. H., S. A. Noh, and C. K. Kim. 2000. Development of molecular biological methods to analyze bacterial species diversity in freshwater and soil ecosystems. J. Microbiol. 38:11-17. [Google Scholar]
- 23.Lee, D.-H., Y.-G. Zo, and S.-J. Kim. 1996. Nonradioactive method to study genetic profiles of natural bacterial communities by PCR-single-strand-conformation polymorphism. Appl. Environ. Microbiol. 62:3112-3120. [DOI] [PMC free article] [PubMed] [Google Scholar]
- 24.Liu, W. T., T. Marsh, H. Cheng, and L. J. Forney. 1997. Characterization of microbial diversity by determining terminal restriction fragment length polymorphisms of genes encoding 16S rRNA. Appl. Environ. Microbiol. 63:4516-4522. [DOI] [PMC free article] [PubMed] [Google Scholar]
- 25.Lueders, T., and M. W. Friedrich. 2000. Archaeal population dynamics during sequential reduction processes in rice field soil. Appl. Environ. Microbiol. 66:2732-2742. [DOI] [PMC free article] [PubMed] [Google Scholar]
- 26.Lueders, T., and M. W. Friedrich. 2003. Evaluation of PCR amplification bias by terminal restriction fragment length polymorphism analysis of small-subunit rRNA and mcrA genes by using defined template mixtures of methanogenic pure cultures and soil DNA extracts. Appl. Environ. Microbiol. 69:320-326. [DOI] [PMC free article] [PubMed] [Google Scholar]
- 27.Medlin, L., H. J. Elwood, S. Stickel, and M. L. Sogin. 1988. The characterization of enzymatically amplified eukaryotic 16S-like rRNA-coding regions. Gene 71:491-499. [DOI] [PubMed] [Google Scholar]
- 28.Muyzer, G., E. de Wall, and A. Uitterlinden. 1993. Profiling of complex microbial populations by DGGE of PCR-amplified genes coding for 16S rRNA. Appl. Environ. Microbiol. 59:695-700. [DOI] [PMC free article] [PubMed] [Google Scholar]
- 29.Muyzer, G., and K. Smalla. 1998. Application of denaturing gradient gel electrophoresis (DGGE) and temperature gradient gel electrophoresis (TGGE) in microbial ecology. Antonie van Leeuwenhoek 73:127-141. [DOI] [PubMed] [Google Scholar]
- 30.Nicol, G. W., L. A. Glover, and J. I. Prosser. 2003. The impact of grassland management on archaeal community structure in upland pasture rhizosphere soil. Environ. Microbiol. 5:152-162. [DOI] [PubMed] [Google Scholar]
- 31.Ochsenreiter, T., D. Selezi, A. Quaiser, L. Bonch-Osmolovskaya, and C. Schleper. 2003. Diversity and abundance of Crenarchaeota in terrestrial habitats studied by 16S RNA surveys and real-time PCR. Environ. Microbiol. 5:787-797. [DOI] [PubMed] [Google Scholar]
- 32.Pace, N. R. 1997. A molecular view of microbial biodiversity and the biosphere. Science 276:734-740. [DOI] [PubMed] [Google Scholar]
- 33.Pesaro, M., and F. Widmer. 2002. Identification of novel Crenarchaeota and Euryarchaeota clusters associated with different depth layers of a forest soil. FEMS Microbiol. Ecol. 42:89-98. [DOI] [PubMed] [Google Scholar]
- 34.Peters, S., S. Koschinsky, F. Schwieger, and C. C. Tebbe. 2000. Succession of microbial communities during hot composting as detected by PCR-single-strand-conformation polymorphism-based genetic profiles of small-subunit rRNA genes. Appl. Environ. Microbiol. 66:930-936. [DOI] [PMC free article] [PubMed] [Google Scholar]
- 35.Polz, M. F., and C. M. Cavanaugh. 1998. Bias in template-to-product ratios in multitemplate PCR. Appl. Environ. Microbiol. 64:3724-3730. [DOI] [PMC free article] [PubMed] [Google Scholar]
- 36.Quaiser, A., T. Ochsenreiter, H. P. Klenk, A. Kletzin, A. H. Treusch, G. Meurer, J. Eck, C. W. Sensen, and C. Schleper. 2002. First insight into the genome of an uncultivated crenarchaeote from soil. Environ. Microbiol. 4:603-611. [DOI] [PubMed] [Google Scholar]
- 37.Ramakrishnan, B., T. Lueders, P. F. Dunfield, R. Conrad, and M. W. Friedrich. 2001. Archaeal community structures in rice soils from different geographical regions before and after initiation of methane production. FEMS Microbiol. Ecol. 37:175-186. [Google Scholar]
- 38.Sambrook, J., E. F. Fritsch, and T. Maniatis. 1989. Molecular cloning: a laboratory manual, 2nd ed. Cold Spring Harbor Laboratory Press, Cold Spring Harbor, N.Y.
- 39.Sandaa, R.-A., Ø. Enger, and V. Torsvik. 1999. Abundance and diversity of Archaea in heavy-metal-contaminated soils. Appl. Environ. Microbiol. 65:3293-3297. [DOI] [PMC free article] [PubMed] [Google Scholar]
- 40.Schmalenberger, A., F. Schwieger, and C. C. Tebbe. 2001. Effect of primers hybridizing to different evolutionarily conserved regions of the small-subunit rRNA gene in PCR-based microbial community analyses and genetic profiling. Appl. Environ. Microbiol. 67:3557-3563. [DOI] [PMC free article] [PubMed] [Google Scholar]
- 41.Schmalenberger, A., and C. C. Tebbe. 2003. Bacterial diversity in maize rhizospheres: conclusions on the use of genetic profiles based on PCR-amplified partial small subunit rRNA genes in ecological studies. Mol. Ecol. 12:251-261. [DOI] [PubMed] [Google Scholar]
- 42.Schwieger, F., and C. C. Tebbe. 2000. Effect of field inoculation with Sinorhizobium meliloti L33 on the composition of bacterial communities in rhizospheres of a target plant (Medicago sativa) and a non-target plant (Chenopodium album)—linking of 16S rRNA gene-based single-strand conformation polymorphism community profiles to the diversity of cultivated bacteria. Appl. Environ. Microbiol. 66:3556-3565. [DOI] [PMC free article] [PubMed] [Google Scholar]
- 43.Schwieger, F., and C. C. Tebbe. 1998. A new approach to utilize PCR-single-strand-conformation polymorphism for 16S rRNA gene-based microbial community analysis. Appl. Environ. Microbiol. 64:4870-4876. [DOI] [PMC free article] [PubMed] [Google Scholar]
- 44.Sheffield, V. C., J. S. Beck, A. E. Kwitek, D. W. Sandstrom, and E. M. Stone. 1993. The sensitivity of single-strand conformation polymorphism analysis for the detection of single base substitutions. Genomics 16:325-332. [DOI] [PubMed] [Google Scholar]
- 45.Simon, H. M., J. A. Dodsworth, and R. M. Goodman. 2000. Crenarchaeota colonize terrestrial plant roots. Environ. Microbiol. 2:495-505. [DOI] [PubMed] [Google Scholar]
- 46.Stone, A. G., G. E. Vallad, L. R. Cooperband, D. Rotenberg, H. M. Darby, R. V. James, W. R. Stevenson, and R. M. Goodman. 2003. Effect of organic amendments on soil-borne and foliar diseases in field-grown snap bean and cucumber. Plant Dis. 87:1037-1042 [DOI] [PubMed] [Google Scholar]
- 47.Sunnucks, P., A. C. C. Wilson, L. B. Beheregaray, K. Zenger, J. French, and A. C. Taylor. 2000. SSCP is not so difficult: the application and utility of single-stranded conformation polymorphism in evolutionary biology and molecular ecology. Mol. Ecol. 9:1699-1710. [DOI] [PubMed] [Google Scholar]
- 48.Suzuki, M., M. S. Rappe, and S. J. Giovannoni. 1998. Kinetic bias in estimates of coastal picoplankton community structure obtained by measurements of small-subunit rRNA gene PCR amplicon length heterogeneity. Appl. Environ. Microbiol. 64:4522-4529. [DOI] [PMC free article] [PubMed] [Google Scholar]
- 49.Suzuki, M. T., and S. J. Giovannoni. 1996. Bias caused by template annealing in the amplification of mixtures of 16S rRNA genes by PCR. Appl. Environ. Microbiol. 62:625-630. [DOI] [PMC free article] [PubMed] [Google Scholar]
- 50.Takai, K., D. P. Moser, M. DeFlaun, T. C. Onstott, and J. K. Fredrickson. 2001. Archaeal diversity in waters from deep South African gold mines. Appl. Environ. Microbiol. 67:5750-5760. [DOI] [PMC free article] [PubMed] [Google Scholar]
- 51.Tebbe, C. C., A. Schmalenberger, S. Peters, and F. Schwieger. 2001. Single-strand conformation polymorphism (SSCP) for microbial community analysis, p. 161-175. In P. A. Rochelle (ed.), Environmental molecular microbiology: protocols and applications. Horizon Scientific Press, Wymondham, United Kingdom.
- 52.Torsvik, V., L. Ovreas, and T. F. Thingstad. 2002. Prokaryotic diversity—magnitude, dynamics, and controlling factors. Science 296:1064-1066. [DOI] [PubMed] [Google Scholar]
- 53.Ueda, T., Y. Suga, and T. Matsuguchi. 1995. Molecular phylogenetic analysis of a soil microbial community in a soybean field. Eur. J. Soil Sci. 46:415-421. [Google Scholar]
- 54.Volossiouk, T., J. E. Robb, and R. N. Nazar. 1995. Direct DNA extraction for PCR-mediated assays of soil organisms. Appl. Environ. Microbiol. 61:3972-3976. [DOI] [PMC free article] [PubMed] [Google Scholar]
- 55.Weber, S., T. Lueders, M. W. Friedrich, and R. Conrad. 2001. Methanogenic populations involved in the degradation of rice straw in anoxic paddy soil. FEMS Microbiol. Ecol. 38:11-20. [Google Scholar]
- 56.Wieland, G., R. Neumann, and H. Backhaus. 2001. Variation of microbial communities in soil, rhizosphere, and rhizoplane in response to crop species, soil type, and crop development. Appl. Environ. Microbiol. 67:5849-5854. [DOI] [PMC free article] [PubMed] [Google Scholar]
- 57.Yakimov, M. M., L. Giuliano, K. N. Timmis, and P. N. Golyshin. 2001. Upstream-independent ribosomal RNA amplification analysis (URA): a new approach to characterizing the diversity of natural microbial communities. Environ. Microbiol. 3:662-666. [DOI] [PubMed] [Google Scholar]
- 58.Zumstein, E., R. Moletta, and J. J. Godon. 2000. Examination of two years of community dynamics in an anaerobic bioreactor with fluorescence polymerase chain reaction (PCR) single-strand conformation polymorphism analysis. Environ. Microbiol. 2:69-78. [DOI] [PubMed] [Google Scholar]


