Abstract
The ability to delineate atherosclerotic plaque from the surrounding tissue using custom-developed subharmonic imaging (SHI) digital filtering techniques was investigated in vivo using a commercially available system. Atherosclerosis was induced in the aorta of two Watanabe Heritable Hyperlipidemic rabbits following which injections of an ultrasound contrast agent (UCA) Definity (Lantheus Medical Imaging, N Billerica, Massachusetts) were administered. Imaging was performed using a Galaxy intravascular ultrasound (IVUS) scanner (Boston Scientific, Natick, Massachusetts) equipped with an Atlantis® SR Pro Imaging Catheter (Boston Scientific). Four preliminary band-pass filters were designed to isolate the subharmonic signal (from surrounding tissue) and applied to the radio-frequency (RF) data. Preliminary filter performances were compared in terms of vessel-tissue contrast-to-tissue ratio (CTR) and visual examination. Based on preliminary results, a subharmonic adaptive filter and a stopband (SB) filter were designed and applied to the RF data. Images were classified as fundamental, SHI, and SB. Four readers performed qualitative analysis of 168 randomly selected images (across all three imaging modes). The images were scored for overall image quality, image noise, plaque visualization, and vessel lumen visualization. A Wilcoxon signed-rank test was used to compare the scores followed by intraclass correlation (ICC) evaluation. Quantitative analysis was performed by calculating the CTRs for the vessel-to-plaque and vessel-to-tissue (compared using a paired student’s t test). Qualitative analysis showed SHI and SB to have significantly less image noise relative to the fundamental mode (p < 0.001). Fundamental mode scored significantly higher than SHI and SB for the remaining three categories. ICC showed mixed results among reader evaluation for delineation of plaque. However, quantitatively, SHI produced the best vessel-plaque CTR.
Keywords: subharmonic imaging, intravascular ultrasound, ultrasound contrast agent
Introduction
Atherosclerosis is the result of a complex interaction between blood elements, disturbed flow, and vessel-wall abnormalities involving several pathological processes.1 Atherosclerotic plaque composition can be broken down into a soft lipid-rich atheromatous component and a hard collagen-rich sclerotic tissue. The sclerotic component (primarily fibrous tissue) is relatively harmless, because the fibrous tissue appears to stabilize and protect it against disruption. However, the soft atheromatous component is unstable and prone to rupture.1 Plaques containing a soft atheromatous core are unstable and capable of rupturing, causing the fibrous cap (sclerotic, which separates the core from the lumen) to separate and disintegrate, exposing the thrombogenic atheromatous component to the blood flow, eventually leading to thrombosis or acute coronary syndrome.1 More than 1 million Americans experience an acute coronary syndrome annually, and this number is on the rise.2,3
X-ray angiography has been accepted as a poor predictor of plaque rupture. This is because the plaque vulnerability is related to its composition and not to its size.4 Intravascular ultrasound (IVUS) has been widely accepted as the preferred imaging modality for studying atherosclerosis due to its ability to provide real-time cross-sectional visualization of blood vessels at high resolution (100–150 μm).4–12 Characterizing vascular tissue and plaque composition can aid clinical decision making about the type of interventional procedure and subsequent pharmaceutical administration.13 Several groups are actively developing IVUS techniques for characterizing the mechanical and acoustic properties of vascular tissue in vivo.4,14 Spencer et al.13 were able to use IVUS to perform spectral analysis of backscattered radio-frequency (RF) data for characterization of tissue subtypes within atherosclerotic plaque in vitro. Spectral parameters such as maximum power (dB), frequency at maximum power (MHz), y-axis intercept of spectral slope (dB), and so on were calculated for known areas of tissue composition, and significant discrimination between the different compositions for spectral slope and y-axis intercept of spectral slope was found.13 Nair et al.14 were able to use similar spectral parameters to produce an automated tissue map for plaque characterization. Watson et al.15 used Spencer’s13 work and were able to produce up to 83% correct classification of plaque tissue regions. To characterize atherosclerotic plaque, delineation from surrounding tissue is required. Nonlinear ultrasound imaging using ultrasound contrast agents (UCAs) at high transmit frequencies (i.e. >20 MHz) is capable of providing the necessary resolution (<200) μm to visualize this delineation.
Under sufficient acoustic excitation, UCAs are able to act as nonlinear scatters, producing a wide range of frequency components (harmonics, subharmonics and ultraharmonics) in the received spectra.16,17 Harmonic imaging (HI) is an established contrast specific imaging mode that improves the visualization of blood flow by transmitting at a fundamental frequency (f0) and receiving at the second harmonic (2f0).18–20 Although HI manages to reduce the background signal from surrounding structures, some second harmonic signals from the tissue reduce the contrast-to-tissue contrast ratio.21,22 Subharmonic imaging (SHI) is an alternate contrast specific imaging mode. In SHI, only echoes at the subharmonic frequency (f0/2) are received.23 This is an attractive alternative owing to the lack of subharmonic generation in tissue and therefore better contrast-to-tissue ratio (CTR).21 Several groups, including ours, have conducted in vitro and in vivo studies that demonstrate the feasibility of SHI.21,23–28
In this study we investigated the ability to isolate the nonlinear acoustic response (subharmonic component) of a commercial UCA, Definity (Lantheus Medical Imaging, N Billerica, Massachusetts), using custom-developed SHI and stopband (SB) filters after imaging on a standard commercially available IVUS scanner (Galaxy, Boston Scientific/Scimed, Natick, Massachusetts). Our overall goal was to determine whether the SHI filtering techniques provided superior delineation of plaque relative to fundamental imaging.
Method
Animal Preparation
Atherosclerosis was induced in two Watanabe Heritable Hyperlipidemic (WHHL) rabbits (2.5 months old, weight 1.5 kg) using a combination of high cholesterol diet (2% Cholesterol Research Diets, New Brunswick, New Jersey) and balloon de-endothelization. The rabbits were maintained on the high cholesterol diet for a two-week period after which their arterial wall was injured (from the femoral artery to the iliac bifurcation) with a 4 F Fogarty catheter. The rabbits continued to be maintained on the diet for about six weeks post injury (allowing for sufficient buildup of atherosclerotic plaque). Prior to ultrasound imaging, the rabbits were sedated with ketamine and xylazine, and a sheath was introduced in the carotid artery to facilitate echo imaging. All animal experiments were performed at Dartmouth Medical School in accordance with the guidelines of the college’s Institutional Animal Care and Use Committee.
Imaging Setup
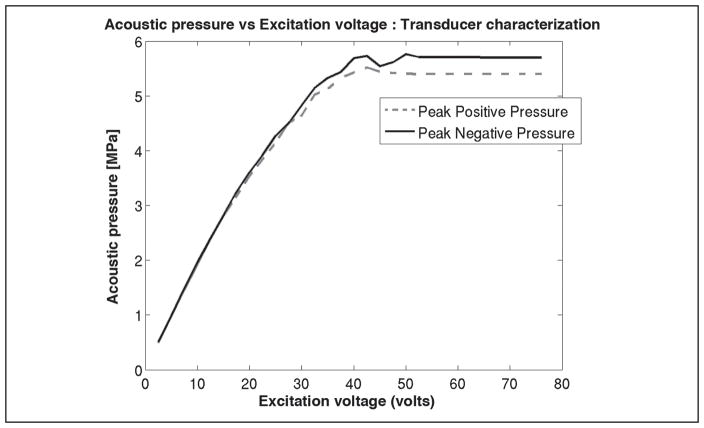
All ultrasound imaging was performed using a commercially available IVUS system, Galaxy™ (Boston Scientific/Scimed), which was equipped with a rotating element Atlantis® SR Pro Imaging Catheter (Boston Scientific). The scanner allowed control of transmit cycles (2 or 4) and acoustic pressure (as a function of excitation voltage). The acoustic pressure output from the transducer was measured as a function of excitation voltage (Figure 1). The manufacturer details about the transducer frequency characteristics showed a center frequency of 41.02 MHz and a −6-dB bandwidth of 20 MHz. In this study, all imaging was performed using two transmit cycles and a 76-V excitation voltage (approximately 5.6 MPa peak negative pressure), the default scanner settings. The scanner had an external interface that provided direct access to the RF data. A modified PCI bus data acquisition card (Compuscope 14200- 1 GB 14-bit 400 MS/s, Gage Applied, Lockport IL) was used to stream sequences (approximately 40 seconds) of RF echo frames from the IVUS scanner at a rate of 30 frames per second (fps) to a PC for offline analysis. All RF echo frames were digitized to 12 bits at a sampling frequency of 400 MHz, with each digitized echo frame containing 256 RF A-lines consisting of 2048 sampling points per line.
Figure 1.
Transducer characterization of acoustic pressure as a function of excitation voltage.
Data Acquisition
The IVUS catheter was introduced via the femoral artery into the aorta pointing in the proximal direction. Activated Definity (Lantheus Medical Imaging) was diluted by a factor of 1000 (i.e., 8 × 10⁶ microspheres per mL) with 0.9% saline, and then injected in 2 to 3 mL volumes over a 30-second period. A total of seven injections were administered between the two rabbits. An interval of 20 minutes was allowed between injections to allow for complete wash-out of UCA and to limit cardiopulmonary stress on the animal. The data acquisition was started prior to injection of UCA and continued through contrast wash-out. A total of 2151 echo frames were collected from the seven injections at different cross-sections along the aorta. Acquired RF data were transferred from the scanner to a desktop PC for offline processing.
Image Processing
Log-compressed fundamental grayscale images were generated from the full bandwidth of the RF data with a 50-dB dynamic range. The dynamic range of 50 dB was selected from a range of 40 to 90 dB by a subjective observer for optimum viewing of the fundamental grayscale images and maintained constant for the other imaging modes. All image processing was performed using custom programs developed in MATLAB (R2010a, The Mathworks, Inc., Natick, Massachusetts).
Filter Design and Implementation
To optimize SHI, various digital filters were designed and tested for their ability to suppress tissue signals and simultaneously preserve the subharmonic signals from the UCA. These filters were evaluated based on the CTR performance metric defined as,29
| (1) |
where μt and μv represent the mean backscatter signal strength in the tissue and within the vessel lumen region, respectively; and represent the variance in the respective regions calculated based on region-of-interest (ROI) selections. Preliminary filters tested were as follows:
fourth-order Butterworth band-pass filter with −3 dB cut-offs at 12 MHz and 28 MHz, 13-dB suppression around 40 MHz (BP1)
fourth-order Butterworth band-pass filter with −3 dB cut-offs at 15 MHz and 30 MHz, 12-dB suppression around 40 MHz (BP2)
eighth-order Butterworth band-pass filter with −3 dB cut-offs at 15 MHz and 30 MHz, 23-dB suppression around 40 MHz (BP)
eighth-order Butterworth band-pass filter with −3 dB cut-offs at 16.7 MHz and 24.9 MHz, 45-dB suppression around 40 MHz (BP4)
Preliminary filters were evaluated on vessel-to-tissue CTRs along with visual examination for image noise, plaque visualization, and vessel lumen visualization. The performance of the preliminary filters were used to optimize/select the design parameters for the final filter design. Based on the preliminary filter results, a subharmonic adaptive filter algorithm was developed to identify the subharmonic component in the RF signal of a chosen ROI and develop a bandpass filter centered around this selection. This was performed on a frame-by-frame basis (due to variability noticed in the RF spectrum between frames). First, individual RF A-lines were extracted from each echo frame. The subharmonic adaptive filter algorithm located all signal peaks on each RF A-line in the vicinity of the subharmonic frequency (20 MHz) component. The subharmonic peak was selected from the set of peaks through a series of iterations following which a fourth-order Butterworth band-pass filter was created centered around this selection with a −3dB bandwidth of 10 MHz. This band-pass filter was then applied to the data corresponding to the analyzed RF A-line. The above steps were repeated for all 256 A-lines per frame across all echo frames. Once all frames were filtered, log-compressed IVUS images were generated and were categorized as subharmonic images (SHI).
Another filter developed for this study was the SB filter. The purpose of this filter was to suppress the tissue signals (around 40 MHz). The filter magnitude response showed a suppression of −22 dB at the 40-MHz signal and a suppression of −3 dB around 20 MHz. Images generated using this filter were categorized under SB mode. All filters designed for this study were developed using MATLAB.
Data Analysis
Qualitative Analysis
The three imaging modes (fundamental, SHI and SB) were assessed qualitatively based on overall image quality, image noise, plaque visualization, and vessel lumen visualization. Four readers were asked to score images (using a visual analog scale of 1 to 7, worst to best, respectively) from eight randomly selected time points during UCA wash-in and wash-out phase. This was repeated for all three imaging modes. A total of 168 (8 time points per injection × 7 injections × 3 imaging modes) images were shown to each reader in random order for scoring. A Wilcoxon signed-rank test was used to compare the results between the three different imaging modes across each of the scoring criteria. Results were also compared on an injection-by-injection basis. The intraclass correlation (ICC) between readers was evaluated using the ICC Type A analysis for absolute agreement.30
Quantitative Analysis
To quantify the ability of each of the imaging modes to provide delineation between vessel and plaque, the CTR metric was used. Four tissue ROIs, one ROI within the vessel, and plaque ROI(s) were selected by a radiologist for each injection. Sixteen equidistant time points (to approximate data independence) were selected during the wash-in and wash-out of UCA for each injection. Each injection set contained 64 (4 × 16) tissue ROI’s, 16 (16 × 1) vessel ROI’s, and 16 or 32 (depending on the number plaque regions selected) plaque ROIs. The four tissue ROIs were selected along the same horizontal and vertical axes as the vessel ROI (as shown in Figure 2). The vessel-tissue and vessel-plaque CTR were averaged per frame for the 16 time points. A paired student’s t test was used to compare the averaged CTR results across the three different imaging modes.
Figure 2.
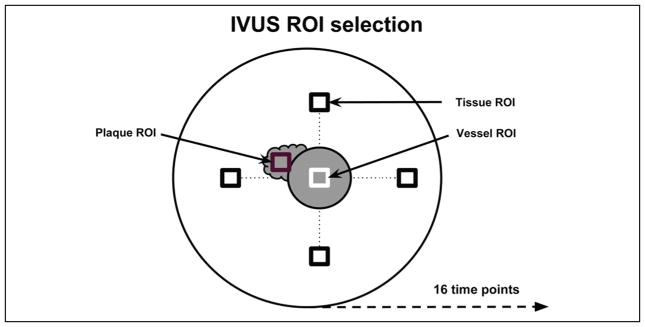
Diagram illustrating the selection of regions of interest.
IVUS = intravascular ultrasound; ROI = region of interest.
Results
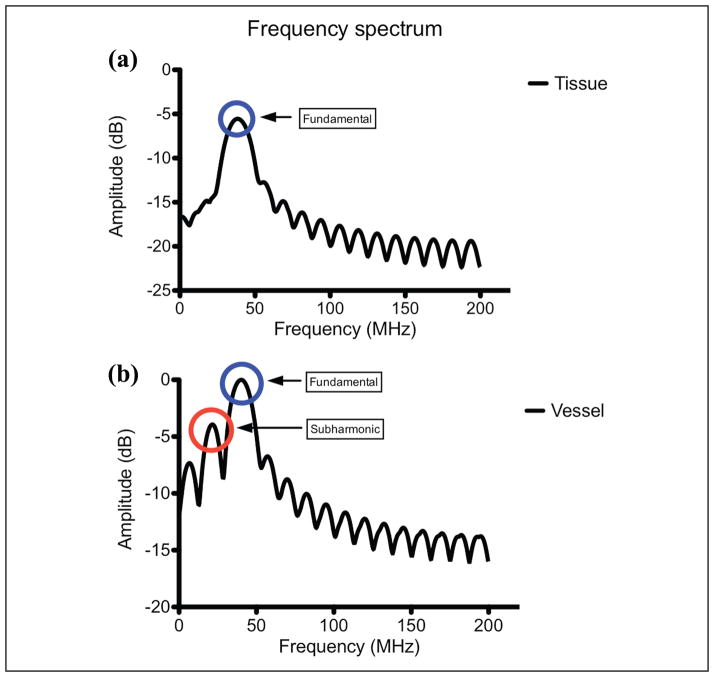
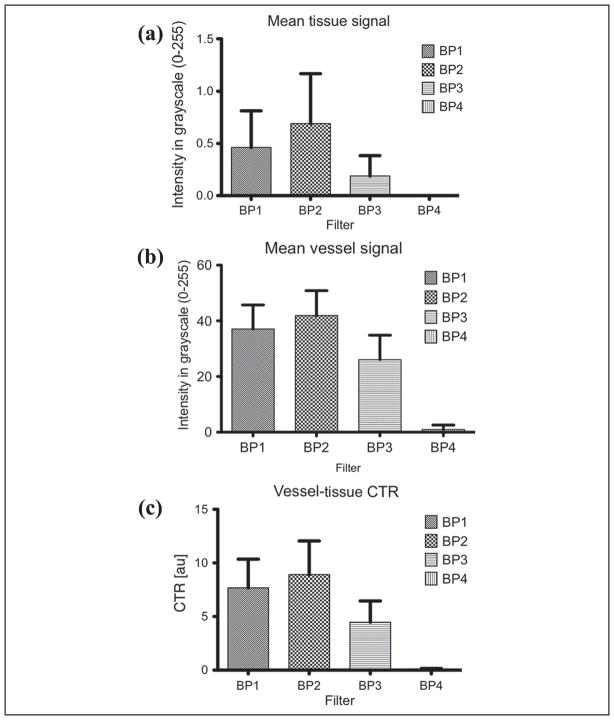
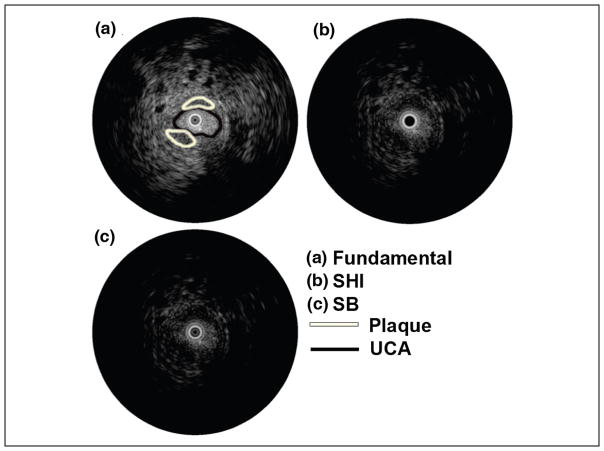
The time-intensity curves for ROIs selected in the vessel and surrounding tissue regions for a single injection is shown in Figure 3. The UCA wash-in and wash-out phase are clearly visible in the vessel (solid line) while the tissue (dashed line) remains relatively constant (as expected). RF spectral analysis (Figure 4) showed a dominant peak around 40 MHz (transmit frequency) for both tissue and vessel regions. However, the vessel region (containing UCA) also exhibited a significant peak around 20 MHz indicating generation of subharmonic signal from the microbubbles. Figure 5 shows the comparison of mean tissue signal, mean vessel signal, and mean vessel-tissue CTR for all four preliminary filters. Overall, the eighth-order filters (mean suppression: 0.09 ± 0.19 arbitrary units [au]) show better tissue suppression compared with the fourth-order filters (mean suppression: 0.58 ± 0.41 [au]). However, these eighth-order filters also showed the most UCA signal suppression. Therefore, the vessel-tissue CTR was used to select the best filter (BP2). Based on preliminary filter results, the fourth-order subharmonic adaptive filter and SB filter were designed and applied to the RF data. Figure 6 shows the log-compressed IVUS images generated in the three imaging modes. The time point selected for generating this figure corresponds to the peak UCA intensity during the wash-in period. A radiologist identified two regions of plaque (outlined in white) for this injection set. In the fundamental mode (Figure 6a), tissue surrounding the vessel lumen and the UCA within the vessel are clearly visible. SHI (Figure 6b) produced near complete suppression (16.63 ± 9.92 dB) of tissue signals relative to the fundamental mode. The UCA is clearly visible within the vessel despite a small drop in its signal intensity (2.50 ± 1.78 dB) relative to the fundamental mode. SB (Figure 6c) also produced near complete tissue suppression (37.30 ± 29.29 dB) relative to the fundamental mode. However, there was higher suppression of signal intensity (3.37 ± 2.63 dB) relative to the fundamental mode. Both SHI and SB show excellent suppression of tissue signal surrounding the vessel, and delineation of plaque from surrounding tissue seems to be better in SHI and SB as compared with the fundamental mode. However, SHI seems to perform slightly better owing to the fact that the SB mode does not show complete vessel lumen definition.
Figure 3.
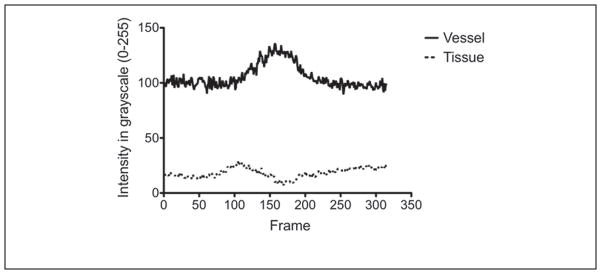
Time-intensity curves for tissue (dashed) and vessel (solid) regions selected in the fundamental mode.
Figure 4.
Radio-frequency spectrum generated from a single tissue and vessel region of interest.
Figure 5.
Preliminary filters: comparison of (a) mean tissue signal, (b) mean vessel signal, and (c) vessel-tissue CTR.
CTR = contrast-to-tissue ratio.
Figure 6.
Log-compressed IVUS images in (a) fundamental, (b) SHI, and (c) SB modes.
SHI = subharmonic imaging; SB = stopband; UCA = ultrasound contrast agent; IVUS = intravascular ultrasound.
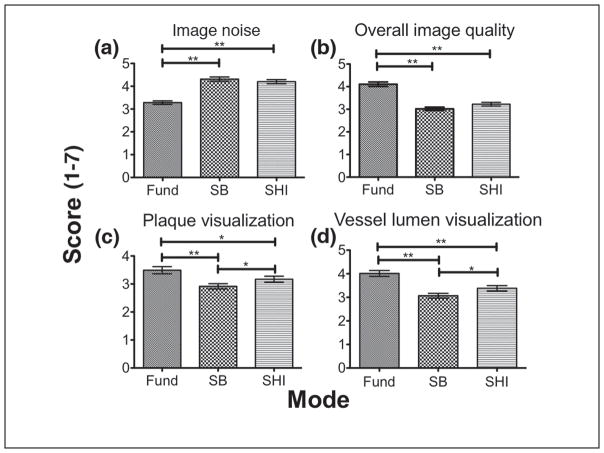
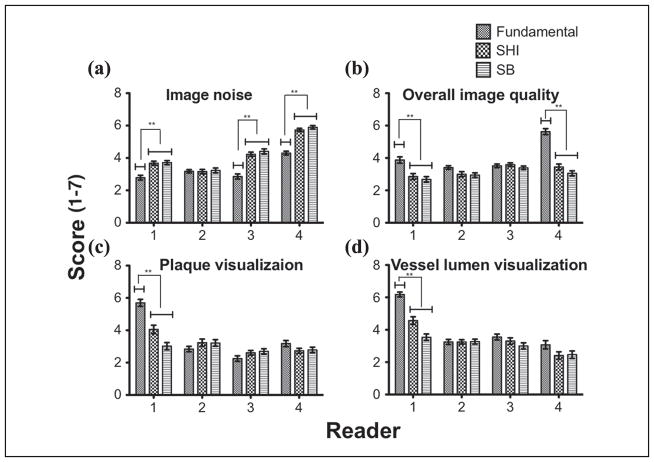
Filtered images (n = 168) were shown in a random order to four readers for evaluation. Figure 7 shows the overall mean score (scores range from 1 to 7) comparison for the three imaging modes for each scoring criteria. Results of the comparison are summarized in Table 1. In three out of the four criteria (i.e., except image noise), fundamental mode scored significantly higher (p < 0.05) than both SHI and SB. In terms of image noise, SHI and SB scored significantly higher (p < 0.001) than the fundamental mode. No significant difference was found between SHI and SB for image noise and overall image quality (p = 0.06). To evaluate the distribution of scores by reader for each imaging mode, their scores were individually compared for each scoring criteria. Figure 8 shows the reader-by-reader comparison for each of the scoring criteria across the three imaging modes. For image noise, three out of four readers scored SHI and SB significantly higher (p < 0.0001) than the fundamental mode. Interestingly, only two readers for overall image quality and one reader each for plaque visualization and vessel lumen visualization scored the fundamental mode significantly (p < 0.0001) higher than SHI and SB. While results from overall mean score comparison showed that the fundamental mode performed significantly better than SHI and SB for overall image quality, plaque visualization, and vessel lumen visualization, by breaking down the comparison to a per-reader basis, it is evident that only one or two readers skewed the overall mean in favor of the fundamental mode.
Figure 7.
Overall mean score comparison for (a) image noise, (b) overall image quality, (c) plaque visualization, (d) and vessel lumen visualization.
SB = stopband; SHI = subharmonic imaging; Fund = fundamental.
Table 1.
Qualitative Analysis Results
| Scoring Criteria (1–7)
|
||||
|---|---|---|---|---|
| Noise | Overall Image Quality | Plaque Visualization | Vessel Lumen Visualization | |
| Fund | 3.28 ± 1.16 | 4.11 ± 1.45 | 3.49 ± 1.92 | 4.01 ± 1.90 |
| SHI | 4.20 ± 1.33 | 3.22 ± 1.23 | 3.17 ± 1.62 | 3.38 ± 1.70 |
| SB | 4.31 ± 1.42 | 3.02 ± 1.11 | 2.92 ± 1.41 | 3.07 ± 1.51 |
SHI = subharmonic imaging; SB = stopband.
Figure 8.
Reader-by-reader mean score comparison for (a) image noise, (b) overall image quality, (c) plaque visualization, and (d) vessel lumen visualization.
SHI = subharmonic imaging; SB = stopband.
ICC Analysis
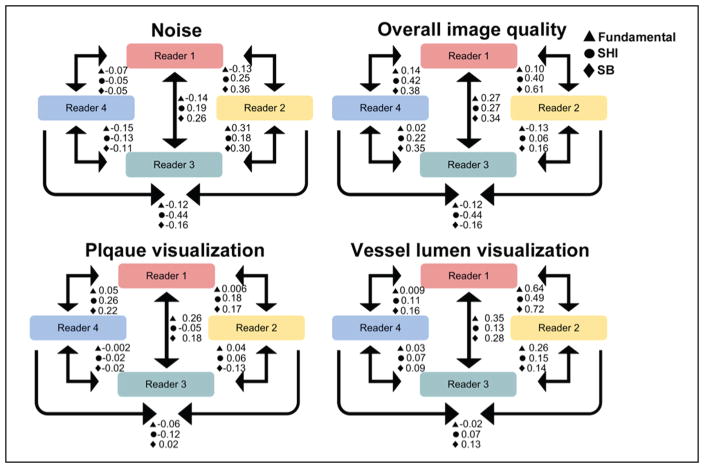
A diagrammatic representation of the ICC between readers is shown in Figure 9. The ICCs between readers is summarized as a range of values (by mode) in Table 2. Results showed a varied range of ICC for each of the scoring criteria. The fundamental mode showed the least variability in 3 (noise: −0.15 to 0.31, overall image quality: −0.13 to 0.27, and plaque visualization: −0.06 to 0.05) scoring criteria. However, the fundamental mode failed to produce the highest ICC in any of the scoring criteria. SHI showed the highest variability of ICC for noise (−0.44 to 0.25), overall image quality (−0.44 to 0.42), and plaque visualization (−0.12 to 0.26), while SB showed the highest variability of ICC for vessel lumen visualization (0.09–0.72). Whereas SB produced highest ICC for noise (0.36), overall image quality (0.61), and vessel lumen visualization (0.72), SHI produced the highest ICC for plaque visualization (0.26).
Figure 9.
Diagrammatic representation of the intraclass correlation between readers.
SHI = subharmonic imaging; SB = stopband.
Table 2.
Range of ICC Coefficients for the Three Imaging Modes across Each Scoring Criteria
| Scoring Criteria
|
||||
|---|---|---|---|---|
| Type A ICC Coefficient Using Absolute Agreement
| ||||
| Noise | Overall Image Quality | Plaque Visualization | Vessel Lumen Visualization | |
| Fundamental | −0.15–0.31 | −0.13–0.27 | −0.06–0.05 | −0.02–0.64 |
| SHI | −0.44–0.25 | −0.44–0.42 | −0.12–0.26 | 0.07–0.49 |
| SB | −0.16–0.36 | −0.16–0.61 | −0.13–0.22 | 0.09–0.72 |
ICC = intraclass correlation. SHI = subharmonic imaging; SB = stopband.
Quantitative Analysis
The vessel-tissue CTR and vessel-plaque CTR were evaluated for each injection set for all three modes. Figure 10 shows the CTR comparison between the three modes. In terms of vessel-tissue CTR, the fundamental mode (9.05 ± 10.93, p < 0.0001) was significantly higher than SHI (3.49 ± 3.63) and SB (2.54 ± 2.75). SHI also had a significantly (p < 0.0001) higher vessel-tissue CTR compared with SB. Importantly, for vessel-plaque CTR, SHI (2.01 ± 2.21) was significantly higher than fundamental (1.76 ± 2.28, p = 0.0025) and SB (1.82 ± 2.01, p = 0.0005). There were no significant differences in vessel-plaque CTR between fundamental and SB. These CTR results are summarized in Table 3.
Figure 10.
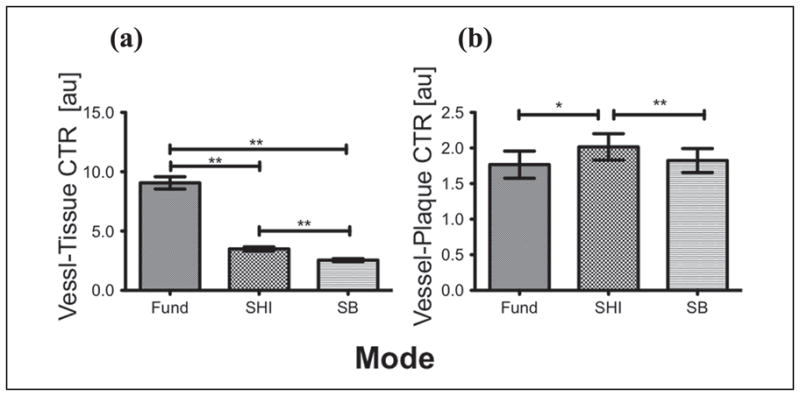
Overall mean CTR comparison for (a) vessel-tissue (b) vessel-plaque.
CTR = contrast-to-tissue ratio; SHI = subharmonic imaging; SB = stopband; Fund = fundamental.
Table 3.
Mean CTR for Vessel-Tissue and Vessel-Plaque across Three Imaging Modes
| CTR [au]
|
||
|---|---|---|
| Vessel-Tissue | Vessel-Plaque | |
| Fundamental | 9.05 ± 10.93 | 1.76 ± 2.28 |
| SHI | 3.49 ± 3.63 | 2.01 ± 2.21 |
| Stopband | 2.54 ± 2.75 | 1.82 ± 2.01 |
CTR = contrast-to-tissue ratio; SHI = subharmonic imaging.
Discussion and Conclusion
The feasibility of using SHI filtering techniques to delineate plaque in vivo has been investigated. An optimized subharmonic adaptive filter was designed based on preliminary filter results and subsequently applied to the acquired RF data (use of a SB filter was also investigated). Based on overall mean scores, SHI (4.20 ± 1.33) and SB (4.31 ± 1.42) had significantly less image noise as compared with the fundamental mode (3.28 ± 1.16, p < 0.001), while in the remaining categories, the fundamental mode performed significantly better than SHI and SB. However, further reader-by-reader analysis in the remaining categories (i.e., overall image quality, plaque visualization, and vessel lumen visualization) showed that the readers were not unanimously in favor of the fundamental mode. In fact, for overall image quality, only two readers and only one reader each for plaque visualization and vessel lumen visualization scored the fundamental significantly higher than the other modes (Figure 8). Given the variability in the scores (and the ICC values), it is difficult to make a conclusive statement based on qualitative evidence as to which mode offers the best plaque visualization. Quantitatively, however, vessel-plaque CTR for SHI (2.01 ± 2.21) was significantly higher than both fundamental (1.76 ± 2.28, p = 0.0025) and SB (1.82 ± 2.01, p = 0.0005), and therefore producing the best plaque delineation.
Other groups have also investigated the feasibility of using contrast-enhanced IVUS for imaging the vasa vasorum to detect and characterize atherosclerotic plaques.4,31–33 Carlier et al.4 proposed a technique for imaging plaque inflammation and activity by measuring density and perfusion (PER) of plaque vasa vasorum. An earlier study by our group employing the same system and investigating the feasibility of using subharmonic IVUS parametric maps to visualize plaque showed the cumulative maximum intensity (CMI), PER, and time-integrated intensity (TII) vessel-plaque CTR for SHI to be significantly higher relative to the fundamental (p < 0.04).34 Goertz el al.31–33 have extensively studied nonlinear IVUS imaging for visualizing the vasa vasorum using both HI and SHI, and showed up to a 30-dB increase in CTR for SHI relative to the fundamental mode. Although the results of our study do not show CTR increments over the fundamental comparable with Goertz et al., this could be attributed to very different data acquisition setups. Goertz et al. used a prototype nonlinear IVUS system with a custom transducer to have sensitivity at both the subharmonic and harmonic. Our study used an off-the-shelf, commercially available IVUS system (Galaxy) and imaging catheter (Atlantis® SR Pro Imaging Catheter). The transducer frequency response was centered on 40 MHz and showed over a −6-dB drop around 20 MHz (inherently reducing the sensitivity to the subharmonic signal by 50% relative to the fundamental). Furthermore, we did not employ any pulse inversion or motion compensation techniques (which could possibly induce image artifacts, but might also increase signal-to-noise-ratios [SNRs]. Despite these limitations, the ability to visualize aque using a custom-developed subharmonic adaptive filter algorithm for IVUS was shown to be feasible (and perform quantitatively better than the fundamental mode) in vivo using a commercially available system (albeit based on a small sample size). Future studies will look at the feasibility of visualizing the neovascular vasa vasorum using nonlinear ultrasound imaging techniques on a commercially available scanner.
Acknowledgments
Funding
The author(s) disclosed receipt of the following financial support for the research, authorship, and/or publication of this article: This study was funded by the National Institutes of Health Grants RO1 HL088523 and R01 CA140338.
Footnotes
Reprints and permission: sagepub.com/journalsPermissions.nav
Declaration of Conflicting Interests
The author(s) declared no potential conflicts of interest with respect to the research, authorship, and/or publication of this article.
References
- 1.Falk E, Shah PK, Fuster V. Coronary plaque disruption. Circulation. 1995;92:657–71. doi: 10.1161/01.cir.92.3.657. [DOI] [PubMed] [Google Scholar]
- 2.Virmani R, Burke AP, Kolodgie FD, Farb A. Vulnerable plaque: the pathology of unstable coronary lesions. J Intervent Cardiol. 2002;15:439–46. doi: 10.1111/j.1540-8183.2002.tb01087.x. [DOI] [PubMed] [Google Scholar]
- 3.Lloyd-Jones D, Adams R, Carnethon M, De Simone G, Ferguson TB, Flegal K, et al. Heart disease and stroke statistics–2009 update: a report from the American Heart Association Statistics Committee and Stroke Statistics Subcommittee. Circulation. 2009;119:480–6. doi: 10.1161/CIRCULATIONAHA.108.191259. [DOI] [PubMed] [Google Scholar]
- 4.Carlier S, Kakadiaris IA, Dib N, Vavuranakis M, O’Malley SM, Gul K, et al. Vasa vasorum imaging: a new window to the clinical detection of vulnerable atherosclerotic plaques. Curr Atheroscler Rep. 2005;7:164–9. doi: 10.1007/s11883-005-0040-2. [DOI] [PubMed] [Google Scholar]
- 5.Carlier SG, Tanaka K. IVUS makes important strides in 2005. J Intervent Cardiol. 2006;19:337–9. doi: 10.1111/j.1540-8183.2006.00156.x. [DOI] [PubMed] [Google Scholar]
- 6.Tobis J, Mahon D, Moriuchi M, Honye J, McRae M. Intravascular ultrasound imaging following balloon angioplasty. Int J Card Imaging. 1991;6:191–205. doi: 10.1007/BF01797851. [DOI] [PubMed] [Google Scholar]
- 7.Kalidindi S, Tuzcu E, Nicholls S. Role of imaging end points in atherosclerosis trials: focus on intravascular ultrasound. Int J Clin Pract. 2007;61:951–62. doi: 10.1111/j.1742-1241.2007.01384.x. [DOI] [PubMed] [Google Scholar]
- 8.Nicholls SJ, Sipahi I, Tuzcu EM. Assessment of progression and regression of coronary atherosclerosis by intravascular ultrasound. A new paradigm shift? Rev Esp Cardiol (English Edition) 2006;59:57–66. [PubMed] [Google Scholar]
- 9.Batkoff BW, Linker DT. Safety of intracoronary ultrasound: data from a Multicenter European Registry. Cathet Cardiovasc Diagn. 1996;38:238–41. doi: 10.1002/(SICI)1097-0304(199607)38:3<238::AID-CCD3>3.0.CO;2-9. [DOI] [PubMed] [Google Scholar]
- 10.Guédès A, Keller PF, L’Allier PL, Lespérance J, Grégoire J, Tardif JC. Long-term safety of intravascular ultrasound in nontransplant, nonintervened, atherosclerotic coronary arteries. J Am Coll Cardiol. 2005;45:559–64. doi: 10.1016/j.jacc.2004.10.063. [DOI] [PubMed] [Google Scholar]
- 11.Kume T, Okura H, Yamada R, Kawamoto T, Watanabe N, Neishi Y, et al. Frequency and spatial distribution of thin-cap fibroatheroma assessed by 3-vessel intravascular ultrasound and optical coherence tomography: an ex vivo validation and an initial in vivo feasibility study. Circ J. 2009;73:1086–91. doi: 10.1253/circj.cj-08-0733. [DOI] [PubMed] [Google Scholar]
- 12.Hausmann D, Erbel R, Alibelli-Chemarin MJ, Boksch W, Caracciolo E, Cohn JM, et al. The safety of intracoronary ultrasound: a multicenter survey of 2207 examinations. Circulation. 1995;91:623–30. doi: 10.1161/01.cir.91.3.623. [DOI] [PubMed] [Google Scholar]
- 13.Spencer T, Ramo MP, Salter DM, Anderson T, Kearney PP, Sutherland GR, et al. Characterisation of atherosclerotic plaque by spectral analysis of intravascular ultrasound: an in vitro methodology. Ultrasound Med Biol. 1997;23:191–203. doi: 10.1016/s0301-5629(96)00199-8. [DOI] [PubMed] [Google Scholar]
- 14.Nair A, Kuban BD, Tuzcu EM, Schoenhagen P, Nissen SE, Vince DG. Coronary plaque classification with intravascular ultrasound radiofrequency data analysis. Circulation. 2002;106:2200–6. doi: 10.1161/01.cir.0000035654.18341.5e. [DOI] [PubMed] [Google Scholar]
- 15.Watson R, McLean C, Moore M, Spencer T, Salter DM, Anderson T, et al. Classification of arterial plaque by spectral analysis of in vitro radio frequency intravascular ultrasound data. Ultrasound Med Biol. 2000;26:73–80. doi: 10.1016/s0301-5629(99)00112-x. [DOI] [PubMed] [Google Scholar]
- 16.Shankar P, Krishna P, Newhouse V. Subharmonic backscattering from ultrasound contrast agents. J Acoust Soc Am. 1999;106:2104–10. doi: 10.1121/1.428142. [DOI] [PubMed] [Google Scholar]
- 17.Eller A, Flynn H. Generation of subharmonics of order one-half by bubbles in a sound field. J Acoust Soc Am. 1969;46:722–9. [Google Scholar]
- 18.Bouakaz A, Krenning B, Biagini E, Galema T, ten Cate F, de Jong N. Contrast harmonic transesophageal echocardiography: a feasibility study. Ultrasound Med Biol. 2004;30:877–83. doi: 10.1016/j.ultrasmedbio.2004.04.008. [DOI] [PubMed] [Google Scholar]
- 19.Forsberg F, Goldberg BB, Liu JB, Merton DA, Rawool NM. On the feasibility of real-time, in vivo harmonic imaging with proteinaceous microspheres. J Ultrasound Med. 1996;15:853–60. doi: 10.7863/jum.1996.15.12.853. [DOI] [PubMed] [Google Scholar]
- 20.Seidel G, Algermissen C, Christoph A, Claassen L, Vidal-Langwasser M, Katzer T. Harmonic imaging of the human brain: visualization of brain perfusion with ultrasound. Stroke. 2000;31:151–4. doi: 10.1161/01.str.31.1.151. [DOI] [PubMed] [Google Scholar]
- 21.Goldberg B, Raichlen J, Forsberg F. Ultrasound Contrast Agents—Basic Principles and Clinical Applications. 2. London, England: Martin Dunitz; 2001. [Google Scholar]
- 22.Hamilton MF, Blackstock DT. Nonlinear Acoustics. San Diego, CA: Academic Press; 1998. [Google Scholar]
- 23.Forsberg F, Shi W, Goldberg B. Subharmonic imaging of contrast agents. Ultrasonics. 2000;38:93–8. doi: 10.1016/s0041-624x(99)00148-1. [DOI] [PubMed] [Google Scholar]
- 24.Bhagavatheeshwaran G, Shi WT, Forsberg F, Shankar PM. Subharmonic signal generation from contrast agents in simulated neovessels. Ultrasound Med Biol. 2004;30:199–203. doi: 10.1016/j.ultrasmedbio.2003.10.016. [DOI] [PubMed] [Google Scholar]
- 25.Forsberg F, Liu JB, Shi WT, Ro R, Lipcan KJ, Deng X, et al. In vivo perfusion estimation using subharmonic contrast microbubble signals. J Ultrasound Med. 2006;25:15–21. doi: 10.7863/jum.2006.25.1.15. [DOI] [PubMed] [Google Scholar]
- 26.Shi WT, Forsberg F. Ultrasonic characterization of the nonlinear properties of contrast microbubbles. Ultrasound Med Biol. 2000;26:93–104. doi: 10.1016/s0301-5629(99)00117-9. [DOI] [PubMed] [Google Scholar]
- 27.Shi WT, Forsberg F, Hall AL, Chiao RY, Liu JB, Miller S, et al. Subharmonic imaging with microbubble contrast agents: initial results. Ultrason Imaging. 1999;21:79–94. doi: 10.1177/016173469902100201. [DOI] [PubMed] [Google Scholar]
- 28.Chomas J, Dayton P, May D, Ferrara K. Nondestructive subharmonic imaging. IEEE Trans Ultrason Ferroelectr Freq Control. 2002;49:883–92. doi: 10.1109/tuffc.2002.1020158. [DOI] [PubMed] [Google Scholar]
- 29.Hill C, Bamber J, Cosgrove D. Performance criteria for quantitative ultrasonology and image parameterisation. Clin Phys Physiol Meas. 1990;11:57. doi: 10.1088/0143-0815/11/4a/307. [DOI] [PubMed] [Google Scholar]
- 30.Shrout PE, Fleiss JL. Intraclass correlations: uses in assessing rater reliability. Psychol Bull. 1979;86:420–8. doi: 10.1037//0033-2909.86.2.420. [DOI] [PubMed] [Google Scholar]
- 31.Goertz DE, Frijlink ME, De Jong N, van der Steen AF. Nonlinear intravascular ultrasound contrast imaging. Ultrasound Med Biol. 2006;32:491–502. doi: 10.1016/j.ultrasmedbio.2006.01.001. [DOI] [PubMed] [Google Scholar]
- 32.Goertz DE, Frijlink ME, Tempel D, Bhagwandas V, Gisolf A, Krams R, et al. Subharmonic contrast intravascular ultrasound for vasa vasorum imaging. Ultrasound Med Biol. 2007;33:1859–72. doi: 10.1016/j.ultrasmedbio.2007.05.023. [DOI] [PubMed] [Google Scholar]
- 33.Goertz DE, Frijlink ME, Tempel D, van Damme LC, Krams R, Schaar JA, et al. Contrast harmonic intravascular ultrasound: a feasibility study for vasa vasorum imaging. Invest Radiol. 2006;41:631–8. doi: 10.1097/01.rli.0000229773.11715.da. [DOI] [PubMed] [Google Scholar]
- 34.Eisenbrey JR, Sridharan A, deMuinck ED, Doyley MM, Forsberg F. Parametric subharmonic imaging using a commercial intravascular ultrasound scanner. J Ultrasound Med. 2012;31:361–71. doi: 10.7863/jum.2012.31.3.361. [DOI] [PMC free article] [PubMed] [Google Scholar]


