

Abstract
Breast cancer accounts for about 30% of all cancers and 15% of cancer deaths in women. Advances in computer assisted analysis hold promise for classifying subtypes of disease and improving prognostic accuracy. We introduce a Grid-enabled decision support system for performing automatic analysis of imaged breast tissue microarrays. To date, we have processed more than 100,000 digitized specimens (1200×1200 pixels each) on IBMs World Community Grid (WCG). As part of the Help Defeat Cancer (HDC) project, we have analyzed the data returned from WCG along with retrospective patient clinical profiles for a subset of 3744 breast tissue samples and the results are reported in this paper. Texture based features were extracted from the digitized images and isometric feature mapping (ISOMAP) was applied to achieve nonlinear dimension reduction. Iterative prototyping and testing were performed to classify several major subtypes of breast cancer. Overall the most reliable approach was gentle AdaBoost using an eight node classification and regression tree (CART) as the weak learner. Using the proposed algorithm, a binary classification accuracy of 89% and the multi-class accuracy of 80% were achieved. Throughout the course of the experiments only 30% of the dataset was used for training.
Index Terms: Tissue Microarray, Texton, Grid Computing, AdaBoost
I. Introduction
Breast cancer is one of the leading cancers for women. It is the second most common cause of cancer death in white, black, Asian/Pacific Islander and American Indian/Alaskan native women [1], [2]. Early detection and improved therapy planning are crucial for increasing the survival rates of cancer patients.
Tissue microarray (TMA) technology makes it possible to extract small cylinders of tissue from pathology specimens and arrange them on a recipient paraffin block such that hundreds can be assessed simultaneously [3], [4]. Although TMA technology is still evolving, the underlying methods have already been tested extensively and validated for use in several key areas of cancer research. Recently, several leading research groups participated in efficacy studies in which they compared the accuracy of TMA-based analysis with assessments, which had been rendered using traditional whole tissue sections or cDNA microarrays. These findings were reported for a range of disorders including breast cancer [5], [6], prostate cancer [7] and gastric cancer [8]. It is now generally accepted that two to four samples taken from different regions of each donor tissue block provides enough information to allow reliable evaluation of the specimen.
One of the advantages of TMA arrays is that they allow for amplification of limited tissue resources by providing the means for producing large numbers of small core biopsies, rather than generating one single specimen section. Using TMA technology, a carefully planned array can be constructed such that a 20 years survival analysis can be performed on a cohort of 600 or more patients using only 100–200 microliters of antibody. Another major advantage of the TMA technique is that each constituent disc within a given array is treated in an identical manner in terms of incubation times, temperatures and washing conditions. Currently, the primary methods used to evaluate tissue arrays involve interactive review of specimens which are subjectively evaluated and scored. An alternate, but less utilized approach is to sequentially digitize each specimen for subsequent semi-quantitative assessment. Both strategies ultimately involve interactive evaluation of TMA samples, which is a slow, tedious process which is prone to error. Reducing the amount of time and effort to process TMA could potentially lead to acceleration of the pace of cancer research.
Although strides have been made towards automating some aspects of the analysis [9], [10], the full promise of TMA has not yet been realized, in part, because of a lack of reliable methods for performing large-scale quantitative comparative analysis. We recently undertook a collaborative project with IBM, the “Help Defeat Cancer” (HDC) [11] project, which enabled us to utilize the massive computational power of the World Community Grid (WCG). A screenshot of one of the thousands of distributed client computers participating in the HDC is shown in Figure 1. The WCG enabled us to demonstrate the feasibility of using spectral and spatial signatures to characterize staining characters of imaged cancer specimens. In this paper, we report a Grid-enabled framework and efficient classification algorithm for high-throughput analysis of digitized breast cancer specimens. We analyzed a subset of the data returned from WCG along with the patients’ retrospective clinical profiles to discriminate among benign breast tissues and two other subtypes of breast cancer. More background information can be found on the HDC project though Wikipedia using the keyword “Help Defeat Cancer” [12].
Fig. 1.

A screenshot of Help Defeat Cancer (HDC) clinet running on IBM world community grid (WCG).
The remainder of the paper is organized as follows: Section 2 introduces background information on the World Community Grid. In Section 3, we introduce the data generation and system framework. Section 4 explains the data analysis methods, including feature extraction, dimension reduction and classification. Section 5A provides comparative experimental results of nine binary classifiers. Section 5B shows the performance of extending the binary gentle AdaBoost algorithm to the multi-class problem. Section 6 concludes the paper.
II. World Community Grid
IBM World Community Grid [13] (WCG) is a philanthropic project which utilizes otherwise unused CPU cycles from personal computers around the world and aggregates the combined computational power. WCG was established to address challenging large scale non-profit research projects which can benefit humanity. It takes advantage of otherwise wasted energy and at the same time creates a virtual supercomputer that by some measures exceeds the capacity of traditional supercomputers. The result is that some otherwise impractical or intractable research projects can be brought to successful completion. Investigators can submit a research proposal for consideration by the WCG project committee. If approved by the advisory board, the project is run at no cost to the research team. Findings are subsequently placed in the public domain. Suitable research areas include, but are not limited to biomedical, climatology, environment, conservation and emergency preparedness.
WCG enabled the most computationally intensive components of the Help Defeat Cancer (HDC) project to run at optimal speed, thereby increasing the accuracy and sensitivity with which expression calculations and pattern recognition procedures were conducted. By harnessing the collective computational power of WCG, we were able to analyze a larger set of cancer tissue specimens than what would be possible using traditional computer resources. This added level of speed and sophistication led to improved capacity to detect subtle changes in measurable parameters, and prognostic clues which are difficult to observe by visual inspection alone.
The research proposal for the HDC project was originally submitted in August 2005. By May, 2006, the research team composed of researchers from The Cancer Institute of New Jersey, Robert Wood Johnson Medical School, Rutgers University and the University of Pennsylvania School of Medicine delivered test programs to the technical support team of WCG for review. The IBM team subsequently performed a thorough security review of the code and modified it for use on the Grid. The changes included footprint reductions, incorporation of robust checkpointing and Grid I/O modifications.
Imaged pathology specimens were generated using a high-throughput whole slide scanner and transferred from laboratories within Robert Wood Johnson Medical School (RWJMS) and The Cancer Institute of New Jersey (CINJ) to the secure Boulder Colorado IBM hosting site where World Community Grid servers reside. As results were computed, they were returned to the servers at RWJMS and CINJ. The total of the transfers approached one terabyte of data. About 2909 years of run-time in the form of slightly more than 5 million work packages were harvested from the personal computers that contributed to World Community Grid. This includes an approximate 3 times redundancy of work to ensure that the computations were not in error or tampered with. Because of the fairly large working set memory required for the program, only machines with over 1 GB of RAM were selected to run the project.
III. Data Generation and System Framework
The Tissue microarrays (TMA) used in the HDC project were collected from The Cancer Institute of New Jersey, Yale University, University of Pennsylvania and Imagenex Corporation (San Diego, CA). To date over 300 slides containing cohorts of hundreds of tissue discs each and originating from 45 TMAs were digitized at 40× resolution using a Trestle MedMicro virtual microscopy system. The output images typically contain 1–3 billion of pixels and were stored as a compressed tiled TIFF file sized at 0.5 to 2 Gigabytes. Our registration protocols [14] were applied to the scanned images to identify rows and columns of the tissue arrays. Any tissue cores that suffered from exceedingly pronounced artifacts were excluded from the study. Images of each tissue core were systematically extracted from the archive and packaged as workunits for the HDC project. The dimension of each image was 1200 × 1200. The specimens under study had previously been stained with hematoxylin and hematoxylin & eosin. Two staining examples are shown in Figure 2. A texton extraction algorithm was applied on the staining maps of the two dyes which were generated using color decomposition [14]. Each of the resulting staining maps as well as the luminance measure generated from the original color image were uploaded as separate workunits to the WCG. The work-flow and logical units are shown in Figure 3.
Fig. 2.
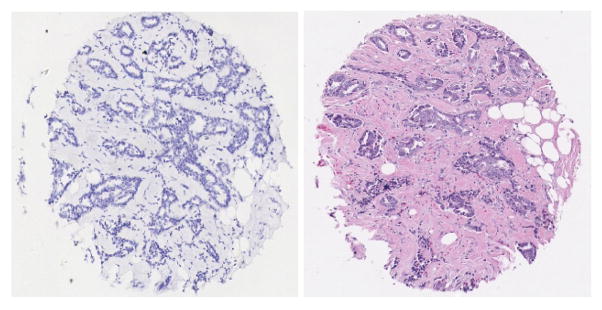
Two staining examples. On the left is a hematoxylin stained tissue and on the right is hematoxylin & eosin stained tissue.
Fig. 3.

The framework of the high-throughput analysis of breast tissues on the IBM World Community Grid.
IV. Data Analysis
As TMA is being utilized increasingly in cancer research, the development of accurate and efficient method to evaluate TMA specimens remains a major goal. The individual tissue discs comprising a given TMA contain complex, heterogeneous tissue components, which renders most straight forward quantification methods ineffective. Furthermore, as researchers design experiments using different staining techniques which target specific proteins, the methods used for interpreting these specimens must vary accordingly.
In this section, we explain the methods used to generate and analyze the image features for automatic classification of breast tissue specimens. Textures and intensities were used as feature measures to classify the staining profiles of the imaged tissues. Because the feature vectors lie in a high dimensional space, we applied a nonlinear dimension reduction method to decrease the dimensionality. Through iterative experiments we determined that among several different classification algorithms, the gentle AdaBoost classifier provided the best overall performance in the reduced subspace.
A. Texton and Features
Figure 2 shows two breast cancer specimens. It can be found that the difference in texture can be used as the discriminative features to separate different types of breast tissues. Traditional texture analysis includes Law’s moment [15], cooccurrence matrices [16], run length matrices [17] and autoregressive models [18] et. al.
In recent studies, texture has been represented using texton. Textons are defined as conspicuous repetitive local features that humans perceive as being discriminative between textures. Unlike many other texture features that describe each texture as a constant relationship – a number, a data vector or a set of model parameters – between each pixel and its surroundings, the concept of a texton supports the existence of numerous distinct textual components in each texture. Therefore, it has advantages in describing textures that have high-level components. Texton based texture analysis has been widely used in many fields of texture related research, including classification [19], [20], [21], segmentation [22] and synthesis [23].
Based on texton theory, we set out to establish a large reference library which could be used as the fundamental vocabulary for distinguishing between cancer and benign tissues. This is referred to as the “bag of visual words” model and has been widely used in recent object recognition literature [22], [24], [25]. In our approach each work unit was first filtered with a texton filter bank. Subsequently, the cluster modes were extracted from the resulting filter responses to generate a universal reference library. The filtering responses collected across all imaged discs can be considered as typical words that describe the underlying histology and staining pattern of the specimens. Thus far, over 100,000 imaged tissue discs have been processed on the Grid.
In our experiments, four different types of filter banks were compared.
Gabor filter bank: The basic even-symmetric Gabor filter bank is a set of 2D Gaussian function with variances σx and σy which are modulated by a complex sinusoid. The sinusoid has center frequencies u and v along x and y-axes, respectively.
The Leung-Malik (LM) Filter Bank [26]: The LM filter bank are a set of first and second derivatives of 2D Gaussian function at six orientation and three scales, coupled with eight Laplacian of Gaussian (LoG) and four Gaussian function.
The Schmid filter bank [27]: The Schmid filter bank is composed of 13 orientation invariant filters. It is best suited for orientation insensitive texture segmentation.
The Maximum Response (MR) Filter Banks [20]: The MR filter bank is quite similar to the LM filter bank. However, in order to achieve the orientation invariance, only the maximum response is chosen as the feature for each scale of the first and second derivatives of the Gaussian. The LoG and Gaussian are chosen as another two features. All combined the dimension of the feature space is eight.
Systematic analysis did not show significant differences among these filter banks in performance and ultimately we decided to utilize the 49 × 49 LM filter bank to compute the filter responses. The feature vector is composed of eight LoG filter responses with , four Gaussian filtering responses with and the bar and edge filtering response within six different directions, θ = 0, π/6, π/3, π/2, 2π/3, 5π/6, . In total, each image pixel was represented by a 48 dimensional feature vector. Figure 4 shows the LM filtering bank in our system.
Fig. 4.
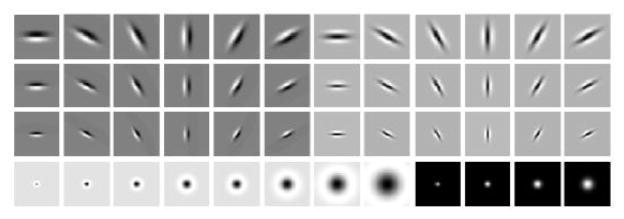
The LM filter bank used to generate the texture features.
The image filtering response generated using the collective computation power of the World Community Grid were gathered together and clustered using K-means, where K was set to 4000 in our experiments. The cluster centers, called textons, were used to generate the texton library. The appearance of each breast tissue image was modeled by a compact quantized description called texton histograms. Texton histograms are created by assigning each pixel filter response in the image to its closest texton in the generated texton library, which was calculated using
| (1) |
where I denotes breast tissue image, i is the ith element of the texton dictionary, T(j) returns the texton assigned to pixel j. In this way, each breast tissue image was modeled as a texture modes distribution, the texton histogram. Each image was mapped to one point in the high dimension space Rd, where d = K = 4000 is the number of textons.
B. Dimension Reduction and Classification
After quantizing the filter response into texton histograms, each image was represented by a 4000 dimension vector. Generally, in such a high dimensional space, one has to consider the “curse of dimensionality” [28, pp. 170]. In this paper, a nonlinear dimension reduction method, the isometric feature mapping (ISOMAP) [29], was applied to find the embedded dimensionality of the original feature space.
1) Nonlinear Dimension Reduction
Although the dimensionality of the input features was quite high, the features have usually exhibited much less degrees of freedom. Given a set of feature vectors Z = {z1, …zi, …zn} where zi ∈ Rd, there exists a nonlinear mapping T which represents zi in the low dimension as
| (2) |
where ui ∈ Rd is the sampling noise and and xi ∈ Rq denotes the representation of the original zi in the low-dimensional subspace, where q represents the dimensionality of the reduced subspace.
Unsupervised manifold learning is capable of discovering the degrees of freedom that underlie complex natural observations. We applied ISOMAP to explore the low dimension embedding in the original feature space. In the first step, we determined the neighbors of each point zi in the original space Rd and connected the neighbors to form a weighted graph G. The weights were calculated based on the Euclidean distance between each connected pair of points. We then calculated the shortest distance in the graph G, dG(i, j), between pairs of points of zi and zj. The final step was to apply the standard multiple dimensional scaling (MDS) [30] to the matrix of graph distance M = {dG(i, j)}. In this way, the ISOMAP applied a linear MDS on the local patch but preserved the geometric distance globally using the shortest path in the weighted graph G. Cross validation (CV) [31] was applied to evaluate the embedded dimensionality of the original 4000 dimensional feature vector. CV is the statistical method of partitioning samples into subsets
| (3) |
where xi is the feature vector in the reduced subspace Rq, yi = {+1, −1}, which represents the cancer and benign breast tissue labels. f−k(xi, α) is used to denote the classification results using the α-th dimensionality with the k-th partition removed from the training set. In Figure 5 we show the CV errors corresponding to the dimensions of the feature vector. An elbow can be observed when the dimensionality approaches 500, therefore, we choose to reduce the dimension of the original feature vector to 500.
Fig. 5.
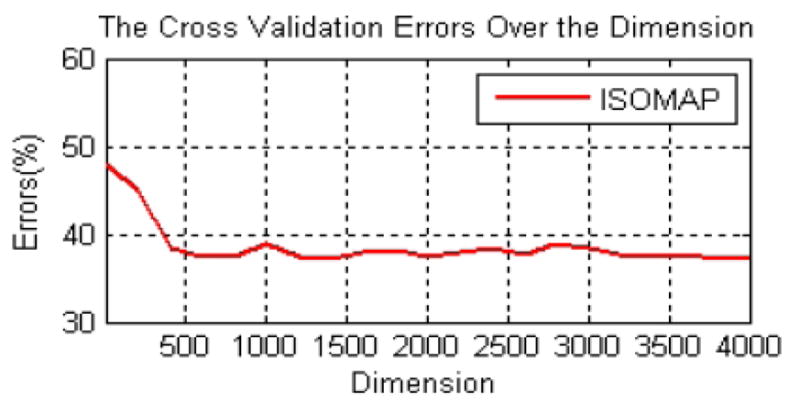
The five-fold cross validation error over the dimensionality using ISOMAP for nonlinear dimension reduction.
2) Classification
In [32], the k-nearest neighbor (kNN) and classification tree (C4.5) were integrated into a Bayesian framework for characterizing breast tissues. However, in our case, each training sample was represented by a feature vector xi in the reduced subspace Rq where q = 500. This is still a relatively high dimension where the maximal margin classifiers such as support vector machine (SVM) [33] and boosting [34] are better suited. We conducted experiments to compare the performance of four boosting algorithms, the standard AdaBoost, the gentle AdaBoost, the real AdaBoost and LogitBoost with kNN, Bayesian classifier and SVM. The results showed that the maximal margin classifiers [33], [34], such as SVM and boosting, which simultaneously minimize the empirical classification error and maximize the geometric margin, outperformed all the other algorithms. In order to separate two subtypes of breast cancers from the benign, the best binary classifier in our experiments (the gentle AdaBoost) was extended to a multi-class algorithm
The kNN consists of assigning all the features into k most similar cluster centers based on certain similarity measurements. The final label was determined by majority voting from k candidates. The C4.5 decision tree is a widely used multiple node tree based classifier, which is built by minimizing the entropy.
Let x ∈ X represent the low level feature in the reduced subspace Rq, the Bayesian classifier is designed to maximize a-posterior (MAP) probability
| (4) |
and the Bayesian classifier determines the class Ci by maximizing the posterior probability p(Ci|x).
The support vector machine (SVM) was first introduced in [33] for binary classification problem. The strategy is to construct the linear decision boundaries in a large transformed version of the original feature space. The SVM simultaneously minimizes the empirical classification error and maximizes the geometric margins by minimizing the regularization penalty
| (5) |
When the examples are not linearly separable, the optimization can be modified by adding a penalty for violating the classification constraints. This is called soft margin SVM which minimizes
| (6) |
where ξi are called slack variables which store the deviation from the margin and C is the soft penalty to balance the training errors and margins. In (5) and (6), w is the slope of the decision hyperplane and w0 is the offset. The xi denotes the feature vector, and yi is the ground true labels. We minimize (6) by maximizing the dual problem of (6) which involve a feature mapping φ(x) through an inner product. The inner product can be evaluated without ever explicitly constructing the feature vectors φ(x) but through a kernel function κ(x, x′). In our project, we proposed to use a nonlinear Mercer kernel [35] based on χ2 distance. It was shown that among other choices of distance functions between histograms, χ2 distance performed the best for the texture similarity measure. The kernel function is defined as
| (7) |
where
| (8) |
Boosting works by sequentially applying a classification algorithm on a reweighted version of the training data and producing a sequence of weak classifiers hj(x), j = 1, 2, …, W where W = 40 in our case represents the number of iteration rounds of each boosting algorithm. The strong classifier is assembled from all the weak classifiers hj(x) to minimize the exponential cost function exp(−yhj(x)), where y represents the label of the training sample x. In the standard binary AdaBoost classification, the labels were decided by weighted voting to produce the final prediction
| (9) |
where H(x) is the learned strong classifier. The αj is the weight of the j-th weak classifier hj(x) and is computed during training. All the boosting algorithms are designed to minimize an exponential cost function . If the weak classifier hj(x) returns a discrete class label {−1, +1}, the boosting algorithm is called AdaBoost. Instead of making a hard decision, if the weak classifier hj(x) returns a real value prediction like a probability mapped to the interval [−1, +1], it is called real AdaBoost. The gentle AdaBoost is a modified version of the real AdaBoost algorithm, which applies Newton step rather than exact optimization at each step of minimizing the loss function. The LogitBoost is another boosting algorithm which uses Newton steps to fit an additive logistic regress model based on maximum likelihood. The weak classifier we used was an eight node classification and regression tree (CART).
We experimentally tested each of the classification algorithms. The gentle AdaBoost using an eight node CART decision tree provided the best results for binary classification problem. Fig. 6 shows the details of the gentle AdaBoost algorithm.
Fig. 6.

The binary gentle AdaBoost using an eight nodes classification and regression tree (CART) as the weak learner.
Multi-class experiments were designed to determine the capacity of the system to subclassify different types of cancer. Given a M-class classification problem, where we have N training samples {x1, y1}, …{xi, yi}, …, {xN, yN }. The xi ∈ Rq denotes the i-th feature vector in the reduced subspace and yi ∈ {1, 2, …, M} represents the corresponding ground-truth class labels. The target is to find a strong classifier which minimizes a multi-class exponential loss function where Hj(x) is the j-th strong classifier. This is equivalent to run separate boosting algorithms in an one-against-all manner. One-against-all boosting constructs M binary classifier, each of which is used to separate one class from all the others. The j-th strong classifier was trained using boosting with all the training samples satisfying yi = j, i = 1, 2, …, N as positive and all the others as negative. As the gentle AdaBoost outperformed the other methods in the previous binary classification, we extended it to classify two different subtypes of cancers from benign tissue images in the multi-class experiment. The multi-class gentle AdaBoost algorithm is shown in Fig. 7.
Fig. 7.

The multi-class gentle AdaBoost using an eight nodes classification and regression tree (CART) as the weak learner.
V. Experiments
In these experiments, pathologists were asked to provide independent confirmation of the ground-truth labels of records for the entire mixed set of 3744 digitized breast tissue images. The breast tissue images contained 10 different types, which included normal (NOR), ductal hyperplasia (DH), fibroadenoma (FIB), atypical ductal hyperplasia (ADH), ductal carcinoma in situ (DCIS), lobular carcinoma in situ (LCIS), invasive ductal carcinoma (IDC), invasive lobular carcinoma (ILC), lymph-node-negative metastasis (LNN) and soft tissue metastasis (STM). The goal of the binary classification experiments was to determine the capacity of the algorithms to separate benign from cancer tissue. Based upon our discussions with surgical pathologists, NOR, DH, FIB and ADH were grouped as benign breast tissue and the remaining classes were grouped as breast cancer. In the multi-class experiment, DCIS and LCIS were treated as one subgroup of cancer and IDC, ILC, LNN and STM as the other.
The mixed set of breast tissue microarrays were digitized using a 40× volume scan on a Trestle/Zeiss MedMicro, whole slide scanner system. We have developed algorithms to automatically delineate the tissue discs comprising the arrays, decompose those discs into their constituent staining maps, and process the images on the World Community Grid. The total number of computers currently participating in the World Community Grid efforts is approximately 250,000 worldwide and growing.
We have analyzed 3744 breast cancer tissues (674 hematoxylin and 3070 hematoxylin and eorin staining) from the total dataset containing 100,000 imaged specimens. Without the Grid, it would require about 210 days of computation to generate the complete texton library using an efficient C++ implementation on a PC with P3 1.5GHz processor and 1G RAM. However, we built the texton library in less than 40 minutes for the breast cancer subset using WCG.
A. Binary Classification of Benign and Caner
In this section, we first present the comparative performance results for four classification methods, kNN, Bayesian, C4.5 and SV M, and four types of boosting algorithms. The dataset used in these experiments consisted of 611 benign and 3133 cancer specimens. Each algorithm was tested 10 times using different portions of the training images drawn from random sampling. We selected 30% of the images as training and the other 70% was reserved for testing. Figure 8 shows the average classification results. It is clear that the maximal margin classifiers, SVM and boosting, produced comparative good results, while outperforming widely used classifiers such as kNN, Bayesian and C4.5 decision tree. The gentle AdaBoost using an eight node CART decision tree provided the best performance. Because the training data was skewed to cancer samples, we obtained higher false positive than false negative rates. This is indeed preferred and is actually a design criteria for many clinical tests.
Fig. 8.
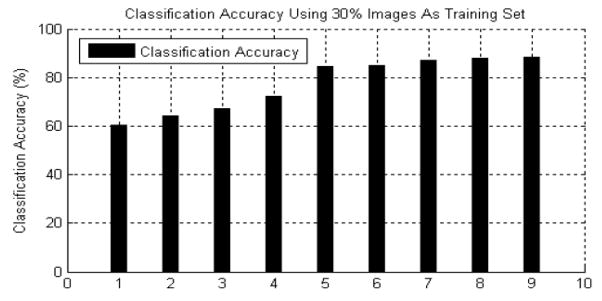
The binary classification accuracy of nine different classifiers using 30% as the training set. 1) Bayesian classifier. 2) KNN (K = 3). 3) KNN (K = 5). 4) C4.5 decision tree. 5) Support vector machine (SVM). 6) Standard AdaBoost. 7) Real AdaBoost. 8) LogitBoost. 9) Gentle AdaBoost.
B. Multi-class Classification of Benign and Two Subtypes of Cancer
The experimental results are presented for studies in which the original gentle AdaBoost algorithm was modified to accommodate multi-class classification. Based on the direction of the clinical pathologist, we separated six subtypes of cancer tissues into two sub-groups: cancer class I which contains DCIS and LCIS and cancer class II containing IDC, ILC, LNN and STM. The dataset is consisted of 611 benign, 1103 cancer class I and 2030 cancer class II. 30% of the images in each class were randomly selected for training and the remaining 70% was used for testing. The confusion matrix is presented on the right of Table I. Figure 9 shows some correct classification samples and failed cases. The left most three columns are correctly classified samples, and the right most fourth column shows the failed cases. The first row is the benign tissue where the last one is misclassified as cancer class II. The second row represents cancer I while the last tissue image is misclassified as benign. The last row is the cancer II, and the last image is misclassified as cancer I. In Figure 9 we show the large intra-class variances and inter-class similarities which produced the classification errors.
TABLE I.
The confusion matrix shows three classes classification accuracy using multi-class gentle adaboost and 30% images as the training set
| Benign | Cancer I | Cancer II | |
|---|---|---|---|
| Benign | 84.5 | 6.4 | 7.1 |
| Cancer I | 6.8 | 81.2 | 13.8 |
| Cancer II | 8.7 | 12.4 | 79.1 |
Fig. 9.

The multi-class classification results using the gentle AdaBoost. The left three columns are correct classified samples and the right fourth column shows the failed cases. The first row is the benign samples. The second and third rows are the cancer samples.
From all these experiments, it was shown that the gentle AdaBoost provided satisfactory results on both binary and multi-class classification of breast tissue images. We obtained an average 89% accuracy in separating benign from cancer tissue and an average accuracy of 80% in classifying two types of breast cancers from benign. In both cases only 30% of the images were used in the training.
VI. Conclusion
We have presented a Grid-enabled framework which utilized texton histograms to perform high throughput analysis of digitized breast cancer specimens. Experimental results have shown that a gentle AdaBoost classifier using an eight node CART decision tree as the weak learner provided the best results. We present the classification results of separating benign from cancer and two other subclasses of breast cancer. Multi-class classification errors increase significantly as the number of classes increased. In future work, we plan to expand the reference library of texton signatures and develop a robust multi-class classification algorithm to further classify among subtypes of breast cancer. We also plan to expand our studies to include a wide range of cancers, including colon cancer, head & neck, for which we have already generated the texton reference libraries using IBM World Community Grid.
Acknowledgments
This research was funded, in part, by grants from the NIH through contract 5RO1EB003587-03 from the National Institute of Biomedical Imaging and Bioengineering and contract W81XWH-06-1-0514 from the Department of Defense. UMDNJ wants to thank and acknowledge IBM for providing free computational power and technical support for this research through World Community Grid. For further information about World Community Grid, please view the IBM link [12], [13]. The authors are also grateful to The Cancer Institute of New Jersey and the Hospital of the University of Pennsylvania for the specimens and support that they have provided for this research.
Biographies

Lin Yang is an assistant professor with the department of Radiology in the UMDNJ-Robert Wood Johnson Medical School. His research interests include different areas of medical imaging, computer vision and machine learning. He is also working on the design and development of content-based image and video retrieval and 2D/3D medical image analysis including tumor detection, segmentation, registration and tracking.
Lin Yang received the B. S. degree in the department of Electrical and Computer Engineering from Xian Jiaotong University, Xian, Shaanxi, P.R. China. in 1999 and the M.S. degree in the Image Processing Center of Xian Jiaotong University, Xian, Shaanxi, P.R. China in 2002. He received another M. S. degree and the Ph. D. degree both in the department of Electrical and Computer Engineering, Rutgers University in 2006 and 2009, respectively. He joined the faculty in the department of Radiology in University of Medical and Dentistry of New Jersey in 2009. He also serves as a senior research staff member in the Center for Biomedical Imaging & Informatics (CBII) since 2009.
Wenjin Chen received the Bachelor of Medicine degree from Beijing Medical University (now Peking University Health Science Center), Beijing, China in 1997 and the Ph.D. degree in Computational Molecular Biology from the University of Medicine and Dentistry of New Jersey (UMDNJ) and Rutgers University, Piscataway, NJ, in 2005. She is currently serving as Associate Director, Biomedical Imaging at Center for Biomedical Imaging and Informatics, UMDNJ, Piscataway, NJ. Her research interests include tissue microarray analysis, digital microscopy, image pattern recognition and medical informatics.
Peter Meer received the Dipl. Engn. degree from the Bucharest Polytechnic Institute, Romania in 1971, and the D.Sc. degree from the Technion, Israel Institute of Technology, Haifa, in 1986, both in electrical engineering. From 1971 to 1979 he was with the Computer Research Institute, Cluj, Romania, working on R&D of digital hardware. Between 1986 and 1990 he was Assistant Research Scientist at the Center for Automation Research, University of Maryland at College Park. In 1991 he joined the Department of Electrical and Computer Engineering, Rutgers University, Piscataway, NJ and is currently a Professor. He has held visiting appointments in Japan, Korea, Sweden, Israel and France, and was on the organizing committees of numerous international workshops and conferences. He was an Associate Editor of the IEEE Transaction on Pattern Analysis and Machine Intelligence between 1998 and 2002, is a member of the Editorial Board of Pattern Recognition, and was a Guest Editor of Computer Vision and Image Understanding for a special issue on “Robust Statistical Techniques in Image Understanding”. He is coauthor of an award winning paper in Pattern Recognition in 1989, the best student paper in the 1999 and the best paper in the 2000 IEEE Conference on Computer Vision and Pattern Recognition. His research interest is in application of modern statistical methods to image understanding problems.
Gratian Salaru received the M.D. degree from the University of Medicine and Pharmacy Timisoara, Romania in 1995. After three years of Forensic Pathology at the “Mina Minovici” Institute of Forensic Medicine, Timisoara, Romania, he completed an additional five years of training and graduated from the Pathology residency program at Robert Wood Johnson Medical School/UMDNJ in 2004. He completed a fellowship in Hematopathology at the same institution in 2006. He is board certified in Anatomical and Clinical Pathology and is currently an Assistant Professor of Pathology and Laboratory Medicine at Robert Wood Johnson Medical School/UMDNJ, New Brunswick, NJ. His research interests focus on areas of clinical pathology, rapid HIV testing, digital microscopy, medical informatics and hematopathology.
Lauri Goodell, MD received her Medical degree from UMDNJ- Robert Wood Johnson Medical School in 1991. She is currently Associate Professor and Director of Hematopathology in the Department of Pathology and Laboratory Medicine at UMDNJ-RWJMS as well as Director of the Immunohistochemistry Core Research Lab at the Cancer Institute of New Jersey. Her research interests include pathophysiology of hematopoietic diseases, proteomics, image pattern recognition and telepathology.

Viktors Berstis is a Senior Software Engineer and Master Inventor at the IBM Corporation in Austin Texas. His experience at IBM includes architecting the System/38 - AS/400, developing various compilers, research on high-level automated integrated circuit design, and OS/2. Currently he is the technical lead and scientist for World Community Grid, where he also helps researchers exploit grid computing in their projects. With degrees from the University of Michigan, he is a senior member of the IEEE, and has over 130 US patents. His hobbies include radio controlled airplanes, SCUBA diving, 3D stereoscopic photography, playing the piano, exploiting solar energy and making all sorts of gadgets.

David J. Foran (S89-M91) received the B.S. degree from Rutgers University, New Brunswick, NJ, in 1983 and the Ph.D. degree in biomedical engineering from the University of Medicine and Dentistry of New Jersey (UMDNJ) & Rutgers University, Piscat-away, NJ, in 1992. He served as a Physics Instructor at New Jersey Institute of Technology, Newark, NJ, from 1984 to 1985 and worked as a Junior Scientist at Johnson & Johnson Research, Inc., North Brunswick, NJ, from 1986 to 1988. He received one year of post-doctoral training at the Department of Biochemistry at UMDNJ-Robert Wood Johnson Medical School (RWJMS) in 1993. He joined the faculty at RWJMS in 1994 where he is currently a Professor of Pathology & Radiology and the Director of the interdepartmental Center for Biomedical Imaging & Informatics. Dr. Foran also serves as the Associate Director for Research for the university-wide Informatics Institute. He is a member of the graduate faculty in the Program in Computational Molecular Biology and Genetics and he is a Research Associate Professor at the Center for Advanced Information Processing, both at Rutgers University. His research interests include quantitative, biomedical imaging, computer-assisted diagnosis, and medical informatics.
Contributor Information
Lin Yang, Department of Electrical and Computer Engineering, Rutgers University, Piscataway, NJ, 08854 and The Cancer Institute of New Jersey, New Brunswick, NJ, 08903.
Wenjin Chen, The Cancer Institue of New Jersey, New Brunswick, NJ, 08903.
Peter Meer, Department of Electrical and Computer Engineering, Rutgers University, Piscataway, NJ, 08854.
Gratian Salaru, Department of Pathology, UMDNJ-Robert Wood Johnson Hospital, New Brunswick, NJ, 08903.
Lauri A. Goodell, Department of Pathology, UMDNJ-Robert Wood Johnson Hospital, New Brunswick, NJ, 08903
Viktors Berstis, IBM research, Austin, TX, 73301.
David J. Foran, Center for Biomedical Imaging & Informatics, UMDNJ-Robert Wood Johnson Medical School, Piscataway, NJ, 08854 and The Cancer Institute of New Jersey, New Brunswick, NJ, 08903.
References
- 1.American Cancer Society. Cancer Facts and Figures 2007. 2007. American Cancer Society; 2007. [Google Scholar]
- 2.U. S. Cancer Statistics Working Group. United states cancer statistics: 2003 incidence and mortality (preliminary data) National Vital Statistics. 2004;53(5) [Google Scholar]
- 3.Kononen J, Bubendorf L, Kallioniemi A, Barlund M, Schraml P, Leighton S, Torhorst J, Mihatsch MJ, Sauter G, Kallioniemi OP. Tissue microarrays for high-throughput molecular profiling of tumor specimens. Nature Medicine. 1998;4:844–847. doi: 10.1038/nm0798-844. [DOI] [PubMed] [Google Scholar]
- 4.Rimm DL, Camp RL, Charette LA, Costa J, Olsen DA, Reiss M. Tissue microarray: A new technology for amplification of tissue resources. Cancer Journal. 2001;7:24–31. [PubMed] [Google Scholar]
- 5.Torhorst J, Bucher C, Kononen J, Haas P, Zuber M, ORK, et al. Tissue microarrays for rapid linking of molecular changes to clinical endpoints. American Journal of Pathology. 2001;159:2249–2256. doi: 10.1016/S0002-9440(10)63075-1. [DOI] [PMC free article] [PubMed] [Google Scholar]
- 6.Zhang D, Tellz MS, Putti TC. Reliability of tissue microarrays in detecting protein expression and gene amplification in breast cancer. Modern Pathology. 2003;16:79–84. doi: 10.1097/01.MP.0000047307.96344.93. [DOI] [PubMed] [Google Scholar]
- 7.Mucci NR, Akdas G, Manely S, Rubin MA. Neuroendocrine expression in metastatic prostate cancer: Evaluation of high throughput tissue microarrays to detect heterogeneous protein expression. Human Pathology. 2000;31:406–414. doi: 10.1053/hp.2000.7295. [DOI] [PubMed] [Google Scholar]
- 8.Gulmann C, Butler D, Kay E, Grace A, Leader M. Biopsy of a biopsy: Validation of immunoprofiling in gastric cancer biopsy tissue microarrays. Histopathology. 2003;42:70–76. doi: 10.1046/j.1365-2559.2003.01556.x. [DOI] [PubMed] [Google Scholar]
- 9.Suri JS, Rangayyan RM. Recent Advances in Breast Imaging, Mammography, and Computer-Aided Diagnosis of Breast Cancer. SPIE; 2006. [Google Scholar]
- 10.Yang L, Meer P, Foran D. Unsupervised segmentation based on robust estimation and color active contour models. IEEE Trans on Information Technology in Biomedicine. 2005;9:475–486. doi: 10.1109/titb.2005.847515. [DOI] [PubMed] [Google Scholar]
- 11.IBM Help Defeat Cancer. 2007 “ http://pleiad.umdnj.edu/ibm,”.
- 12.Wikipedia. 2007 “ http://en.wikipedia.org/wiki/help_defeat_cancer,”.
- 13.IBM World Community Grid. 2007 “ http://www.worldcommunitygrid.org,”.
- 14.Chen W, Reiss M, Foran DJ. Unsupervised tissue microarray analysis for cancer research and diagnosis. IEEE Trans on Information Technology in Biomedicine. 2004;8(2):89–96. doi: 10.1109/titb.2004.828891. [DOI] [PubMed] [Google Scholar]
- 15.Laws KI. PhD Thesis. University of Southern California; 1980. Texture Image Segmentation. [Google Scholar]
- 16.Haralik R, Shanmugan K, Dinstein I. Texture features for image classification. IEEE Trans on System, Man and Cybernetics. 1973;3:610–621. [Google Scholar]
- 17.Galloway R. Texture analysis using gray level run lengthes. Computer Graphics Image Processing. 1975;4:172–179. [Google Scholar]
- 18.Mao J, Jain A. Texture classification and segmentation using multiresolution simultaneous autoregressive models. Pattern Recognition. 1992;25:173–188. [Google Scholar]
- 19.Leung T, Malik J. Representing and recognizing the visual appereance of materials using three-dimensional textons. International Journal on Computer Vision. 2001;43(1):29–44. [Google Scholar]
- 20.Varma M, Zisserman A. Classifying images of materials: Achieving viewpoint and illumination independence. European Conference on Computer Vision. 2002;3:255–271. [Google Scholar]
- 21.Cula O, Dana K. 3D texture recognition using bidirectional feature histograms. International Journal on Computer Vision. 2004;59(1):33–60. [Google Scholar]
- 22.Yang L, Meer P, Foran DJ. Multiple class segmentation using a unified framework over mean-shift patches. IEEE Conference on Computer Vision and Pattern Recognition; 2007. [DOI] [PMC free article] [PubMed] [Google Scholar]
- 23.Heeger D, Bergen J. Pyramid-based texture analysis/synthesis. SIGGRAPH ’95: Proc. of the 22nd Annual Conf. on Computer Graphics and Interactive Techniques; 1995. pp. 229–238. [Google Scholar]
- 24.Lazebnik S, Schmid C, Ponce J. Beyond bags of features: Spatial pyramid matching for recognizing natural scene categories. IEEE Conference on Computer Vision and Pattern Recognition. 2006;2:2169–2178. [Google Scholar]
- 25.Shotton J, Winn J, Rother C, Criminisi A. Textonboost: Joint appearance, shape and context modeling for multi-class object recognition and segmentation. European Conference on Computer Vision. 2006;1:1–13. [Google Scholar]
- 26.Leung T, Malik J. Representing and recognizing the visual appearance of materials using three-dimensional textons. International Journal on Computer Vision. 2001;43(1):29–44. [Google Scholar]
- 27.Schmid C. Constructing models for content-based image retrieval. IEEE Conference on Computer Vision and Pattern Recognition. 2001;2:39–45. [Google Scholar]
- 28.Duda RO, Hart PE, Stork DG. Pattern Classification. 2. Wiley-Interscience; 2000. [Google Scholar]
- 29.Tenebaum J, de Silva V, Langford J. A global geometric framework for nonlinear dimensionality reduction. Science. 2000;290(5500):2319–2323. doi: 10.1126/science.290.5500.2319. [DOI] [PubMed] [Google Scholar]
- 30.Borg I, Groenen P. Modern Multidimensional Scaling: theory and applications. 1. Springer-Verlag; New York: 1997. [Google Scholar]
- 31.Kohavi R. A study of cross-validation and bootstrap for accuracy estimation and model selection. The 14th International Joint Conference on Artificial Intelligence. 1995;2(12):1137–1143. [Google Scholar]
- 32.Oliver A, Freixenet J, Marti R, Zwiggelaar R. A comparison of breast tissue classification techniques. Medical Image Computing and Computer-Assisted Intervention. 2006;4191:872–879. doi: 10.1007/11866763_107. [DOI] [PubMed] [Google Scholar]
- 33.Cortes C, Vapnik V. Support vector networks. Machine Learning. 1995;20:1–25. [Google Scholar]
- 34.Freund Y, Schapire RE. Experiments with a new boosting algorithm. Machine Learning. 1996:148–156. [Google Scholar]
- 35.Shawe-Taylor J, Cristianini N. Kernel Methods for Pattern Analysis. 1. Cambridge University Press; 2004. [Google Scholar]