

Abstract
Development of non-invasive and accurate methods to track cell fate following delivery will greatly expedite transition of embryonic stem (ES) cell therapy to the clinic. Here we describe a protocol for the in vivo monitoring of stem cell survival, proliferation, and migration using reporter genes. We established stable ES cell lines constitutively expressing double fusion (DF; enhanced green fluorescent protein and firefly luciferase) or triple fusion (TF; monomeric red fluorescent protein, firefly luciferase, and herpes simplex virus thymidine kinase) reporter genes using lentiviral transduction. We used fluorescence activated cell sorting to purify these populations in vitro, bioluminescence imaging and positron emission tomography imaging to track them in vivo, and fluorescence immunostaining to confirm the results ex vivo. Unlike other methods of cell tracking such as iron particle and radionuclide labeling, reporter genes are inherited genetically and can be used to monitor cell proliferation and survival for the lifetime of transplanted cells and their progeny.
Keywords: embryonic stem cells, molecular imaging, bioluminescence imaging, fluorescence imaging, positron emission tomography imaging, magnetic resonance imaging
INTRODUCTION
Embryonic stem (ES) cells are capable of differentiation into any somatic cell type of the human body and have the potential for unlimited self renewal 1. As a result, these cells have been regarded as a leading candidate source for donor cells in regenerative medicine. Before ES cells can be safely applied clinically, however, it is important to understand the in vivo behavior of ES cells and their derivatives. Conventional histology and reporter genes such as green fluorescent protein (GFP) and β-galactosidase (LacZ) do not allow for longitudinal imaging of cells that have been injected into animals because these methods require animal sacrifice and at best only provide a “snapshot” of the biological fate of transplanted cells 2, 3. Recent advances in the field of molecular imaging have made it possible to non-invasively track transplanted cells over time 4. These modalities include physically attaching labels to cells as in the case of iron particles, radionuclide probes, and quantum dots, or introducing reporter genes into cell lines to obtain the cell-mediated generation of reporter probes 5.
Traditional methods of imaging cell delivery in vivo have typically relied upon physical cell labeling as these modalities provide a straightforward approach to visualizing transplanted cells in living subjects 6, 7. Physical cell labeling is completed before cell administration and can be accomplished with superparamagnetic iron oxide (SPIO) particles for magnetic resonance imaging (MRI) 8, 9 nanoparticle labeling for fluorescent imaging 10, 11, or radionuclide labeling for single positron emission computed tomography (SPECT) or positron emission tomography (PET) 12. Physical cell labeling allows high spatial resolution (MRI) and high sensitivity (SPECT or PET) imaging and is best used to track the in vivo localization of cells in the hours to days following delivery. However, a common drawback these methods share is their reliance on physical labels. SPIO and radionuclide probes are diluted with cell division and are not capable of tracking cell proliferation, especially when cells misbehave as in the case of ES cell-derived teratoma formation 13. SPIO agents further suffer from the unique problem of being taken up by macrophages after donor cell death (which may continue to produce signal even after cell death), and hence cannot be used to accurately monitor long-term cell survival and behavior 14. By comparison, SPECT or PET tracers lose signal due to radioisotope decay. A typical PET radioisotope such as F-18 has a half-life of only 110 minutes and can only be used to image cells in the hours immediately following cell delivery 15. Other isotopes such as 99mTechnetium and 111Indium have half-lives on the order of 6 hours and 2.8 days, respectively, and can be used to image cells for several hours to close to a week 16, 17. However, in these studies, because cells are exposed to longer periods of radioactivity, impairment of cellular proliferation and differentiation may be an issue.
In contrast with physical cell labeling modalities, reporter gene imaging is well suited for longitudinal imaging of cell survival. In this type of imaging, a gene coding for the synthesis of a detectable protein is introduced into a target cell line or tissue via viral or non-viral vectors. Examples of commonly used reporter genes include firefly luciferase (Fluc) and herpes simplex virus thymidine kinase (HSVtk), which can be detected by bioluminescence imaging (BLI) and PET, respectively 5. Reporter genes can be inserted after a constitutive promoter such as ubiquitin, or after a tissue specific promoter such as myosin light chain in the case of cardiomyocytes 18. BLI has a sensitivity on the order of 10−15 to 10−17 mol L−1, whereas the sensitivity of PET is 10−10 to 10−11 mol L−1, and MRI has a sensitivity of only 10−3 to 10−5 mol L−1 5. Importantly, because active transcription of the reporter gene is a prerequisite for synthesis of the reporter protein, only cells that are alive yield positive imaging signals. Several studies have shown that BLI signals correlate robustly with cell numbers both in vitro and in vivo 19, 20. Hence, changes in signals following cell administration can be used as indicators of cell engraftment or cell death. In addition, because the reporter gene integrates into the host cell’s chromosome following stable transfection or transduction, the reporter gene is passed on from the mother cell to daughter cell. Genetic inheritance of the reporter gene thus permits monitoring of donor cell proliferation (e.g., ES cell-derived teratoma formation). Finally, genomic and proteomic studies have shown that reporter genes do not significantly affect ES cell viability, proliferation, or differentiation 21, 22.
Using BLI and PET reporter gene imaging, our laboratory has successfully monitored the survival, proliferation, and migration of transplanted ES cells 19, 23, 24 and their derivatives, such as cardiomyocytes 25 and endothelial cells 13, 26 over a prolonged period without necessitating animal sacrifice. We have also monitored immunogenic response against ES cell engraftment in syngeneic, allogeneic, and xenogenic transplantation models 23, 24. As reporter genes can be inserted after any promoter, this approach can also be used to monitor expression of target genes in developmental pathways and disease models. Our group has successfully applied BLI in this fashion to investigate patterns of STAT3 expression in embryoid body formation 27 and to track plasmid-mediated transgene expression for short hairpin RNA interference therapy in C2C12 myoblasts 28.
For delivery of the reporter gene, our group has employed both a double fusion (DF) construct containing enhanced green fluorescent protein (eGFP) and firefly luciferase (Fluc) and a triple fusion (TF) construct containing monomeric red fluorescent protein (mRFP), Fluc, and HSVtk (Figure. 1a). When stably integrated into the genome of the cells, these constructs permit the longitudinal tracking of transfected cells using a multimodality imaging approach. Specifically, eGFP and mRFP reporter genes facilitate fluorescence microscopy and FACS sorting of GFP/RFP positive cells, whereas the Fluc and HSVtk reporter genes allow for cell monitoring via BLI and PET, respectively. Interaction of Fluc with its substrate D-luciferin produces low intensity light (2–3 eV) that is detected by an ultrasensitive cooled charge-coupled device (CCD) camera for cell localization (Figure. 1b). The reporter protein HSVtk phosphorylates its substrate, the PET reporter probe 9-4-[18F]fluoro-3-(hydroxylmethylbutyl) guanine ([18F]-FHBG), to produce high-energy photons (511 keV). These photons are then captured by the PET camera for cell localization (Figure. 1b) in a fashion identical to radiotracer based PET imaging. The advantage of reporter gene PET imaging over radiotracer labeled PET imaging is that constitutive expression of the reporter protein HSVtk allows for longitudinal tracking of cell survival and localization without the constraint of label decay.
Figure 1.
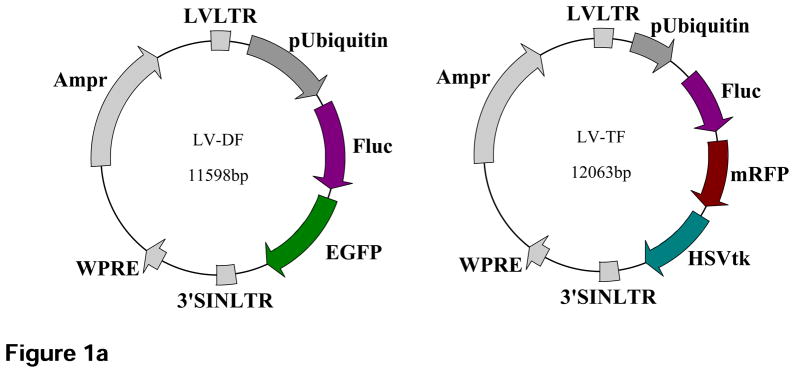

Schematic diagram of the DF and TF lentiviral constructs as well as the underlying mechanism of each imaging modality. (a) The DF construct contains enhanced green fluorescent protein (eGFP) and firefly luciferase (Fluc) reporter genes linked by 5 amino acid linker (GSHGD). The TF construct contains monomeric red fluorescent protein (mRFP), Fluc, and herpes simplex virus thymidine kinase (HSVtk) reporter genes, with the 3 fusion proteins joined by a 14-amino acid (LENSHASAGYQAST) and 8-amino acid (TAGPGSAT) linker, respectively. (b) Diagram illustrating the mechanism of each imaging modality based on their respective reporter genes using the TF construct as an example.
The choice of whether to use physical cell labeling or reporter gene modalities for in vivo imaging of transplanted cells depends on the subject of investigation, timeline of study, equipment available at a given institution, and evaluation of the advantages and disadvantages of each technique (Figure. 2). However, it is important to note that the use of separate imaging modalities such as MRI, PET, SPECT, or BLI is not mutually exclusive. Multimodality imaging approaches may minimize the potential drawbacks of using each imaging modality alone and a tailored combination of 2 or more techniques may be the best approach for a given experiment.
Figure 2.

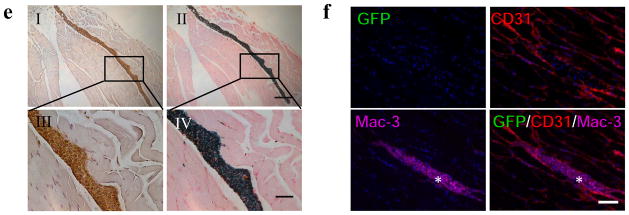
Comparison of physical labeling vs. reporter gene labeling for tracking fate of transplanted human ES cells and human ES cell-derived endothelial cells (hESC-ECs). (a) Approximately 1 × 10⁶ DF hES cells were co-labeled with iron particles and then transplanted into the right hind limb. An equal number of hESC-ECs were injected into the left hind limb. At day 28, bulky expansion of the left hind limb due to hES cell-derived teratoma formation (arrowhead) can be seen by MRI. (b) Quantitative analysis show relatively constant MRI signal activities for both hES cells and hESC-ECs over 4 weeks (signal activity is expressed as arbitrary units (AUs)). (c) BLI imaging of the same animal in (a). (d) Quantitative analysis of BLI signals (photons/second/cm2/steridin) from all animals transplanted with hES cells versus hESC-ECs. Note that the y-axis is shown as log 10 scale. (e) Staining for macrophages and iron 4 weeks after transplantation of hESC-ECs. Immunostaining of Mac-3 for macrophages (eI, eIII) and Prussian blue for iron (eII, eIV) was counterstained with hematoxylin and nuclear fast red, respectively. Note that macrophages loaded with iron particles could be found in between muscle bundles. Scale bars = 100 μm (eI, eIII) and 20 μm (eII, eIV). (f) Immunofluorescence staining of GFP for transplanted hESC-ECs, CD31 for microvasculature of hind limb, and Mac-3 for macrophages at 4 weeks after transplantation. No GFP+ hESC-ECs detected nearby the macrophages because of their poor survival after transplantation. Nuclei were stained with 4,6-diamidino-2-phenylindole (DAPI) (blue). Scale bar = 20 μm. Scale bar = 20 μm. Appropriate animal protocol has been approved by the Administrative Panel on Laboratory Animal Care of Stanford University. Data were reproduced with permission from ref. 13.
Reporter gene imaging suffers from several drawbacks. First, derivation of stable DF and TF reporter gene positive cell lines typically takes 2–4 weeks, whereas preparation for iron particle or radioactive probe labeling can be completed within hours. Second, the spatial resolution of common reporter gene modalities such as PET or BLI is close to 1 mm3 or 3 mm3, respectively, whereas MRI has a spatial resolution of 25–100 μm. BLI can only provide a general anatomical location of where the cells have engrafted because deep tissue attenuates light. Because photons generated by the interaction of Fluc and D-luciferin can only penetrate 1–2 cm of tissue, this technology is primarily limited to small rodent models at the present time. By comparison, PET reporter gene imaging does not have these constraints as photons emitted from the phosphorylation of [18F]-FHBG are relatively high energy 5. The use of the HSVtk reporter gene and [18F]-FHBG reporter probes have recently been demonstrated to track mesenchymal stem cell fate in a porcine model 29 and cytolytic T cells in humans 30. Third, the introduction of reporter genes has the potential to alter cellular genome and phenotype.
This protocol details how reporter gene imaging may be used to monitor the engraftment, survival, and proliferation of transplanted ES cells. We hope it may be used in conjunction with other imaging technologies such as MRI and radiotracer based techniques to answer a wide range of biological questions.
EXPERIMENTAL DESIGN
Generation of DF/TF constructs and stable ES cell lines
The DF and TF lentiviral vectors can be constructed using the conventional molecular cloning techniques based on restriction enzymes, For general information of cloning techniques, please see ref. 31. We have used a constitutive ubiquitin promoter to replace the cytolomegavirus (CMV) promoter to reduce potential transgene silencing after extended cell culture 32. We use PEG-it Lentivirus Concentration Solution to precipitate and concentrate the lentiviral particles, which results in lower toxicity to the transduced ES cells compare to viruses concentrated by ultracentrifugation. The choice of cell type depends on the focus of specific studies and whether the cells are suitable for stable cell line generation. Our lab has generated several DF and TF mouse and human ES cell lines such as the mouse D3 and human H7, H9, and HES2 lines using the protocol described below. In our experience, mouse ES cells are easier to form undifferentiated colonies on the mouse embryonic fibroblast (MEF) feeder layer from FACS sorted single cells compare to human ES cells, and thus easier to be isolated from surrounding MEFs. We therefore typically transduce mouse ES cells on feeder layers, whereas human ES cells are transduced under feeder-free conditions to eliminate any contamination from GFP/RFP positive MEFs. Using a multiplicity of infection (MOI) of 10 usually gives rise to the highest transduction efficiency for ES cells. The optimal MOI for other type of cells should be experimentally determined. When transducing ES cells, colony sizes of 200–400 cells/colony usually yield the highest transduction efficiency. If the ES cell colonies are too large, cells that are compacted in the center will not be readily transduced. Successful transduction can be verified by observing the GFP/RFP positive cells under a fluorescence microscope and the approximate transduction efficiency can be calculated by counting GFP/RFP positive and negative cells using flow cytometry. Generally a transduction efficiency of 30–40% is sufficient for FACS and subsequent subculture. Slightly lower transduction efficiency is tolerable but requires more starting cells for sorting. We recommend cryopreserving some of the ES cells derived from the first round of FACS sorting and expansion for any future experiments. A second round of FACS sorting for GFP/RFP following the initial subculture is needed to further isolate a highly purified population of cells that are positive for GFP/RFP. Following each round of sorting, some ES cell colonies may differentiate. Therefore, isolated mouse and human ES cells should be seeded on a MEF feeder layer and only colonies that are characterized by typical ES cell morphologies 33, 34 (refractive appearance, defined boundaries, and high nuclear-to-cytoplasm ratio within individual cells) should be subcultured. The highly purified DF or TF ES cells that expanded from the second round of sorting are ready for transplantation into experimental animals.
BLI and PET imaging
After establishing the DF/TF stable cell line, BLI of reporter gene positive cells growing on cell culture plates is helpful to determine whether the Fluc transgene is functional. This assay will also confirm that BLI signals (plotted in units of maximum photons per second per centimeter square per steridin (photons/s/cm2/sr)) correlate with cell numbers (Figure 3, a and b). For transplanting ES cells into animals, the DF/TF ES cells are usually trypsinized and collected as a single cell suspension. For in vivo imaging, the minimum number of cells detectable by BLI is approximately 100–500 cells 35 and 1,000 cells/mm3 for small animal PET imaging 36. However, this detection threshold number can vary depending on the robustness of the promoter or enhancer element used to drive the reporter gene, the specific cell type, and the amount of reporter probe used in each study. Typically our laboratory has used anywhere from thousands to millions of cells for purposes of injection and longitudinal monitoring of cell survival. While there is no ‘set’ amount of luciferin or [18F]-FHBG to administer to animals for BLI or PET imaging, respectively, delivery of inadequate reporter probe may compromise visualization of signal. Our laboratory has successfully imaged cell survival using a D-luciferin concentration of 375 mg/kg animal body weight for BLI and an [18F]-FHBG activity of ~200 μCi for microPET 37. Animals that receive transplantations of non-transduced cells can be used as negative controls to determine the background BLI and PET signals. Afterwards, cells can be imaged non-invasively at any time-point following transplantation. In the case of ES cells, acute cell death following transplantation will be observed for the first one or two weeks, after which the remaining cells will proliferate and eventually cause teratoma formation. To monitor this bimodal process, our laboratory has traditionally imaged animals receiving transplantation of ES cell or ES cell derivatives at day 0, day 2, day 7, day 10, day 14, and weekly thereafter for up to one year using BLI 25. By comparison, we have typically taken microPET images at weekly intervals due to the high cost and temporal constraints of [18F]-FHBG production and radionuclide decay. In both BLI and microPET, increases in signal indicative of cell proliferation and teratoma formation can be observed as early as the second or third weeks following ES cell transplantation. The choice of anatomical location to inject cells depends on the focus of investigation. The majority of our experiments have revolved around myocardial injection (Figure. 3) due to our group’s focus on cardiovascular disease 19, 25. However, we have also used other locations such as the gastrocnemius muscle (Figure. 2) 13, 23, 24, kidney capsule, and subcutaneous injection 23, 38. Certain locations such as the kidney and heart require technical expertise for injection. For general tracking of cell survival in vivo, we recommend delivering cells to an easily accessible location such as leg muscle or subcutaneous regions of the dorsal flank.
Figure 3.

Bioluminescence imaging of transplanted ES cells. (a) Ex vivo BLI of undifferentiated DF human ES cells (H9 line). The numbers on top of the bioluminescence images indicate the number of cells seeded in the culture dish. Representative images from replicate experiments are shown. (b) Linear correlation of cell numbers and BLI signals (photons/second/cm2/steridin) in (a) (R2=0.99). (c) Tracking in vivo kinetics of transplanted DF hES cells and DF hES cell-derived cardiomyocytes with BLI. Representative images from a single animal receiving intramyocardial injection of 1×10⁶ undifferentiated DF hES cells (upper panel) or DF hES-derived cardiomyocytes (lower panel) are shown. Images were taken at the time point as indicated. Appropriate animal protocol has been approved by the Administrative Panel on Laboratory Animal Care of Stanford University. Data in c were reproduced with permission from ref. 25.
Operation of BLI and PET reporter gene imaging requires the use of equipment such as a Xenogen In Vivo Imaging System and a MicroPET scanner (see equipment set up below). For operation of these machines, manufacturer’s instruction should be followed. For BLI, users must have access to the software program Living Image (Caliper Life Sciences) and be able to administer D-luciferin via intra-peritoneal injection to study animals. The use of the PET scanner requires training in radiation safety as [18F]-FHBG is a radioactive probe. Typically, [18F]-FHBG is administered via tail vein injection and imaged at 60 minutes post injection to allow for adequate biodistribution and background clearance of the tracer. Animals that have not received cell injection may be used as controls to determine background signal. A software program such as ASI Pro (Concorde Microsystems) can be used to acquire images and calculate tracer uptake in units of injected dose per gram of heart (%ID/g).
MATERIALS
REAGENTS
eGFP-Fluc double fusion construct (available in our laboratory upon request)
mRFP-Fluc-HSVtk triple fusion construct (available in our laboratory upon request)
HEK293FT (Invitrogen, cat. no. R700-07)
psPAX2 (Addgene, cat. no. 12260)
pMD2G (Addgene, cat. no. 12259)
Opti-MEM I reduced-serum medium (Invitrogen, Gibco, cat. no. 31985)
Lipofectamine 2000 (Invitrogen, cat. no. 11668-019)
5x PEG-it Lentivirus Concentration Solution (System Biosciences, cat. no. LV810A-1)
Mouse embryonic stem cell line D3 (ATCC, cat. no. CRL-1934)
Human embryonic stem cell lines H7, H9 and HES2 (National Stem Cell Bank, NSCB)
DMEM, high glucose with L-glutamine (Invitrogen, Gibco, cat. no. 11965)
FBS (Invitrogen, Gibco, cat. no. 10437)
FBS, defined (Hyclone, cat. no. SH30070.03)
Penicillin/streptomycin (Invitrogen, Gibco, cat. no. 15070)
Nonessential amino acids (Hyclone, cat. no. SH30853)
mTeSR-1 (Stemcell Technologies, cat. no. 05850)
Matrigel, ES qualified (BD Biosciences, cat. no. 354277)
Gelatin (Sigma, cat. no. G1890)
Polybrene (Sigma, cat. no. H9268-5G)
Knockout DMEM (Invitrogen, Gibco, cat. no. 10829)
PBS, without Ca2+ and Mg2+ (Invitrogen, Gibco, cat. no. 10010)
Cell disassociation buffer (Invitrogen, Gibco, cat. no. 13151)
0.05% trypsin-EDTA (Invitrogen, Gibco, cat. no. 25300)
Propidium iodide buffer (Biosource, cat. no. PNN1011)
Antibiotic/antimycotic solution, 100x (Mediatech, cat. no. 30-004-CI)
Leukemia inhibitory factor (LIF) (Chemicon, cat. no. ESG1106)
D-luciferin (Biosynth, cat. no. L-8220)
-
[18F]-FHBG (synthesized with a cyclotron at your institutional radiochemistry facility or contact us at the Molecular Imaging Program at Stanford)
CAUTION [18F]-FHBG is radioactive, please follow your institutional radiation safety procedures when handling.
-
Mice and Rats (either from your in-house strains or purchased from outside provider)
CAUTION Please follow your approved institutional animal protocol to handle the animals.
EQUIPMENT
Cell culture incubator, 95% air and 5% CO2, humidified
Cell culture hood
Hemacytometer
Inverted epifluorescence microscope
Fluorescence activated cell sorter (FACSAria, BD Biosciences)
5 ml round-bottom tube (BD Falcon, cat. no. 352063)
Xenogen In Vivo Optical Imaging System (Xenogen Corporation, see EQUIPMENT SETUP)
MicroPET scanner (see EQUIPMENT SETUP)
REAGENT SETUP
Growth medium for HEK293FT cells and MEFs
DMEM high glucose with L-glutamine, 10% (vol/vol) FBS, 0.5%(vol/vol) penicillin/streptomycin. Store at 4 °C for up to one month.
Mouse ES medium
Knockout DMEM, 15% (vol/vol) FBS defined, 0.1 mM nonessential amino acids, 0.1 mM 2-mercaptoethanol, 1 × 10³ units/ml LIF. Store at 4 °C for up to two weeks or at −20 °C in aliquots for up to three months.
EQUIPMENT SETUP
Xenogen In Vivo Optical Imaging System
The Xenogen optical imaging system consists of a light-tight box with a mounted cooled charge couple device (CCD) camera (IVIS). The system is fully calibrated using a standard “hockey-puck” with scintillation cocktails with four small point sources of light. Standard software routines are provided with the system.
MicroPET Scanner
The small animal PET scanners should be set up following the manufacturer’s instructions. The two scanners we use are manufactured by GE healthcare (eXplore Vista) and Concorde Microsystems (microPET Rodent R4).
PROCEDURES
Production of EGFP-Fluc double fusion and mRFP-Fluc-HSVtk triple fusion lentiviruses TIMING 4 d
-
1|
Seed ~5 × 10⁶ HEK293FT cells in 10 ml of growth medium per 100mm tissue culture dish and incubate at 37 °C overnight.
-
2|
The next day, mix 12 μg of DF or TF plasmid, 8 μg of psPAX2 packaging plasmid, and 4 μg of pMD2G envelope plasmid with 1.5 ml of Opti-MEM I medium in a 15 ml conical centrifuge tube.
-
3|
Add 60 μl of Lipofectamine 2000 to 1.5 ml of Opti-MEM I medium within a separate 15 ml centrifuge tube. Mix gently and incubate for 5 min at room temperature (20–25 °C).
-
4|
Combine the plasmid/Opti-MEM I medium mixture with the diluted Lipofectamine 2000 and mix gently. Incubate for 20 min at room temperature.
-
5|
Add the total volume (~3 ml) of plasmid:Lipofectamine 2000 mixture dropwise into the 100 mm dish containing HEK293FT cells, incubate for 6 h at 37 °C. Aspirate the transfection medium and add 10 ml of fresh HEK293FT growth medium and incubate at 37 °C.
-
6|
After 24 h of incubation, collect the culture medium (~10 ml) within a 50 ml conical centrifuge tube and add 10 ml fresh HEK293FT growth medium to the cells. Incubate the collected ~10 ml of culture medium containing the viral particles at 4 °C overnight.
CAUTION The supernatant contains packaged lentiviruses that will infect human cells. Please follow your institution’s biosafety level 2 procedures when handling lentiviruses.
-
7|
The next day, collect the culture medium (~10 ml) again and combine it with the ~10 ml of medium collected the previous day. Centrifuge at 4 °C for 15 min at 3000g. Pass the total volume of supernatant (~20 ml) through a 0.45 μm filter and mix with 5 ml of 5x PEG-it Lentivirus Concentration Solution. Incubate at 4 °C overnight.
CRITICAL STEP Incubation of the viral particles:PEG-it mixture should be longer than 12 h at 4 °C.
PAUSE POINT The viral particles:PEG-it mixture can be incubated at 4 °C for up to 2 weeks.
-
8|
Centrifuge the viral particles at 4 °C for 30 min at 1500g. Aspirate the supernatant and centrifuge again for 5 min at 1500g to completely remove the supernatant. Resuspend the pellet (viral particles) with 200 μl of Opti-MEM I medium.
PAUSE POINT The lentiviruses can be stored at −80 °C for up to 3 months.
Lentivirus transduction of ES cells TIMING 3–5 d
-
9|
Prepare Option A mouse ES cells or Option B human ES cells for DF or TF lentivirus transduction
(A) Prepare mouse ES cells for transduction TIMING 1 d
Seed ~3 × 10⁵ inactivated mouse embryonic fibroblasts (MEFs) in 2 ml of growth medium per gelatin-coated well in 6-well tissue culture dish. Incubate at 37 °C for 24 h. For preparing MEFs and gelatin-coated tissue culture dish, please see ref. 34.
Aspirate the growth medium from the MEFs and seed mouse ES cells using 2 ml mouse ES medium (see REAGENT SETUP) onto the MEF feeder layer at ~70%–80% confluence per well. Incubate at 37 °C for 24 h.
(B) Prepare human ES cells for transduction TIMING 2–3 d
Seed human ES cells in 2 ml of mTeSR-1 human embryonic stem cell medium per Matrigel-coated well in 6-well tissue culture dish at ~ 70%–80% confluence. For making matrigel-coated plates, please see ref. 39.
-
Incubate for 48–72 h, aspirate the old medium and refresh with 2 ml of mTeSR-1 every 24 h.
CRITICAL STEP Keep the ES cell colonies at the size of approximately 200–400 cells/colony at the time of transduction for optimal transduction efficiency.
-
10|
Prepare the lentivirus transduction medium by adding the concentrated DF or TF lentiviruses (calculated multiplicity of infection (MOI) = 10, for MOI calculation, see Tiscornia et. al 40) and 5 μl of polybrene (2 mg ml−1) to each 2 ml mouse ES medium or mTeSR-1 within a 15 ml centrifuge tube. Mix gently by pipetting.
-
11|
Aspirate the culture medium from the prepared mouse or human ES cells, add the 2 ml mouse ES medium or mTeSR-1 containing lentiviruses:polybrene complexes per well of a 6-well dish. Incubate for 24 h at 37 °C.
-
12|
Aspirate the lentivirus transduction medium. Add 2 ml of fresh mouse ES medium or mTeSR-1 per well of transduced cells. Incubate at 37 °C for 24–48 h until the cells are ready for FACS sorting.
CRITICAL STEP Verify the success of transduction by observing GFP/RFP expression under an inverted epifluorescence microscope. Ideally at least 30–40% of the cells should be GFP/RFP positive. However, slightly lower transduction efficiency can be tolerated for subsequent FACS sorting.
PAUSE POINT The transduced cells can be expanded and cryopreserved in liquid nitrogen for later use. For cryopreservation of ES cells, please see ref 34.
? TROUBLESHOOTING
Derivation of stable DF or TF ES cell lines TIMING 3–6 weeks
-
13|
One day prior to FACS sorting, seed ~1 × 10⁵ MEFs per gelatin-coated well of a 12-well tissue culture dish. Incubate at 37 °C.
-
14|
Aspirate the culture medium from the transduced ES cells and wash the cells with 1–2 ml of PBS. Add 300 μl of cell disassociation buffer per well and incubate at 37 °C for 2–5 min.
CRITICAL STEP Long incubation time will damage the cells. Monitor the cells under a light microscope to avoid over digestion. Proceed to step 15 when the cells start to detach from one another.
-
15|
Add 2 ml of mouse ES medium or mTeSR-1 per well to neutralize the cell disassociation buffer. Gently resuspend the ES cell colonies into single cells using a 2 ml serological pipet. Add another 3 ml of mouse ES medium or mTeSR-1 to dilute the cell disassociation buffer. Pass the ~5 ml of cell suspension through a 70 μm cell strainer and collect into a 50 ml centrifuge tube.
CRITICAL STEP Resuspend the cells gently to avoid cell death, observe under a light microscope to verify single cell suspension.
-
16|
Centrifuge the cell suspension for 2 min at 500g, 4 °C. Aspirate the supernatant and add 5 ml of PBS to wash the cells by gentle swirling or pipetting.
-
17|
Centrifuge for 2 min at 500g, 4 °C, aspirate the supernatant. Add 1 ml of PBS and propidium iodide buffer (10 μl/2–3 × 105 cells), resuspend the cells gently and transfer into a 5 ml round-bottom tube, incubate on ice.
-
18|
Sort GFP (DF) or RFP (TF) positive cells with a sterile fluorescence activated cell sorter. Adjust the concentration of the sorted cells to greater than 50, 000 ml−1 and seed 1 ml of cells on the prepared MEFs feeder cells within the gelatin-coated well of the 12-well dish from step 13. Let the cells sit for 36–48 h. Aspirate the old medium and refresh with 1 ml of mouse ES medium or mTeSR-1 everyday until the colony size reaches at least ~300–500 cells which are ready for subculturing. This should take about 6–9 days.
CRITICAL STEP Add antibiotic/antimycotic solutions to eliminate possible contamination.
? TROUBLESHOOTING
-
19|
One day prior to picking the GFP/RFP positive colonies, repeat step 13 to prepare MEF feeder cells in a gelatin-coated 12 well tissue culture dish.
-
20|
Under a fluorescence microscope, mark the GFP/RFP positive ES cell colonies with an objective marker. Pick the marked colonies with a glass needle and transfer them with a p200 Gilson pipette into the gelatin-coated well containing MEF feeder cells from step 19.
-
21|
Keep culturing the picked ES cell colonies, remove old medium and refresh with mouse ES medium or mTeSR-1 everyday. Passage the cells every 5–7 days following routine ES cell passaging protocols (for ES cell passaging protocols, see references 33 and 34) until the cells reach confluence within at least 2 wells of the 6-well tissue culture dish.
CRITICAL STEP Only pick GFP or RFP positive colonies with typical ES cell morphology to avoid contamination from differentiated cells. For typical ES cell morphology see ref. 33 and 34.
-
22|
Of the wells containing expanded GFP/RFP positive ES cell colonies that derived from step 21, keep at least one well for further expansion. Maintain and passage the cells following routine ES cell culture and passaging protocols. This is to preserve the GFP/RFP positive ES cell colonies for future sorting.
-
23|
For the remaining GFP/RFP positive ES cell colonies that derived from step 21 (at least one well of a 6-well tissue culture dish), repeat steps 13–21 for a second round of FACS sorting and screening for the GFP/RFP positive ESC colonies. Keep expanding the cells following routine ES cell culturing and passaging protocols.
PAUSE POINT The cells expanded from this second round of FACS sorting and expansion can be cryopreserved in liquid nitrogen for future experiments.
Measure ex vivo bioluminescence reporter gene activities TIMING 1 h
-
24|
For the established stable DF or TF ES cells from step 23, trypsinize (use appropriate volume of trypsin for different culture format, for example 0.3 ml of trypsin for a well of 6 well dish) the cells for 1 min at 37 °C and resuspend the cells into a single cell suspension in growth medium by pipetting. Count the cells with a hemacytometer.
-
25|
Seed a series of serially diluted cells (for example, a 2 fold dilution of 1 × 10⁶ cells) in 0.5 ml of mouse ES medium or mTeSR-1 in a 24-well tissue culture dish (see Fig. 3a).
-
26|
Aspirate the culture medium and add 0.4 ml of 4.5 μg ml−1 D-luciferin in PBS to cover the cells and immediately image the cells with a Xenogen In Vivo Imaging System (IVIS) (see EQUIPMENT SETUP)
-
27|
Plot the bioluminescence data in units of maximum photons per second per centimeter square per steridin (photons/s/cm2/sr) for a fixed region of interest (ROI) against cell number using Microsoft Excel or another graphing software program (see Fig. 3b).
Transplantation of DF or TF ES cells into animals TIMING 1–3 h
-
28|
Repeat step 24, count the cells and transfer the appropriate number of cells (our laboratory generally aims for at least 1 × 10⁶ cells per injection site although we have used as few as 1 × 10⁵ cells depending on cell availability) into a 15 ml centrifuge tube, centrifuge the cells for 2 min at 800g, room temperature.
-
29|
Aspirate the supernatant, add 5–50 μl of PBS and resuspend the cells gently with a P200 Gilson pipette. Immediately incubate the cells on ice. Proceed to step 29 within 30 min.
CRITICAL STEP The lower the volume of PBS the better survival rate for the cells. Higher density gives rise to better survival of the transplanted ES cells.
-
30|
Anesthetize the animal designated for transplantation following the approved animal study protocol of your institution. In our laboratory, we have used a constant flow of 2% (for mice) or 3% (for rat) isoflurane vapor in oxygen to anesthetize the animal. For optical BLI imaging, shave the animal at the site of injection if the animal is not nude.
CAUTION Please adhere to your approved institutional animal protocol when handling mice or rats.
-
31|
Inject the volume of cells suspended in 5–50 μl of PBS into the appropriate engraftment site (for example, subcutaneously) of the animal. The animal can be imaged immediately after cell transplantation or several hours/days later.
Molecular imaging of in vivo behavior of DF and TF ES cells
-
32|
Imaging can be carried out using Option A BLI for DF and TF ES cells containing Fluc reporter genes or Option B microPET for TF ES cells containing HSVtk reporter genes.
(A) BLI imaging of engrafted DF or TF ES cells TIMING 1 h
Anesthetize a control animal that has not received cell transplantation with the DF or TF cells (should be the same species as the experimental animal). Place the control animal in the imaging chamber of a Xenogen IVIS machine. Image the animal with a 2 min acquisition interval using default settings for background BLI signal.
Anesthetize the experimental animal. Inject 375 mg kg−1 animal body weight of D-luciferin intraperitoneally. Wait for 10 min while keeping the animal anesthetized.
-
Place the animal in the imaging chamber of a Xenogen IVIS machine. Image the animal with 2 min acquisition intervals for a total of 30 min to catch the peak BLI signal (photons/s/cm2/sr). Adjust the exposure time and binning accordingly to avoid saturation of signals.
? TROUBLESHOOTING
-
Continue to image the animal at regular intervals. We normally image the animals at day 2, 4, 7, and weekly thereafter (see Fig. 3c).
CRITICAL STEP For consistent results, weigh the animal prior to each imaging session and inject 375 mg kg−1 body weight D-luciferin.
Analyze the images using Igor image analysis software which is available from the Xenogen Corporation.
(B) MicroPET imaging of engrafted TF ES cells TIMING 2 h
-
Prepare a sufficient amount of [18F]FHBG according to how many animals you plan to image. For [18F]FHBG preparation, see Yaghoubi et al 41. Include a control animal without transplanted TF cells for background images.
CAUTION [18F]-FHBG is radioactive, please follow your institutional radiation safety procedures when handling.
-
Draw approximately 200 μCi [18F]FHBG/animal (measure with a dose calibrator) into a syringe and inject the tracer into the animal via the tail vein 42. Record the exact reading from the dose calibrator, the time of measurement and the time of injection. Wait for 60–70 min before proceeding to imaging.
CAUTION [18F]-FHBG is radioactive, reduce the tail vein injection time as short as possible.
? TROUBLESHOOTING
Anesthetize the animal and fasten the animal onto the bed of the mircoPET scanner. Image the animal following your microPET manufacturer’s instructions. Record the scan start time.
Reconstruct the images with the software package provided by the manufacturer. We have used filtered back projection algorithms to reconstruct the images 19, 43.
Analyze the images with Amide’s A Medical Imaging Data Examiner (AMIDE) software (can be downloaded free of charge at http://amide.sourceforge.net). Draw a region of interest (ROI) to encircle the appropriate area containing signal. After signal quantification, convert PET units to counts per ml min−1 using a calibration constant obtained from a cylindrical phantom with a known activity of 18F. Assuming a tissue density of 1 gram ml−1, ROI counts per ml min−1 can be converted to counts per gram min−1. This value can subsequently be divided by tracer activity at time of imaging to calculate the injected dose per gram of tissue (%ID/g). The overall formula is [mean ROI signal × cylinder calibration factor]/[activity at time of imaging].
Image the animal at regular intervals for the duration of the experiment. We usually image at a weekly interval until animal sacrifice or study endpoint (Fig. 4). As with BLI, cell survival can potentially be monitored by microPET for the lifetime of the animal.
Figure 4.

Small animal microPET imaging of transplanted ES cells. (a) One million mouse ES cells were transplanted into right shoulder (TF reporter gene) and left (DF reporter gene) shoulder of an adult nude mouse. The mouse was injected with ~150 μCi reporter probe [18F]-FHBG. PET imaging was performed 1 h after [18F]-FHBG injection and signals were expressed as [18F]-FHBG percentage injected dose per gram of tissue (%ID/g). (b) Small animal PET imaging of TF mouse ES cells two weeks after intramyocardial transplantation in nude rats. The TF mouse ES cells were imaged using [18F]-FHBG reporter probe and the myocardial viability was used using [18F]-fluoro-deoxyglucose ([18F]-FDG) radiotracer. The bottom row represents the merged [18F]-FHBG and [18F]-FDG images in horizontal, coronal, and sagittal views, which reflects the exact anatomic location of transplanted ES cells within the anterolateral wall of the heart (arrows). Appropriate animal protocol has been approved by the Administrative Panel on Laboratory Animal Care of Stanford University. Data in a and b were reproduced with permission from ref. 37 and 19, respectively.
TIMING
Step 1–8, production of EGFP-Fluc double fusion and mRFP-Fluc-HSVtk triple fusion lentiviruses: 4d
Step 9–12, Lentivirus transduction of ES cells: 3–5 d
Step 13–23, Derivation of stable DF or TF ES cell lines: 3–6 weeks
Step 24–27, Measure ex vivo bioluminescence reporter gene activities: 1 h
Step 28–31, Transplantation of DF or TF ES cells into animals: 1–3 h
Step 32, Molecular imaging of in vivo behavior of DF and TF ES cells: 1–2 h
? TROUBLESHOOTING
Trouble shooting advice can be found in Table 1.
TABLE 1.
Troubleshooting table
| Step | Problem | Possible Reason | Possible Solution |
|---|---|---|---|
| 12 | No GFP/RFP cells observed | Low quality 293FT cells and low quality of DF/TF plasmids | Use 293FT cells of less than 12 passages, prepare fresh plasmids |
|
| |||
| 18 | No ES cell-like colonies appear | Low ES cells, poor MEF quality, harsh mechanical treatment of ES cells | Start with a high quality ES cell culture from the beginning. Use high quality MEF feeder cells. Test the quality of feeder cells with ES cells for 2~3 passages. Use gentle force when pipetting cells |
| 32A(iii) | No BLI signals observed | Misinjection of D-luciferin | Make sure that D-luciferin is injected intraperitoneally. Misinjection of D-luciferin will delay the appearance of BLI signals |
| 32B(ii) | No or low PET signals | Misinjection of [18F]FHBG outside the tail vein | Practice tail vein injections to avoid misinjection. Use heat packs to dilate the tail vein before injection |
ANTICIPATED RESULTS
Stably transduced DF and TF cells do not significantly differ from untransduced counterparts in terms of cell viability and proliferation. The integration of the DF/TF construct has been shown not to impact differentiation of ES cells 21, 22. Our laboratory has routinely differentiated these into EBs, cardiomyocytes, and endothelial cells (see ref. 8, 12, 18, and 19). Following establishment of stable DF or TF cell lines, imaging of cell survival following transplantation can be maintained for the duration of cell survival. As previously stated, estimates for the minimum number of cells detectable by BLI is approximately 500 cells 35 and 1,000 cells/mm3 for small animal PET imaging 36. However, the detection sensitivity will likely vary depending on the robustness of reporter gene expression, amount of reporter probes administered, location of transplanted cells (for BLI), and degree of cell survival. Typically following injection of undifferentiated ES cells, an acute period of cell death will be observed for the first week, reflected by a decrease in BLI signal. After that, an increase in signal will be observed due to teratoma formation (Figure 2c and upper panel of Figure 3c). In our experience, the number of cells that required for teratoma formation vary depending on the site of administration and whether the host is immunocompetent or immunodeficient. For immunodeficient host, we have been able to form tumors with as few as 500–1000 cells 38. Generally the more the blood support from the transplantation site the less cells needed for teratoma formation. By contrast, injection of differentiated hES cell-derived endothelial cells (Figure 2c) and cardiomyocytes (Figure 3c, lower panel) lead to significant cell death within the first 4 weeks, which is reflected by gradual decrease in signals (Figure 2c and Figure 3c). In the case of ES-derived cardiomyocytes, we have observed stable engraftments after transplantation out to greater than 6 months 25. For small animal PET imaging, DF cells are not appropriate for this modality because they do not carry the HSVtk reporter gene that allows uptake of the [18F]-FHBG reporter probe (Figure 4a). Only TF stable cell lines that carry the HSVtk reporter gene should be used. After administration of [18F]-FHBG into animals, the tracer will distribute to most of the tissues and clear gradually within an hour or so. Due to the natural excretion route, background PET activity will generally be present in the liver and bladder region (Figure 4a). For transplanted ES cells, a significant increase in PET signals will be observed after one week of transplantation.
We have also compared MRI and BLI modalities in tracking the cell fate of transplanted DF positive hES cells and hES cell-derived endothelial cells (hESC-ECs). Although MRI can detect the teratoma formation of DF hES cells labeled with iron particles at day 28 after transplantation (Figure 2a), it is not appropriate for imaging the process of cell proliferation over time (Figure 2b). Macrophages loaded with iron particles could be found in between muscle bundles that are close to the site of injection, which explains why MRI signals were relatively constant over the 4 week period post transplantation (Figure 2e). Because of the poor survival of hESC-ECs, there were no transplanted GFP+ cells detected nearby the macrophages that have engulfed the iron particles (Figure 2f). In contrast, BLI reporter gene imaging of the same animal exhibited a bi-modal curve (Figure 2d). The right hind limb (hESC-ECs) showed significant BLI activity at day 2, which decreased progressively over the following 4 weeks, indicating acute donor cell death. The left hind limb (undifferentiated hES cells) showed initial decrease in BLI signals at day 7, which increased dramatically during week 2 and week 4, indicating teratoma formation (Figure 2c).
In summary, following establishment of stable DF or TF cell lines, imaging of ES cell survival following transplantation is possible for the duration of cell survival. Incorporation of these imaging modalities described here will allow investigators us to study biologically relevant questions such as tumorigenicity, immunogenicity, and differentiation.
Acknowledgments
We thank funding support from AHA 0970394N, NIH HL089027, and NIH DP2OD004437 (JCW).
Footnotes
Competing financial interests
The authors declare that they have no competing financial interests.
Author contributions
N.S. and A.L. contributed equally to the preparation of this manuscript. J.C.W provided advices and proofread the manuscript.
References
- 1.Thomson JA, et al. Embryonic stem cell lines derived from human blastocysts. Science. 1998;282:1145–1147. doi: 10.1126/science.282.5391.1145. [DOI] [PubMed] [Google Scholar]
- 2.Reinlib L, Field L. Cell transplantation as future therapy for cardiovascular disease?: A workshop of the National Heart, Lung, and Blood Institute. Circulation. 2000;101:E182–187. doi: 10.1161/01.cir.101.18.e182. [DOI] [PubMed] [Google Scholar]
- 3.Spergel DJ, Kruth U, Shimshek DR, Sprengel R, Seeburg PH. Using reporter genes to label selected neuronal populations in transgenic mice for gene promoter, anatomical, and physiological studies. Prog Neurobiol. 2001;63:673–686. doi: 10.1016/s0301-0082(00)00038-1. [DOI] [PubMed] [Google Scholar]
- 4.Blasberg RG, Tjuvajev JG. Molecular-genetic imaging: current and future perspectives. J Clin Invest. 2003;111:1620–1629. doi: 10.1172/JCI18855. [DOI] [PMC free article] [PubMed] [Google Scholar]
- 5.Massoud TF, Gambhir SS. Molecular imaging in living subjects: seeing fundamental biological processes in a new light. Genes Dev. 2003;17:545–580. doi: 10.1101/gad.1047403. [DOI] [PubMed] [Google Scholar]
- 6.Morse MA, et al. Migration of human dendritic cells after injection in patients with metastatic malignancies. Cancer Res. 1999;59:56–58. [PubMed] [Google Scholar]
- 7.Bulte JW, et al. Magnetodendrimers allow endosomal magnetic labeling and in vivo tracking of stem cells. Nat Biotechnol. 2001;19:1141–1147. doi: 10.1038/nbt1201-1141. [DOI] [PubMed] [Google Scholar]
- 8.Kraitchman DL, Bulte JW. Imaging of stem cells using MRI. Basic research in cardiology. 2008;103:105–113. doi: 10.1007/s00395-008-0704-5. [DOI] [PMC free article] [PubMed] [Google Scholar]
- 9.Kraitchman DL, et al. Dynamic imaging of allogeneic mesenchymal stem cells trafficking to myocardial infarction. Circulation. 2005;112:1451–1461. doi: 10.1161/CIRCULATIONAHA.105.537480. [DOI] [PMC free article] [PubMed] [Google Scholar]
- 10.Dubertret B, et al. In vivo imaging of quantum dots encapsulated in phospholipid micelles. Science. 2002;298:1759–1762. doi: 10.1126/science.1077194. [DOI] [PubMed] [Google Scholar]
- 11.Jaiswal JK, Mattoussi H, Mauro JM, Simon SM. Long-term multiple color imaging of live cells using quantum dot bioconjugates. Nature Biotechnol. 2003;21:47–51. doi: 10.1038/nbt767. [DOI] [PubMed] [Google Scholar]
- 12.Acton PD, Kung HF. Small animal imaging with high resolution single photon emission tomography. Nuc Med and Biol. 2003;30:889–895. doi: 10.1016/s0969-8051(03)00112-4. [DOI] [PubMed] [Google Scholar]
- 13.Li Z, et al. Comparison of reporter gene and iron particle labeling for tracking fate of human embryonic stem cells and differentiated endothelial cells in living subjects. Stem cells (Dayton, Ohio) 2008;26:864–873. doi: 10.1634/stemcells.2007-0843. [DOI] [PMC free article] [PubMed] [Google Scholar]
- 14.Bulte JW, Kraitchman DL. Monitoring cell therapy using iron oxide MR contrast agents. Curr Pharm Biotechnol. 2004;5:567–584. doi: 10.2174/1389201043376526. [DOI] [PubMed] [Google Scholar]
- 15.Hofmann M, et al. Monitoring of bone marrow cell homing into the infarcted human myocardium. Circulation. 2005;111:2198–2202. doi: 10.1161/01.CIR.0000163546.27639.AA. [DOI] [PubMed] [Google Scholar]
- 16.Barbash IM, et al. Systemic delivery of bone marrow-derived mesenchymal stem cells to the infarcted myocardium: feasibility, cell migration, and body distribution. Circulation. 2003;108:863–868. doi: 10.1161/01.CIR.0000084828.50310.6A. [DOI] [PubMed] [Google Scholar]
- 17.Aicher A, et al. Assessment of the tissue distribution of transplanted human endothelial progenitor cells by radioactive labeling. Circulation. 2003;107:2134–2139. doi: 10.1161/01.CIR.0000062649.63838.C9. [DOI] [PubMed] [Google Scholar]
- 18.Boecker W, et al. Cardiac-specific gene expression facilitated by an enhanced myosin light chain promoter. Mol Imaging. 2004;3:69–75. doi: 10.1162/15353500200404103. [DOI] [PubMed] [Google Scholar]
- 19.Cao F, et al. In vivo visualization of embryonic stem cell survival, proliferation, and migration after cardiac delivery. Circulation. 2006;113:1005–1014. doi: 10.1161/CIRCULATIONAHA.105.588954. [DOI] [PMC free article] [PubMed] [Google Scholar]
- 20.van der Bogt KE, et al. Comparison of different adult stem cell types for treatment of myocardial ischemia. Circulation. 2008;118:S121–129. doi: 10.1161/CIRCULATIONAHA.107.759480. [DOI] [PMC free article] [PubMed] [Google Scholar]
- 21.Wu JC, et al. Transcriptional profiling of reporter genes used for molecular imaging of embryonic stem cell transplantation. Physiol Genomics. 2006;25:29–38. doi: 10.1152/physiolgenomics.00254.2005. [DOI] [PubMed] [Google Scholar]
- 22.Wu JC, et al. Proteomic analysis of reporter genes for molecular imaging of transplanted embryonic stem cells. Proteomics. 2006;6:6234–6249. doi: 10.1002/pmic.200600150. [DOI] [PMC free article] [PubMed] [Google Scholar]
- 23.Swijnenburg RJ, et al. In vivo imaging of embryonic stem cells reveals patterns of survival and immune rejection following transplantation. Stem Cells Dev. 2008;17:1023–1029. doi: 10.1089/scd.2008.0091. [DOI] [PMC free article] [PubMed] [Google Scholar]
- 24.Swijnenburg RJ, et al. Immunosuppressive therapy mitigates immunological rejection of human embryonic stem cell xenografts. Proc Natl Acad Sci U S A. 2008;105:12991–12996. doi: 10.1073/pnas.0805802105. [DOI] [PMC free article] [PubMed] [Google Scholar]
- 25.Cao F, et al. Transcriptional and functional profiling of human embryonic stem cell-derived cardiomyocytes. PLoS ONE. 2008;3:e3474. doi: 10.1371/journal.pone.0003474. [DOI] [PMC free article] [PubMed] [Google Scholar]
- 26.Li Z, et al. Differentiation, survival, and function of embryonic stem cell derived endothelial cells for ischemic heart disease. Circulation. 2007;116:I46–54. doi: 10.1161/CIRCULATIONAHA.106.680561. [DOI] [PMC free article] [PubMed] [Google Scholar]
- 27.Xie X, et al. Imaging of STAT3 signaling pathway during mouse embryonic stem cell differentiation. Stem Cells Dev. 2009;18:205–214. doi: 10.1089/scd.2008.0152. [DOI] [PMC free article] [PubMed] [Google Scholar]
- 28.Huang M, et al. Short hairpin RNA interference therapy for ischemic heart disease. Circulation. 2008;118:S226–233. doi: 10.1161/CIRCULATIONAHA.107.760785. [DOI] [PMC free article] [PubMed] [Google Scholar]
- 29.Gyöngyösi M, et al. Serial noninvasive in vivo positron emission tomographic tracking of percutaneously intramyocardially injected autologous porcine mesenchymal stem cells modified for transgene reporter gene expression. Circ Cardiovasc Imaging. 2008;1:94–103. doi: 10.1161/CIRCIMAGING.108.797449. [DOI] [PMC free article] [PubMed] [Google Scholar]
- 30.Yaghoubi SS, et al. Noninvasive detection of therapeutic cytolytic T cells with 18F-FHBG PET in a patient with glioma. Nat Clin Pract Oncol. 2009;6:53–58. doi: 10.1038/ncponc1278. [DOI] [PMC free article] [PubMed] [Google Scholar]
- 31.Wu S, Ying G, Wu Q, Capecchi MR. A protocol for constructing gene targeting vectors: generating knockout mice for the cadherin family and beyond. Nature Protoc. 2008;3:1056–1076. doi: 10.1038/nprot.2008.70. [DOI] [PubMed] [Google Scholar]
- 32.Krishnan M, et al. Effects of epigenetic modulation on reporter gene expression: implications for stem cell imaging. Faseb J. 2006;20:106–108. doi: 10.1096/fj.05-4551fje. [DOI] [PMC free article] [PubMed] [Google Scholar]
- 33.Bryja V, Bonilla S, Arenas E. Derivation of mouse embryonic stem cells. Nature Protoc. 2006;1:2082–2087. doi: 10.1038/nprot.2006.355. [DOI] [PubMed] [Google Scholar]
- 34.Lerou PH, et al. Derivation and maintenance of human embryonic stem cells from poor-quality in vitro fertilization embryos. Nature Protoc. 2008;3:923–933. doi: 10.1038/nprot.2008.60. [DOI] [PubMed] [Google Scholar]
- 35.Sheikh AY, et al. Molecular imaging of bone marrow mononuclear cell homing and engraftment in ischemic myocardium. Stem Cell. 2007;25:2677–2684. doi: 10.1634/stemcells.2007-0041. [DOI] [PMC free article] [PubMed] [Google Scholar]
- 36.Hung SC, et al. Mesenchymal stem cell targeting of microscopic tumors and tumor stroma development monitored by noninvasive in vivo positron emission tomography imaging. Clin Cancer Res. 2005;11:7749–7756. doi: 10.1158/1078-0432.CCR-05-0876. [DOI] [PubMed] [Google Scholar]
- 37.Cao F, et al. Molecular imaging of embryonic stem cell misbehavior and suicide gene ablation. Cloning Stem Cells. 2007;9:107–117. doi: 10.1089/clo.2006.0E16. [DOI] [PubMed] [Google Scholar]
- 38.Cao F, et al. Spatial and temporal kinetics of teratoma formation from murine embryonic stem cell transplantation. Stem Cells Dev. 2007;16:883–891. doi: 10.1089/scd.2007.0160. [DOI] [PubMed] [Google Scholar]
- 39.Braam SR, et al. Feeder-free culture of human embryonic stem cells in conditioned medium for efficient genetic modification. Nature protocols. 2008;3:1435–1443. doi: 10.1038/nprot.2008.140. [DOI] [PubMed] [Google Scholar]
- 40.Tiscornia G, Singer O, Verma IM. Production and purification of lentiviral vectors. Nat Protoc. 2006;1:241–245. doi: 10.1038/nprot.2006.37. [DOI] [PubMed] [Google Scholar]
- 41.Yaghoubi SS, Gambhir SS. PET imaging of herpes simplex virus type 1 thymidine kinase (HSV1-tk) or mutant HSV1-sr39tk reporter gene expression in mice and humans using [18F]FHBG. Nat Protoc. 2006;1:3069–3075. doi: 10.1038/nprot.2006.459. [DOI] [PubMed] [Google Scholar]
- 42.Dandekar M, Tseng JR, Gambhir SS. Reproducibility of 18F-FDG microPET studies in mouse tumor xenografts. J Nucl Med. 2007;48:602–607. doi: 10.2967/jnumed.106.036608. [DOI] [PMC free article] [PubMed] [Google Scholar]
- 43.Wu JC, et al. Molecular imaging of the kinetics of vascular endothelial growth factor gene expression in ischemic myocardium. Circulation. 2004;110:685–691. doi: 10.1161/01.CIR.000013815302213.22. [DOI] [PMC free article] [PubMed] [Google Scholar]