Abstract
Glutathione (GSH), the most abundant intracellular low molecular mass thiol, protects cells from oxidative damage and regulates their function. Available information is inconsistent regarding levels of GSH and its disulfide (GSSG) in maintenance hemodialysis patients (HD). In addition, very limited data are available in HD about the relationship of GSH and GSSG with other measures of thiol metabolism and with the clinical profile. We tested the hypothesis that erythrocyte GSH/GSSG redox potential (Eh) is lower in HD than in healthy controls (C), and that Eh correlates with posttranslational thiolation of hemoglobin (Hb) and with standard clinical parameters in HD. In cross-sectional comparison of 33 stable HD and 21 C, we found a net loss of reducing capacity in HD as indicated by low erythrocyte GSH/GSSG Eh (−257 ± 5.5 vs. −270 ± 5.6 mV, p=0.002). Glutathionylated Hb (HbSSG) was 46% higher in HD than C (19.3 ± 4.80 vs. 13.2 ± 2.79 pmol/mg Hb; p = 0.001) and cysteinylated Hb (HbSSCy) was >3-fold higher in HD than C [38.3 (29.0 – 63.3) vs. 11.5 (9.6 – 17.2) pmol/mg Hb; p = 0.001]. In multiple regression analysis of the HD cases, statistically significant associations were found between the GSH/GSSG Eh and the BUN (p = 0.001), creatinine (p = 0.015) and nPCR (p = 0.05), after adjusting for age, race/ethnicity and etiology of end-stage renal disease (ESRD). In conclusion, accurate and precise analysis of GSH, GSSG and mixed disulfides reveals loss of erythrocyte GSH/GSSG Eh, rise of both HbSSG and HbSSCy, and correlation of these thiols with measures of uremia and dietary protein intake.
Keywords: ESRD, CKD, oxidative stress, nutrition, anemia, thiol, BUN, creatinine, albumin, protein catabolic rate, CRP
Introduction
Glutathione (GSH) is the major intracellular thiol redox buffer and abnormalities of its metabolism have been reported and investigated as manifestations of nephropathy for at least half a century.1, 2 Continued interest in this area of research has been fostered by recognition of the critical role that GSH and cell protein sulfhydryl groups play in protecting cells from reactive oxygen species, other organic radicals and xenobiotics. Conversely, oxidative stress has profound effects on cellular thiol balance with relative increase in the levels of oxidized forms of GSH in many tissues3 and disruption of the cell signals regulating proliferation, differentiation, functions and death.4 There is ever growing evidence that GSH redox participates to the pathogenesis of both acute and chronic kidney disease.5
Despite this large body of supportive evidence, the relationship between thiol oxidation and the clinical manifestations of renal disease remains elusive. One important reason for this deficiency depends on the labile chemistry of both pro-oxidant and thiol moieties, e.g. GSH, which has caused objective challenges in developing accurate and precise research methodologies and technologies.
Recent advances in this field allow investigators to revisit this topic and attempt to find association between altered thiol metabolism and other established clinical or laboratory manifestations of renal disease. For example, methods are now available that minimize artifact and reproducibly measure the amounts of GSH and of its disulfide forms glutathione disulfide (GSSG) and mixed disulfides with proteins (RSSP) in intra- and extracellular environments therefore providing reliable estimates of overall tissue thiol redox status.6
We have taken advantage of these improved methodologies to test the hypothesis that the intracellular GSH/GSSG ratio and redox potential are lower in hemodialysis patients than in healthy controls, and that these measures of redox balance correlate in hemodialysis patients with cell protein thiolation level and with standard parameters of clinical performance and adequacy of renal replacement treatment.
Methods
Patient population and protocol
The study sample consisted of 33 Veterans with ESRD and 21 aged-matched apparently healthy control subjects with normal renal function. The Veterans with ESRD were enrolled from a single dialysis clinic that enlisted a total of 48 patients. Two subjects were excluded because of inclusion in the maintenance hemodialysis (HD) program for <3 months, three for age >70 years, four for dementia, two for active infection, and one each for active malignancy, liver cirrhosis, transfer to another unit, refusal to participate. The control subjects were recruited from the general population using posted advertising and word of mouth.
Twenty-nine ESRD subjects were dialyzed via native arteriovenous fistula and 4 via Gore-Tex vascular graft. In all cases, dialysis was administered three times per week with polyarylethersulfone/polyvinylpyrrolidone membrane (Revaclear Polyflux, Gambro, Lakewood, CO) using a Gambro CWP-WRO water purification system. The average treatment duration was 236 ± 14 minutes, with blood flow 394 ± 21 ml/min and dialysate flow 800 ml/min. The Kt/V was 1.82 ± 0.34. Blood specimens for the analysis of thiols and standard chemistry and for the calculation of Kt/V and normalized protein catabolic rate (nPCR) were collected before and at the end of the mid-week dialysis treatment with stop flow/stop pump technique.7
The out-patient dialysis medical record was reviewed to collect clinical information regarding demographics (age, gender, race, ethnicity), dialysis (ESRD cause and vintage, HD vintage, interdialytic weight gain, Kt/V), cardiovascular status [blood pressure, pulse rate, and h/o myocardial infarction, percutaneous coronary intervention, coronary artery by-pass graft, cerebral vascular accident and/or peripheral vascular disease], nutrition [body mass index, albumin, blood urea nitrogen (BUN), normalized protein catabolic rate (nPCR), ferritin and transferrin], inflammation [high-sensitivity c-reactive protein (HS-CRP), white blood cell (WBC) and neutrophil counts], hematopoiesis [hemoglobin (Hb)], acid-base [venous carbon dioxide], mineral metabolism [parathyroid hormone, calcium (Ca) and phosphorus (PO4)] and pharmacologic treatment (aspirin, Angiotensin converting enzyme-inhibitors, Angiotensin receptor blockers, statins, beta-blocker, calcium channel-blockers, erythropoietin stimulating agents and vitamin D preparations).
The study was approved by the VA R&D Office IRB and The University of Texas Health Science Center San Antonio. Written informed consent was obtained from every subject.
Laboratory Methods
Blood specimens for thiol analyses were obtained on all HD and control subjects and processed within approximately 6 minutes from the time of phlebotomy to frozen storage. Nine-hundred microliters of venous blood were collected from the dialysis access or a peripheral vein into evacuated tubes containing EDTA (Vacutainer, Becton and Dickinson, Franklin Lakes, NJ), immediately transferred into microfuge tubes containing 100 μl of 310 mM N-ethylmaleimide (NEM), centrifuged at 8,000xg for 30 seconds, and cleared of the supernatant plasma. The precipitated erythrocytes were then washed by mixing with normal saline, re-centrifuged at 8,000xg for 30 seconds, separated from the supernatant saline, aliquoted, quick-frozen, stored at −80° C, and shipped in liquid nitrogen via currier (LifeConEx, Plantation FL) to the analytical laboratory within 4 months from the time of collection.
GSH and GSSG levels were measured in the clear supernatant of 0.1 ml erythrocyte samples following cell lysis and protein precipitation with 12% (w/v) trichloroacetic acid (TCA) and centrifugation at 15,000g for 2 minutes. The GSH-NEM conjugate was measured using a HPLC procedure developed in our laboratory8 and the GSSG with the GSH recycling method with minor modifications9,10. The latter method takes advantage of the fact that all GSH present in the erythrocyte clear supernatant has been trapped with NEM and, therefore, is not available for the recycling reaction. Assessment of intra- and inter-day accuracy and precision revealed, respectively, a coefficient of variation of less than 4% and a reliability error of −2.5 to 2.5%. 8–10 Mixed disulfides consisting of low molecular mass thiols and proteins were measured in 20 μl aliquots of erythrocytes after cell lysis with 5 volumes of water and elimination of particulate and membrane fragments by centrifugation at 15,000g for 10 min. The resulting supernatants were subsequently cleared of low molecular mass thiols and disulfides by gel-filtration (Pharmacia PD10, equilibrated with 50 mM phosphate buffer, pH 7.4), incubated first with 0.5 mM dithiothreitol (DTT) at room temperature for 15 minutes to reduce S–S bonds and then with 2 mM (final concentration) monobromobimane (mBBr, Calbiochem) in the dark for 10 min, deproteinized with TCA (5 % (w/v) final concentration), and analyzed by HPLC using a Agilent 1100 system equipped with a C18 column (Zorbax Eclipse XDB-C18, 4.6 mm × 150 mm, 5 μm).11
Hemoglobin concentration was measured on a Jasco V/550 spectrophotometer after conversion to cyanometHb with the Drabkin’s reagent (100mg/NaCN and 300 mg K3FeCN6 dissolved in 1 L of water).12
The redox potential (Eh) of the GSH/GSSG pool in erythrocytes was determined using the Nernst equation [Eh = E0 + RT/nF ln ([GSSG]/[GSH]2)], where E0 is the standard potential for the redox couple, R is the gas constant (equal to 8.314 J K−1 mol−1), T is the absolute temperature (in Kelvin), F is the Faraday’s constant (equal to 9.6485×10⁴ C mol−1),n is the number of electrons transferred, [GSH] and [GSSG] are the molar concentrations of the two molecules, and the exponential of [GSH] reflects the stoichiometry of 2 GSH oxidized per GSSG formed (2GSH→GSSG+2e–+2H+). The standard potential E0 of the glutathione redox couple is generally set at −264 mV for pH 7.4, based on a value of −240 mV for pH 7.0 and a pH effect of −59 mV/pH unit.13
Routine chemistry analyses were performed by the Audie Murphy VA Hospital Centralized Laboratory using a UniCel DxC 800 Synchron Clinical Systems (Beckman Coulter, Brea, CA).
Statistical analysis
Variables are expressed as mean ± SD or median (25–75th percentile), as appropriate based on distribution. The Skewness/Kurtosis test and normal quantile plots were used to assess normality and the Levene test to assess homogeneity of variance. A standard log or Box-Cox transformation was used for transformation of non-normally distributed variables. The two-tailed t-test for independent samples and univariate analysis of variance were used for comparison of normally distributed variables, while the Mann-Whitney U and Kruskal-Wallis tests were used for non-parametric variables. Pearson and Spearman’s rho correlations were used to assess simple bivariate associations, and bootstrapped multiple regression analyses were used to further investigate the association of GSH–related variables with clinical and dietary measures while controlling for the covariates age, race and diabetes as the primary cause of the ESRD. IBM SPSS Statistics 19 (IBM Corp., Armonk, NY) and STATA (StataCorp LP, College Station, TX) were used for statistical analysis.
Results
Subject characteristics
The baseline clinical characteristics of the HD Patients and Healthy Controls are shown in Table 1. The study groups were balanced for age, race, ethnicity, sex distribution and BMI. The HD Patients were 60.7 ± 6.3 years old and moderately overweight; 20 were of Mexican–American ethnicity. The dialysis vintage was 39 ± 23 months. The cause of ESRD was diabetes mellitus (DM) in 23 subjects, hypertension in 6, glomerulonephritis in 2 and other in 2. Erythropoietin stimulating agents were prescribed in 32 subjects, calcitriol analogs in 25, hypoglycemic medications in 28, aspirin in 24, statins in 16, ACE-inhibitors or Angiotensin Receptor Blockers in 22, beta-blockers in 24. The serum median HS-CRP was high at 0.41 mg/dL (0.18 – 1.04), while WBC and monocyte counts were normal. The serum albumin (3.54 ± 0.39 g/dl) and nPCR (0.97 ± 0.26 g/kg per day) were low despite well-preserved BMI. Mild inflammation as well as low albumin and dietary protein intake are common occurrence in maintenance hemodialysis patients14.
Table 1.
Clinical characteristics
| Reference Range | ESRD Group (n=33) | Control group (n=21) | p | |
|---|---|---|---|---|
| General | ||||
| Age | 60.7 ± 1.1 | 56.7 ± 1.3 | ns | |
| Gender (M/F) | 31/2 | 19/2 | ns | |
| Race (Cauc/AA/As) | 22/11/0 | 19/0/2 | ||
| Ethnicity (MA/NHW/AA/As) | 20/2/11/0 | 12/7/0/2 | ||
| Body Mass Index | 27.8 ± 0.8 | 28.9 ± 0.9 | ns | |
| Dialysis Adequacy | ||||
| Kt/V a | 1.4 | 1.82 ± 0.34 | NA | |
| Nutrition | ||||
| Normalized PCR a | 1.0 – 1.4 | 0.97 ± 0.26 | NA | |
| Albumin (g/dL) a | 3.6 – 4.8 | 3.54 ± 0.39 | 4.2 ± 0.11 | <.05 |
| Inflammation | ||||
| CRP (mg/dL) b | 0 – 0.3 | 0.41 (0.18 – 1.04) | 0.2 (0.08 – 0.63) | <.05 |
| WBC (103/μl) a | 4.3 – 10.8 | 6.97 ± 1.94 | 7.22± 0.84 | ns |
| Neutrophils (103/μl) a | 2.2 – 7.6 | 4.68 ± 1.79 | 3.81 ± 0.47 | ns |
Cauc, Caucasian; AA, African American; As, Asian; MA, Mexican American; NH, Non-Hispanic. NA, not applicable
Variables presented as mean ± SD;
Variables presented as median (25th–75th percentile);
from centralized laboratory reference range;
from general population reference range [ref];
from K/DOQI Guidelines [ref].
Erythrocyte GSH redox balance
The reduced GSH levels were virtually identical in erythrocytes from HD Patients and Healthy Controls (8,720 ± 2,150 vs. 8,460 ± 1,750 pmol/mg Hb; Fig 1a) and they were 300 to 600-fold higher than the disulfide GSSG levels (Fig 1b). The cells from the HD patients, however, had twice the amount of GSSG (26.4 ± 9.0 vs. 13.2 ± 4.2 pmol/mg Hb, p<0.01; Fig 1b) and 40% lower GSH/GSSG ratio (363 ± 143 vs. 693 ± 233, p<0.001; Fig 1c), as compared to Healthy Controls cells. Figure 1d shows that the GSH/GSSG Eh was lower in the HD Patients than in the Healthy Controls (−257 ± 5.5 vs. −270 ± 5.6 mV, p=0.002) indicating a net loss of reducing capacity.
Figure 1.
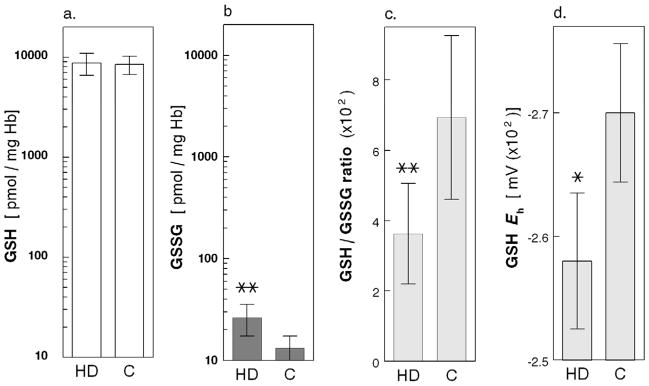
(a.) Glutathione (GSH, nmol/mg Hb); (b.) glutathione disulfide (GSSG, nmol/mg Hb); (c.) ratio between reduced and oxidized glutathione (GSH/GSSG ratio, ×102); and (d.) GSH/GSSG redox power (Eh, mV × 102) in RBCs from 21 healthy Control subjects (C) and 33 Maintenance HD Patients (HD); mean ± SD. (*) indicates p=0.002 and (**) indicates p<0.001.
Post-translational thiolation of erythrocyte Hb
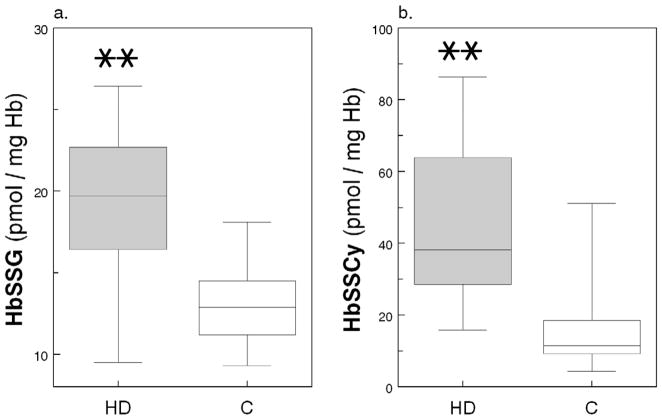
Consistent with the above finding, the level of glutathionylated Hb (HbSSG) was 46% higher in HD Patients than in Healthy Controls (19.3 ± 4.8 vs. 13.2 ± 2.8 pmol/mg Hb; p = 0.001; Figure 2a). More intriguing were the observations on cysteinylated Hb (HbSSCy; Figure 2b); in fact, HbSSCy levels were >3-fold higher in Patients than Controls [38.3 (29.0 – 63.3) vs. 11.5 (9.6 – 17.2) pmol/mg Hb; p = 0.001] and cells from the HD Patients contained twice as much HbSSCy than HbSSG. The cystine levels were measured in the same erythrocyte lysates after reduction of the disulfide bonds using the monobromobimane fluorescence method (detection limit 0.33 pmol/mg Hb)10, 11 and, as expected, they were undetectable (not shown). In regression analysis, after controlling for age, race and presence of diabetes, we found direct association of cell HbSSG content with log-transformed GSSG (p=0.001; Figure 3) and GSH (p=0.03) and inverse association with GSH/GSSG ratio (p=0.04), highlighting the coexistence of diminished erythrocyte reducing power and Hb glutathionylation. Similar findings were present for HbSSCy (Appendix Figure A1).
Figure 2.
(a.) Glutathionylated Hb (HbSSG, pmol/mg Hb) and (b.) cysteinylated Hb (HbSSCy, pmol/mg Hb) in RBCs from 21 healthy Control subjects (C) and 33 Maintenance HD Patients (HD); box-and-whisker diagram (median, 25th–75th percentile). (**) indicates p<0.001.
Figure 3.
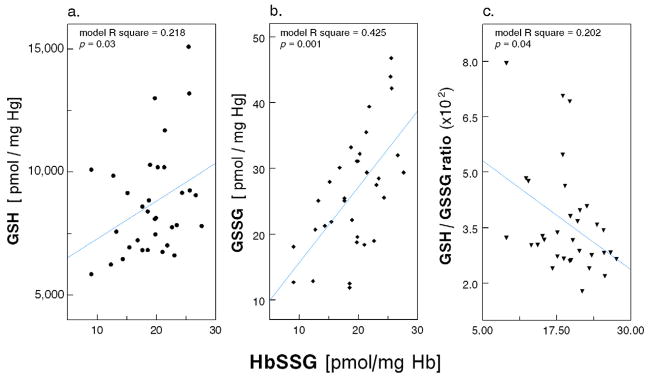
Scatter plot of HbSSG (pmol/mg Hb) with (a.) glutathione (GSH, nmol/mg Hb); (b.) glutathione disulfide (GSSG, nmol/mg Hb); and (c.) ratio between glutathione and glutathione disulfide (GSH/GSSG ratio, ×102) in RBCs from 33 Maintenance HD Patients (multiple regression models with age, race and diabetes as covariates).
Appendix Figure A1.
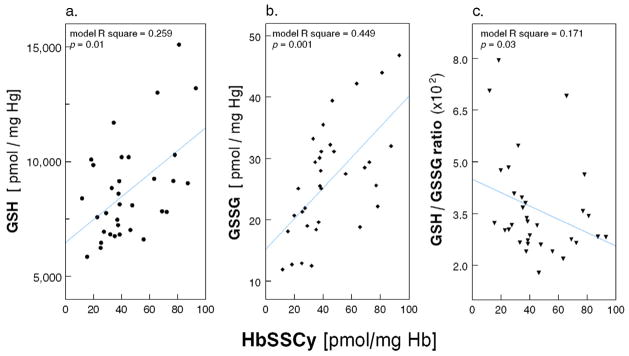
Scatter plot of HbSSCy (pmol/mg Hb) with (a.) glutathione (GSH, pmol/mg Hb), (b) glutathione disulfide (GSSG, pmol/mg Hb), and (c) ratio between glutathione and glutathione disulfide (GSH/GSSG ratio, x102) in RBCs from 33 Maintenance HD Patients (multiple regression models with age, race and diabetes as covariates).
Regression analysis of GSH redox balance and thiolated Hb with clinical parameters
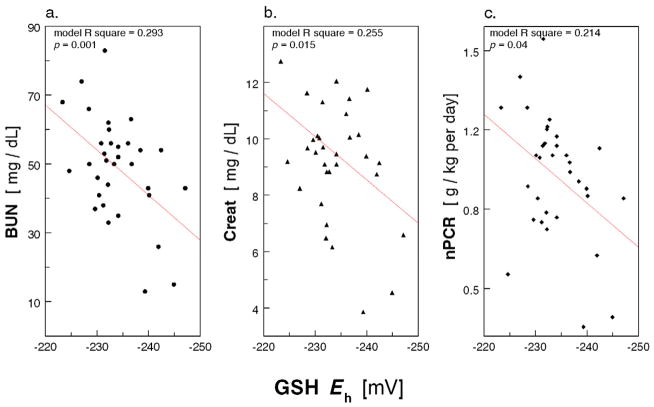
In the HD Patients, we explored correlation of erythrocyte GSH/GSSG Eh, HbSSG and HbSSCy with the standard parameters of clinical care listed in the methods section. In regression analysis, after controlling for age, race and presence of diabetes, GSH/GSSG Eh was associated with BUN (p = 0.001), creatinine (p = 0.015) and nPCR (p = 0.04; see figure 4). Analysis of the GSH/GSSG ratio rather than the GSH/GSSG Eh yielded similar results (not shown). In addition, HbSSCy (log-transformed) correlated with BUN (p = 0.004), creatinine (p = 0.03), and nPCR (p = 0.02; see Appendix Figure A2), and HbSSG (log-transformed) correlated with BUN (p = 0.03), creatinine (p = 0.002) and nPCR (p = 0.04; see Appendix Figure A3).
Figure 4.
Scatter plot of RBC GSH/GSSG redox power (Eh, mV × 102) with (a) serum blood urea nitrogen (BUN, mg/dL); (b) creatinine (Creat, mg/dL); and (c.) normalized protein catabolic rate (nPCR, g/kg per day) in 33 Maintenance HD Patients (multiple regression models with age, race and diabetes as covariates).
Appendix Figure A2.
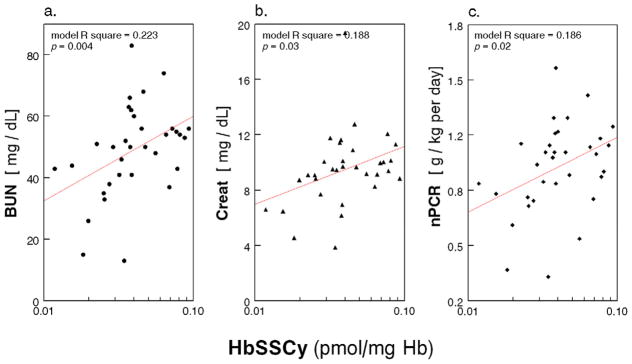
Scatter plot of RBC HbSSCy (pmol/mg Hb) with (a) serum blood urea nitrogen (BUN, mg/dL); (b.) Creatinine (Creat, mg/dL); and (c) normalized protein catabolic rate (nPCR, g/kg per day) in 33 Maintenance HD Patients (multiple regression models with age, race and diabetes as covariates).
Appendix Figure A3.
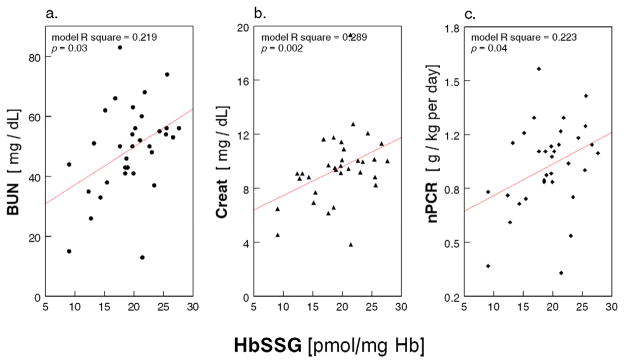
1Scatter plot of HbSSG (pmol/mg Hb) with (a.) serum blood urea nitrogen (BUN, mg/dL); (b.) Creatinine (Creat, mg/dL); and (c.) normalized protein catabolic rate (nPCR, g/kg per day) in 33 Maintenance HD Patients (multiple regression models with age, race and diabetes as covariates).
Discussion
We report normal levels of GSH and doubling of disulfide GSSG in the erythrocytes of clinically stable ESRD patients on maintenance HD therapy as compared to age-matched healthy control subjects. As a consequence, we find lower GSH/GSSG ratio and GSH/GSSG Eh in cells from HD patients, consistent with diminished intracellular reducing power in the presence of uremia. In addition cells from HD patients contain 46% higher HbSSG and >3-fold higher levels of HbSSCy compared to controls. HD patients also have twice the amount of HbSSCy as compared to HbSSG and these patients’ HbSSG and HbSSCy correlate inversely with the GSH/GSSG. Finally, we find association between the erythrocyte GSH reducing power and the clinical attributes of HD patients as demonstrated by the correlation of the GSH/GSSG Eh, HbSSCy and HbSSG with BUN, serum creatinine and protein catabolic rate, i.e. parameters related to both uremia and nutrition.
Our observation of normal GSH, high GSSG and low GSH/GSSG ratio in HD patients is consistent with those of Canestrari, et al.15 Our data, however, differ from those of other investigators who reported absolute amounts of erythrocyte GSH and GSSG that were inexplicably high, low or equal in HD patients vs. healthy controls (see Table 2.a).16–20 In the latter studies, the GSH/GSSG ratio ranged widely from 25 to 302 in HD patients and from 38.7 to 574 in healthy subjects. We believe this discrepancy is driven primarily by lack of standardization of the analytical methods. Specifically, only few studies in HD patients have properly addressed the technical challenge of spontaneous GSH oxidation after sample collection.21 More importantly, there is acceleration of this oxidative process after sequential addition of acids and bases to prepare the samples for analysis.16, 22 From this the need to spike the samples as soon as possible with agents that mask the sulfhydryl groups therefore blocking artifactual ex vivo oxidation.15, 16, 19, 20 We have previously tested the masking properties of NEM and found it to be effective, rapid in its action and free from major artifacts.10 It should be noted that the problem of technical artifact is not confined to studies on renal patients; even studies in healthy humans have yielded levels of GSH, and more so of GSSG and S-glutathionylated proteins, that vary over 100-fold, a clear deterrent to progress in this area of clinical investigation.10, 21
Table 2a.
GSH and GSSG in RBCs of HD Patients and Healthy Controls. Comparison among studies.
| GSH | GSSG | GSH/GSSG | |||||
|---|---|---|---|---|---|---|---|
| Control | HD | Control | HD | Control | HD | ||
| This manuscript | nmol/mg Hb | 8.46 ± 1.75 | 8.72 ± 2.15 | 0.013 ± 0.004 | 0.026 ± 0.009 (↑) | 693 | 363 (↓) |
| Canestrari, 199415 | nmol/mg Hb | 7.6 ± 1.8 | 7.8 ± 2.0 | 0.027 ± 0.09 | 0.060 ± 0.08 (↑) | 281 | 130 (↓) |
| Owada, 200116 | nmol/mg Hb | 7.9 ± 0.8 | 10.1 ± 1.7 (↑) | 0.023 ± 0.005 | 0.047 ± 0.025 (↑) | 345 | 214 (↓) |
| Klemm, 200117(*) | nmol/mg Hb | 6.10 ± 1.41 | 6.19 ± 1.46 | 0.153 ± 0.058 | 0.159 ± 0.048 | 40.0 | 39.0 |
| Sachs, 199018(*) | nmol/mg Hb | 7.33 ± 1.07 | 8.53 ± 0.7 (↑) | 0.125 ± 0.026 | 0.184 ± 0.042 (↑) | 58.7 | 46.3 (↓) |
| Zwolinska, 200919(**) | nmol/mg Hb | 7.14 ± 0.44 | 4.81± 0.56 (↓) | 0.055 ± 0.004 | 0.053 ± 0.017 | 64.9 | 45.1 (↓) |
| Pasaoglu, 199620(**) | nmol/mg Hb | 3.95± 0.25 | 2.51± 0.207 (↓) | 0.051 ± 0.001 | 0.05 ± 0.002 | 38.7 | 25.0 (↓) |
(↑) increase compared to Ctrl; (↓) decrease compared to Ctrl;
the (*) [nmol/ml] and (**) [μg/ml] concentrations reported in the original publications are expressed here as nmol/mg Hb to facilitate comparison with the other studies, (values calculated based on GSH m.w. 307.3, GSSG m.w. 612.6, and an arbitrary mean concentration of Hb of 300 mg/ml RBC);
As part of our GSH analysis in HD patients and healthy controls, we have also calculated GSH/GSSG Eh by applying the Nernst equation6. This calculation provides a better measure of the cell redox state 13 because, unlike the GSH/GSSG ratio, it takes into account both redox ratio and absolute concentration of GSH. In addition, GSH/GSSG Eh facilitates the quantitative integration and/or comparison of the GSH redox state with that of other reducing or oxidizing moieties that can also be expressed in electric potential units. In our study, the GSH/GSSG ratio and Eh provided similar information although GSH/GSSG Eh values within the HD patient and the healthy control groups were less dispersed with consequent no overlap of the standard deviations (see Figure 1.c and .d).
Analysis of erythrocyte Hb for evidence of sulfhydryl group S-thiolation is another important aim of this work because along with GSH/GSSG the sulfhydryl groups of cell proteins are abundant and critical to cell redox.3, 6 In essence, analyses of GSH/GSSG and of protein S-thiolation/dethiolation are complementary, ultimately allowing a more complete understanding of the cell redox state. We found high levels of HbSSG in cells of HD patients which in addition to being consistent with the parallel observation of diminished GSH/GSSG Eh, confirm the presence of oxidative stress and point to an attempt of cell proteins to scavenge low molecular mass disulfides from the cytosol. S-glutathionylation of Hb, a rare event in healthy erythrocytes,11 was reported in a number of pathologic conditions besides renal failure23–25 including diabetes, hyperlipidemia and Friedreich’s ataxia.26,27, 28,23 It is interpreted as a mechanism to regenerate reduced free GSH from disulfide GSSG and, ultimately, as a buffering defense mechanism against oxidative stress.29 We detected 10−11 mole HbSSG per mg Hb; as shown in Table 2.b, the concentration of HbSSG in our samples was equal to 0.04% of total Hbβ, i.e. 50 to 500-fold lower than the 3-18% HbSSG reported by other laboratories.23–25 The latter studies used detection methods and instrumentation that are clearly different from ours; we suspect, however, that also in this case the discrepancy results primarily from the use, or lack thereof, of alkylating reagents that prevent ex vivo oxidation of the sulfhydryl groups during sample handling.
Table 2b.
HbSSG in RBCs of HD Patients and Healthy Controls. Comparison among studies.
More surprising was the detection of twice as high a concentration of HbSSCy relative to HbSSG in our HD patients, considering that intracellular free cysteine concentration is three orders of magnitude lower than that of GSH (~10−6M vs. ~10−3M). Intracellular S-cysteinylation seems to occur much less frequently than S-glutathionylation11, 30, 31 and, although detected in in vitro models of oxidative stress,32, 33 it has never before been described for Hb. Undetectable levels of cystine in our samples ruled out the possibility that the observed HbSSCy disulfides were the result of thiol-disulfide exchange reactions. The potential significance of this observation comes from the fact that the steric conformation of HbSSCy does not hinder the cysteine residual, thus allowing this moiety to maintain higher chemical reactivity than its counterpart GSH group in HbSSG. Thus, S-cysteinylation of Hb may be viewed as more than just a marker of oxidative stress, but also may have specific pathogenetic significance by promoting the formation of disulfides with other intracellular molecules, such as cytoskeleton and membrane proteins, with consequences on both cell function and life span.
The correlation of GSH/GSSG Eh and of the thiolated Hb with BUN, creatinine and nPCR is particularly interesting to us for several reasons. First, correlation of GSH/GSSG Eh with basic parameters of HD patient care offers support to the clinical relevance of this line of investigation. Second, while the oxidative effect of uremia on plasma thiols and correction of the latter by dialysis were clearly shown before,34 we present here novel evidence that markers of dietary protein intake, and not just uremia, associate with intracellular GSH redox. This observation is certainly open to several alternative interpretations; an intriguing possibility is that protein intake may act as double-edged swords in renal failure patients: on the one hand these foods are absolutely essential nutrients while on the other they may behave as GSH-consuming pro-oxidants. Such an effect is reminiscent of the “postprandial oxidative stress” phenomenon well described in the general population, irrespective whether the nutrient is protein, fat or carbohydrates.35–37 Postprandial oxidative stress, although hardly ever investigated in renal failure patients,38 may be particularly sustained in this disease state due to retention of dietary byproducts and toxins that would normally be eliminated by the kidneys. Third, in HD patients, protein intake could be an indirect marker of other nutrient intake including fat, carbohydrate, micronutrient and/or other mineral intake.
To our knowledge, decreased reducing potential and hemoglobin S-thiolation in the erythrocyte have not yet been attributed specific direct clinical effects in HD patients. We submit that our cross-sectional observation of an association between thiol redox and nutritional parameters warrants future prospective investigation to address possible effects of food quality and/or antioxidant therapy on GSH/GSSG Eh, and to define possible interactions between GSH/GSSG Eh and clinical outcomes. In relation to the latter, we wish to stress that our analysis of GSH/GSSG and GSH/GSSG Eh in erythrocytes may not be relevant just to the hematopoietic system since it provides indirect information about the redox state of all tissues. Indeed, the redox state of erythrocytes is remarkably similar to that of other cell types, as suggested by coherent change of GSH/GSSG in a variety of cell types in response to functional variations, e.g. proliferation, senescence and apoptosis.39 Finally, it is known that erythrocytes exposed to oxidative stress undergo macrophage-dependent apoptosis, a.k.a. eryptosis, via activation of the cell membrane Ca2+-permeable cation channel and scrambling of the cell surface asymmetric phosphatidylserine distribution.40, 41 Also, oxidative stress and eryptosis were found to correlate in patients with T2DM and/or CKD42 and this same phenomenon was reversed by in vitro and in vivo supplementation of the cysteine and GSH precursor N-acetylcysteine. 43 Taken together, this evidence supports the possibility that ESRD-induced eryptosis may depend, at least in part on decreased erythrocyte reducing potential and Hb S-thiolation; measures aimed at monitoring accurately and at correcting oxidative stress and thiol imbalance may therefore alleviate the shortened erythrocyte life span by preventing eryptosis.44
Our study has several obvious limitations including the cross sectional design which allows establishing association but not causal links between parameters, the small size of the study population, and the net prevalence of males. Furthermore, many of our HD patients suffered from diabetes mellitus and prior studies have reported association between this condition and unfavorable profile of the reducing potential.45 While we cannot completely exclude an effect of diabetes mellitus on our findings, regression analysis that controlled for presence of this disease state as covariate suggests that diabetes alone cannot account for the observed associations between reduced redox potential and renal and dietary parameters. Larger prospective studies with more rigorous control of enrolment criteria and with longitudinal follow-up should be able to resolve these uncertainties
Supplementary Material
Acknowledgments
This work was supported by grants to PF from NIH-NCCAM (#AT004490) and from the VA (Merit Review #1I01CX000264).
Abbreviations
- GSH
glutathione
- GSSH
glutathione disulfide
- HbSSG
glutathionylated hemoglobin
- HbSSCy
cysteinylated hemoglobin
- Eh
redox potential
- DM
diabetes mellitus
- ESRD
end-stage renal disease
- Kt/V
dialysis adequacy unit
- nPCR
normalized protein catabolic rate
- BUN
blood urea nitrogen
- CRP
C-reactive protein
- WBC
white blood cells
Footnotes
All authors have read the journal’s policy on disclosure of potential conflict of interest and they declare of having no conflict of interest to disclose.
Publisher's Disclaimer: This is a PDF file of an unedited manuscript that has been accepted for publication. As a service to our customers we are providing this early version of the manuscript. The manuscript will undergo copyediting, typesetting, and review of the resulting proof before it is published in its final citable form. Please note that during the production process errors may be discovered which could affect the content, and all legal disclaimers that apply to the journal pertain.
Bibliography
- 1.Muirhead EE, Jones F. Lowered glucose utilization, phosphate uptake, and reduced glutathione content of erythrocytes following bilateral nephrectomy. J Lab Clin Med. 1958 Jan;51(1):49–52. [PubMed] [Google Scholar]
- 2.Theil GB, Brodine CE, Doolan PD. Red cell glutathione content and stability in renal insufficiency. J Lab Clin Med. 1961 Nov;58:736–742. [PubMed] [Google Scholar]
- 3.Gilbert HF. Molecular and cellular aspects of thiol-disulfide exchange. Adv Enzymol Relat Areas Mol Biol. 1990;63:69–172. doi: 10.1002/9780470123096.ch2. [DOI] [PubMed] [Google Scholar]
- 4.Jones DP. Radical-free biology of oxidative stress. Am J Physiol Cell Physiol. 2008 Oct;295(4):C849–868. doi: 10.1152/ajpcell.00283.2008. [DOI] [PMC free article] [PubMed] [Google Scholar]
- 5.Himmelfarb J, Stenvinkel P, Ikizler TA, Hakim RM. The elephant in uremia: oxidant stress as a unifying concept of cardiovascular disease in uremia. Kidney Int. 2002 Nov;62(5):1524–1538. doi: 10.1046/j.1523-1755.2002.00600.x. [DOI] [PubMed] [Google Scholar]
- 6.Schafer FQ, Buettner GR. Redox environment of the cell as viewed through the redox state of the glutathione disulfide/glutathione couple. Free Radic Biol Med. 2001 Jun 1;30(11):1191–1212. doi: 10.1016/s0891-5849(01)00480-4. [DOI] [PubMed] [Google Scholar]
- 7.National Kidney Foundation - Disease Outcome Quality Initiative. Management of protein and energy intake. web] http://www.kidney.org/professionals/kdoqi/guidelines_updates/nut_a15.html.
- 8.Giustarini D, Dalle-Donne I, Milzani A, Rossi R. Detection of glutathione in whole blood after stabilization with N-ethylmaleimide. Anal Biochem. 2011 Aug 1;415(1):81–83. doi: 10.1016/j.ab.2011.04.013. [DOI] [PubMed] [Google Scholar]
- 9.Tietze F. Enzymic method for quantitative determination of nanogram amounts of total and oxidized glutathione: applications to mammalian blood and other tissues. Anal Biochem. 1969 Mar;27(3):502–522. doi: 10.1016/0003-2697(69)90064-5. [DOI] [PubMed] [Google Scholar]
- 10.Rossi R, Milzani A, Dalle-Donne I, et al. Blood glutathione disulfide: in vivo factor or in vitro artifact? Clin Chem. 2002 May;48(5):742–753. [PubMed] [Google Scholar]
- 11.Giustarini D, Dalle-Donne I, Colombo R, et al. Protein glutathionylation in erythrocytes. Clin Chem. 2003 Feb;49(2):327–330. doi: 10.1373/49.2.327. [DOI] [PubMed] [Google Scholar]
- 12.Drabkin DL, Austin JH. Spectrophotometric studies: II. Preparations from washed blood cells; nitric oxide hemoglobin and sulfhemoglobin. J Biol Chem. 1935;112:51–65. [Google Scholar]
- 13.Jones DP. Redox potential of GSH/GSSG couple: assay and biological significance. Methods Enzymol. 2002;348:93–112. doi: 10.1016/s0076-6879(02)48630-2. [DOI] [PubMed] [Google Scholar]
- 14.Docci D, Bilancioni R, Buscaroli A, et al. Elevated serum levels of C-reactive protein in hemodialysis patients. Nephron. 1990;56:364–367. doi: 10.1159/000186176. [DOI] [PubMed] [Google Scholar]
- 15.Canestrari F, Galli F, Giorgini A, et al. Erythrocyte redox state in uremic anemia: effects of hemodialysis and relevance of glutathione metabolism. Acta Haematol. 1994;91(4):187–193. doi: 10.1159/000204332. [DOI] [PubMed] [Google Scholar]
- 16.Owada S, Tsukamoto T, Toyama K, et al. Erythrocyte redox state in hemodialyzed patients: glutathione and glutathione-related enzymes. J Artif Organs. 2001;4:8–18. [Google Scholar]
- 17.Klemm A, Voigt C, Friedrich M, et al. Determination of erythrocyte antioxidant capacity in haemodialysis patients using electron paramagnetic resonance. Nephrol Dial Transplant. 2001;16(11):2166–2171. doi: 10.1093/ndt/16.11.2166. [DOI] [PubMed] [Google Scholar]
- 18.Sachs G, Siems W, Grune T, Schmidt G, Gerber G, Zoellner K. Nucleotide and glutathione status in erythrocytes of children undergoing chronic hemodialysis under erythropoietin treatment. Biomed Biochim Acta. 1990;49(2–3):S123–124. [PubMed] [Google Scholar]
- 19.Zwolinska D, Grzeszczak W, Szczepanska M, Makulska I, Kilis-Pstrusinska K, Szprynger K. Oxidative stress in children on peritoneal dialysis. Perit Dial Int. 2009 Mar-Apr;29(2):171–177. [PubMed] [Google Scholar]
- 20.Pasaoglu H, Muhtaroglu S, Gunes M, Utas C. The role of the oxidative state of glutathione and glutathione-related enzymes in anemia of hemodialysis patients. Clin Biochem. 1996 Dec;29(6):567–572. doi: 10.1016/s0009-9120(96)00097-5. [DOI] [PubMed] [Google Scholar]
- 21.Rossi R, Dalle-Donne I, Milzani A, Giustarini D. Oxidized forms of glutathione in peripheral blood as biomarkers of oxidative stress. Clin Chem. 2006 Jul;52(7):1406–1414. doi: 10.1373/clinchem.2006.067793. [DOI] [PubMed] [Google Scholar]
- 22.Svardal AM, Mansoor MA, Ueland PM. Determination of reduced, oxidized, and protein-bound glutathione in human plasma with precolumn derivatization with monobromobimane and liquid chromatography. Anal Biochem. 1990 Feb 1;184(2):338–346. doi: 10.1016/0003-2697(90)90691-2. [DOI] [PubMed] [Google Scholar]
- 23.Naito C, Kajita M, Niwa T. Determination of glutathionyl hemoglobin in hemodialysis patients using electrospray ionization liquid chromatography-mass spectrometry. J Chromatogr B Biomed Sci Appl. 1999 Aug 6;731(1):121–124. doi: 10.1016/s0378-4347(99)00139-5. [DOI] [PubMed] [Google Scholar]
- 24.Mandal AK, Woodi M, Sood V, et al. Quantitation and characterization of glutathionyl haemoglobin as an oxidative stress marker in chronic renal failure by mass spectrometry. Clin Biochem. 2007 Sep;40(13–14):986–994. doi: 10.1016/j.clinbiochem.2007.05.006. [DOI] [PubMed] [Google Scholar]
- 25.Takayama F, Tsutsui S, Horie M, Shimokata K, Niwa T. Glutathionyl hemoglobin in uremic patients undergoing hemodialysis and continuous ambulatory peritoneal dialysis. Kidney Int Suppl. 2001 Feb;78:S155–158. doi: 10.1046/j.1523-1755.2001.59780155.x. [DOI] [PubMed] [Google Scholar]
- 26.Piemonte F, Pastore A, Tozzi G, et al. Glutathione in blood of patients with Friedreich’s ataxia. Eur J Clin Invest. 2001 Nov;31(11):1007–1011. doi: 10.1046/j.1365-2362.2001.00922.x. [DOI] [PubMed] [Google Scholar]
- 27.Naito C, Niwa T. Analysis of glutathionyl hemoglobin levels in diabetic patients by electrospray ionization liquid chromatography-mass spectrometry: effect of vitamin E administration. J Chromatogr B Biomed Sci Appl. 2000 Sep 1;746(1):91–94. doi: 10.1016/s0378-4347(00)00121-3. [DOI] [PubMed] [Google Scholar]
- 28.Niwa T, Naito C, Mawjood AH, Imai K. Increased glutathionyl hemoglobin in diabetes mellitus and hyperlipidemia demonstrated by liquid chromatography/electrospray ionization-mass spectrometry. Clin Chem. 2000 Jan;46(1):82–88. [PubMed] [Google Scholar]
- 29.Dalle-Donne I, Milzani A, Gagliano N, Colombo R, Giustarini D, Rossi R. Molecular mechanisms and potential clinical significance of S-glutathionylation. Antioxid Redox Signal. 2008 Mar;10(3):445–473. doi: 10.1089/ars.2007.1716. [DOI] [PubMed] [Google Scholar]
- 30.Mawatari S, Murakami K. Different types of glutathionylation of hemoglobin can exist in intact erythrocytes. Arch Biochem Biophys. 2004 Jan 1;421(1):108–114. doi: 10.1016/j.abb.2003.10.012. [DOI] [PubMed] [Google Scholar]
- 31.Sampathkumar R, Balasubramanyam M, Sudarslal S, Rema M, Mohan V, Balaram P. Increased glutathionylated hemoglobin (HbSSG) in type 2 diabetes subjects with microangiopathy. Clin Biochem. 2005 Oct;38(10):892–899. doi: 10.1016/j.clinbiochem.2005.06.009. [DOI] [PubMed] [Google Scholar]
- 32.Chai YC, Ashraf SS, Rokutan K, Johnston RB, Jr, Thomas JA. S-thiolation of individual human neutrophil proteins including actin by stimulation of the respiratory burst: evidence against a role for glutathione disulfide. Arch Biochem Biophys. 1994 Apr;310(1):273–281. doi: 10.1006/abbi.1994.1167. [DOI] [PubMed] [Google Scholar]
- 33.Ravichandran V, Seres T, Moriguchi T, Thomas JA, Johnston RB., Jr S-thiolation of glyceraldehyde-3-phosphate dehydrogenase induced by the phagocytosis-associated respiratory burst in blood monocytes. J Biol Chem. 1994 Oct 7;269(40):25010–25015. [PubMed] [Google Scholar]
- 34.Himmelfarb J, McMenamin E, McMonagle E. Plasma aminothiol oxidation in chronic hemodialysis patients. Kidney Int. 2002 Feb;61(2):705–716. doi: 10.1046/j.1523-1755.2002.00151.x. [DOI] [PubMed] [Google Scholar]
- 35.Dandona P, Ghanim H, Chaudhuri A, Dhindsa S, Kim SS. Macronutrient intake induces oxidative and inflammatory stress: potential relevance to atherosclerosis and insulin resistance. Exp Mol Med. 2010 Apr 30;42(4):245–253. doi: 10.3858/emm.2010.42.4.033. [DOI] [PMC free article] [PubMed] [Google Scholar]
- 36.Mohanty P, Ghanim H, Hamouda W, Aljada A, Garg R, Dandona P. Both lipid and protein intakes stimulate increased generation of reactive oxygen species by polymorphonuclear leukocytes and mononuclear cells. Am J Clin Nutr. 2002 Apr;75(4):767–772. doi: 10.1093/ajcn/75.4.767. [DOI] [PubMed] [Google Scholar]
- 37.Sies H, Stahl W, Sevanian A. Nutritional, dietary and postprandial oxidative stress. J Nutr. 2005 May;135(5):969–972. doi: 10.1093/jn/135.5.969. [DOI] [PubMed] [Google Scholar]
- 38.Miyamoto T, Rashid Qureshi A, Yamamoto T, et al. Postprandial metabolic response to a fat- and carbohydrate-rich meal in patients with chronic kidney disease. Nephrol Dial Transplant. 2011 Jul;26(7):2231–2237. doi: 10.1093/ndt/gfq697. [DOI] [PubMed] [Google Scholar]
- 39.Kirlin WG, Cai J, Thompson SA, Diaz D, Kavanagh TJ, Jones DP. Glutathione redox potential in response to differentiation and enzyme inducers. Free Radic Biol Med. 1999 Dec;27(11–12):1208–1218. doi: 10.1016/s0891-5849(99)00145-8. [DOI] [PubMed] [Google Scholar]
- 40.Lang KS, Duranton C, Poehlmann H, et al. Cation channels trigger apoptotic death of erythrocytes. Cell Death Differ. 2003 Feb;10(2):249–256. doi: 10.1038/sj.cdd.4401144. [DOI] [PubMed] [Google Scholar]
- 41.Myssina S, Huber SM, Birka C, et al. Inhibition of erythrocyte cation channels by erythropoietin. J Am Soc Nephrol. 2003 Nov;14(11):2750–2757. doi: 10.1097/01.asn.0000093253.42641.c1. [DOI] [PubMed] [Google Scholar]
- 42.Calderon-Salinas JV, Munoz-Reyes EG, Guerrero-Romero JF, et al. Eryptosis and oxidative damage in type 2 diabetic mellitus patients with chronic kidney disease. Mol Cell Biochem. 2011 Nov;357(1–2):171–179. doi: 10.1007/s11010-011-0887-1. [DOI] [PubMed] [Google Scholar]
- 43.Ghashghaeinia M, Cluitmans JC, Akel A, et al. The impact of erythrocyte age on eryptosis. Br J Haematol. 2012 Jun;157(5):606–614. doi: 10.1111/j.1365-2141.2012.09100.x. [DOI] [PubMed] [Google Scholar]
- 44.Vos FE, Schollum JB, Coulter CV, Doyle TC, Duffull SB, Walker RJ. Red blood cell survival in long-term dialysis patients. Am J Kidney Dis. 2011 Oct;58(4):591–598. doi: 10.1053/j.ajkd.2011.03.031. [DOI] [PubMed] [Google Scholar]
- 45.Samiec PS, Drews-Botsch C, Flagg EW, et al. Glutathione in human plasma: decline in association with aging, age-related macular degeneration, and diabetes. Free Radic Biol Med. 1998 Mar 15;24(5):699–704. doi: 10.1016/s0891-5849(97)00286-4. [DOI] [PubMed] [Google Scholar]
Associated Data
This section collects any data citations, data availability statements, or supplementary materials included in this article.


