Abstract
We have developed a Quantitative Light Absorption Analysis (QLAA) method to rapidly estimate human lymphocyte concentrations isolated from small volumes of whole blood. Measurements of the light absorption analysis were calibrated for lymphocyte concentration levels using a hemocytometer. To validate the QLAA system, blood samples were collected from 17 healthy donors and lymphocyte absorption measurements were directly compared with the manual microscope counting. The results showed that lymphocyte measurements obtained using the QLAA system were comparable with the manually scored lymphocyte counts but with measurements taken in seconds.
Keywords: QLAA, lymphocyte, radiation RABiT
I. INTRODUCTION
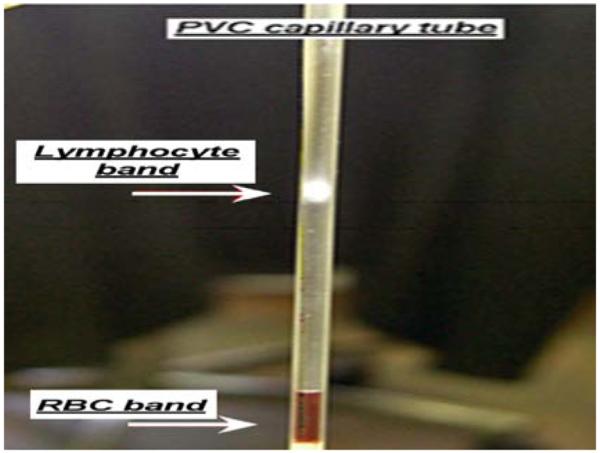
In a radiation mass casualty event, there will be a need to rapidly determine lymphocyte counts and pre-screen thousands blood samples for radiation biodosimetry measurements. At the Center for High-Throughput Minimally Invasive Radiation Biodosimetry, we have developed a Rapid Automated Biodosimetry Tool (RABiT) that is designed to be a completely automated, ultra-high throughput robotically-based biodosimetry workstation [1-3]. The RABiT system is designed to analyse finger stick-derived blood samples (30 μl, essentially a single drop of blood) to estimate an individual’s past irradiation dose. The first step of the automated process is to isolate mononuclear lymphocytes from whole blood samples in heparin-coated PVC capillary tubes using a density gradient medium and centrifugation. Fig. 1 shows the separation of the lymphocytes from the red blood cells (RBCs) and platelets by centrifugation. Once the lymphocyte-rich band is formed, the capillary tube is laser-cut below the band and the lymphocytes are released into filter-bottomed multi-well plates for in situ assay processing [4].
Fig. 1.

Isolation of blood lymphocyte band in a PVC capillary tube following centrifugation.
The motivation for this study was to design a prototype tool for the RABiT work station that can automatically quantify the number of lymphocytes present in the isolated band, which will provide an immediate “red flag” to identify individuals with low lymphocyte counts, without having to wait for the sample to be fully processed. Because lymphocyte number will drop dramatically after radiation exposure [5], a rapid lymphocyte concentration pre-screen will help to identify the individuals from the thousands of people accidently exposed to irradiation. The traditional method to determine blood cell counts from capillary-spun blood samples is to use the quantitative buffy coat analysis (QBC) analysis method [6-7]. This approach uses a modified microhematocrit tube containing a floater to expand and differentiate the specific layers of separated blood cells. The differentiation process is normally conducted by using a micrometer. Then, the measured band lengths are converted into cell count equivalents with the calibrated factors. Although this method has been verified to produce accurate blood cell measurements, the problem with incorporating these capillaries into the RABiT system is that the float in capillary will block the laser cutting process which is a key step for the release of the lymphocytes and implementation of the bioassay protocols. Also this method is relative slow considering the process needs only seconds.
In the present study, we will describe a novel, rapid, Quantitative Light Absorption Analysis (QLAA) method to measure human lymphocyte concentration in a small, 30 μl sample of blood. The principle of this device is to quantify the light absorbance signal produced by the concentrated lymphocyte band to determine the number of lymphocytes/μl whole blood. The testing of the system showed that the absorbance of the collimated light signal is linear to lymphocyte concentration. The system was calibrated with known concentrations of lymphocytes of whole blood and tested using unknown lymphocyte concentrations from blood samples collected from a group of 17 healthy volunteers. Direct comparison with measurements using a manual microscope counting chamber validated the use of the QLAA method for accurately determining lymphocyte levels in these donors.
II. METHOD AND DEVICE
The principle of light absorption in material is described by Beer-Lambert Law [8] which can be expressed as:
| (1) |
| (2) |
Where T is the transmittance; I0 is the intensity of the incident light; I1 is the light intensity after passing through the material; A is the absorbance; l is the distance that the light travels through the material (the path length); C is the concentration of absorbing species in the material; α is the absorption coefficient of the species.
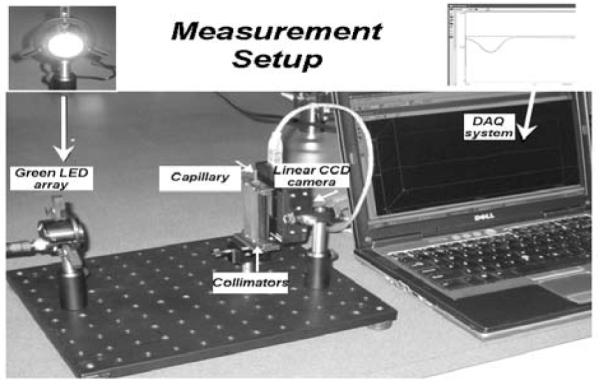
The setup for light absorption measurements is presented in Fig. 1. The light source is a green LED array light source (LIU002, Thorlabs, Newton, NJ; wavelength 525 nm) providing a roughly parallel incident light beam. The light beam is collimated by a custom-designed double aperture collimator which also serves as the sample tube holder. The first aperture has a width about 1/5 of capillary diameter and of the same height as the capillary tube. After passing through the first aperture and the sample, light is collimated by a second narrow collimator (same width of the first one) which blocks the scattered light and only allows the transmittance light to pass. A Thorlabs 12-Bit CCD Line camera (LC1-USB, 3000 pixel linear silicon CCD array) is used to measure the light intensity along the axis of the capillary tube.
III. QLAA SYSTEM CALIBRATION
To calibrate light absorbance values against specific lymphocyte concentrations, peripheral whole blood (1-2 ml) was collected in a heparinized vacutainer tube from one healthy donor. From this sample, small blood volumes of 10, 15, 20, 25 and 30 μl were pipetted into a PVC capillary tube (Safe-T-Fill capillaries; RAM Scientific Inc., Yonkers, NY) containing 50 μl of lymphocyte separation medium (Histopaque™ 1083; Invitrogen Eugene, OR). To isolate the lymphocytes (and other mononuclear cells), each capillary was centrifuged at a speed of 3750 rpm for five minutes (adjustable speed centrifuge Legend Micro 17; Thermo Scientific). A lymphocyte-rich band of roughly 100% purity (i.e. no RBC contamination) is formed at the interface between the blood plasma and lymphocyte separation media as shown in Fig. 1. After centrifugation, each capillary was placed in the QLAA system and the light absorption measurements were recorded. The band can be seen in the linear camera with a very obvious dip (see graph insert in Fig. 2). The depth of the dip is dependent on the density of lymphocytes in the band and the integrated light absorption is proportion to the lymphocytes number. To assess the contribution of the lymphocyte separation media to the total light absorbance values, background absorbance values were measured in PVC capillaries filled with only separation media. After correcting for background, the light absorption values were quantified using an analysis code written in Matlab (Mathworks Company, Natick, MA). Once all the light absorption measurements have been determined for each of the samples, the capillaries were cut below the lymphocyte band and released into a cuvette containing 250 μl of phosphate buffered saline (PBS) making the total volume for each sample 300 μl.
Fig. 2.

QLAA measurement setup.
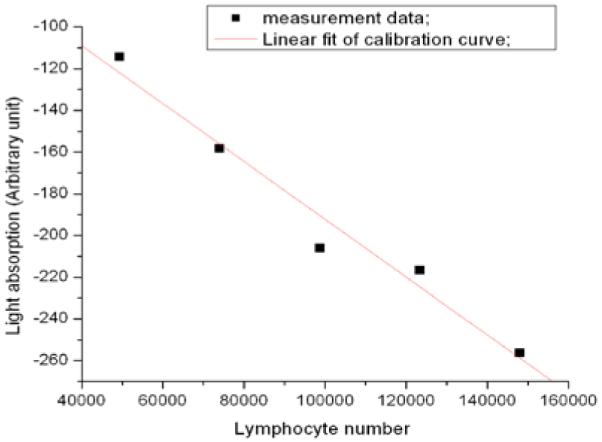
The lymphocyte concentration per sample was then determined manually using a hemocytometer (VWR Scientific; West Chester, PA). The hemocytometer is an engraved chamber with a laser-etched grid of perpendicular lines in which the area and depth are known. Simply, once the lymphocyte sample is pipetted into the space between the chamber and overlying cover slip, the lymphocytes were visualized and counted. After correcting for dilution factors, the resulting lymphocyte counts from 10, 15, 20, 25 and 30 μl whole blood samples were corroborated with the light absorption values. The calibration curve (Fig. 3) is determined based on different amount of total lymphocytes (e.g. from 10, 15, 20, 25, 30 μl whole blood respectively). Lymphocyte concentrations in the peripheral blood of healthy adults are variable, with a reported range 1300-4800/μl [9].
Fig. 3.

Lymphocyte calibration curve.
IV. QLAA SYSTEM TESTING
In order to test the QLAA system under realistic conditions, peripheral blood samples (1-2 ml) were collected from 17 different patient donors aged between 24 and 55 years after informed consent was obtained. For each of the donors, lymphocytes were isolated from 30 μl whole blood using the lymphocyte isolation method described previously. The QLAA-based lymphocyte count was obtained by measuring the light absorbance values for each sample and using the calibration curve (Fig. 3) to predict the results. Each measurement was taken in seconds. The lymphocytes were then released into PBS and the counts determined using the hemocytometer.
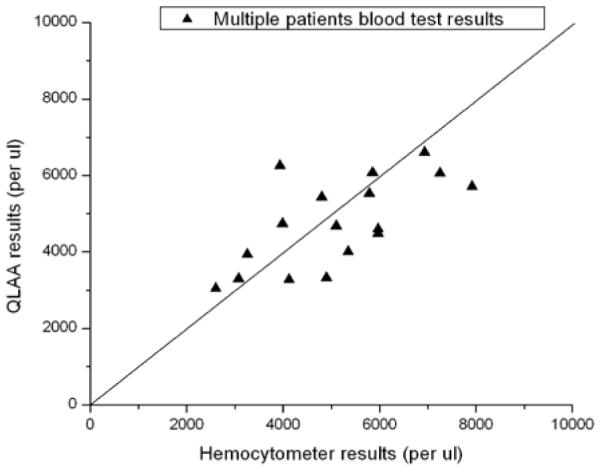
Comparison of the results based on both methods is shown in Fig. 4. The standard deviations of the ratios for the different methods were 23%. These results show that majority of the lymphocyte measurements fall in the range of 2000 to 6000 lymphocytes/μl which closely correlates with the healthy adult normal range [9]. These results suggest that the automatic QLAA method will provide a very rapid and relative accurate approach for automatic human lymphocyte concentration measurements in peripheral whole blood samples.
Fig. 4.

Multiple patient’s blood test results.
V. CONCLUSIONS
In this paper, we have reported a novel, rapid QLAA method to measure lymphocyte concentrations in small volumes of blood. The method relies on light absorption of an isolated lymphocyte band after blood separation. As opposed to the QBC method, the capillaries do not require the presence of a floater in the PVC tube and thus, errors from reading the boundary of the band are avoided. The limitations of the QLAA system should also be appreciated. It is still relied on the calibration factors. So the light absorption calibration curve measurement need to be carefully performed.
The motivation for this study was to design a system that could be used to pre-screen blood lymphocyte concentrations before they are processed for biological handling in our high through-put biodosimetry work station. The prototype device tests show that QLAA measurements are fast and can accurately measure lymphocyte concentrations in line with the high throughput capacity of our biodosimetry workstation.
ACKNOWLEDGMENT
We thank Brian Ponnaiya and Charles Geard kindly giving us helps on the measurement and also thank Gary Jonson manufacture the sample holder and apertures. This work is supported by NIAID Grant U19 AI067773.
Footnotes
ht2231@columbia.edu
REFERENCES
- [1].Garty Guy, Chen Youhua, Salerno Alessio, Turner Helen, Zhang Jian, Lyulko Oleksandra V, Xu Yanping, Wang Hongliang, Simaan Nabil, Randers-Pehrson Gerhard, Yao Lawrence, Amundson Sally A, Brenner David J. The RABiT: A Rapid Automated Biodosimetry Tool for radiological triage. Health Physics Journal. 2010 Feb;98(2):209–217. doi: 10.1097/HP.0b013e3181ab3cb6. [DOI] [PMC free article] [PubMed] [Google Scholar]
- [2].Garty Guy, Chen Youhua, Turner Helen C, Zhang Jian, Lyulko Oleksandra V, Bertucci Antonella, Xu Yanping, Wang Hongliang, Simaan Nabil, Randers-Pehrson Gerhard, Yao Lawrence Y, Brenner DJ. The RABIT: A Rapid Automated BIodosimetry Tool For Radiological Triage. II. Technological Developments. International Journal of Radiation Biology. 2011 May; doi: 10.3109/09553002.2011.573612. [DOI] [PMC free article] [PubMed] [Google Scholar]
- [3].Chen Y, Zhang J, Wang H, Garty G, Xu Y, Lyulko O, Turner H, Randers-Pehrson G, Simaan N, Yao L, Brenner D. Development of a Robotically-based Automated Biodosimetry Tool for High-throughput Radiological Triage. International Journal of Biomechatornics and Biomedical Robotic. 2010;1(2) [Google Scholar]
- [4].Turner Helen C., Brenner David J., Chen Youhua, Bertucci Antonella, Zhang Jian, Wang Hongliang, Lyulko Oleksandra V., Xu Yanping, Shuryak Igor, Schaefer Julia, Simaan Nabil, Randers-Pehrson Gerhard, Yao Y. Lawrence, Amundson Sally A., Garty Guy. Adapting the γ-H2AX Assay for Automated Processing in Human Lymphocytes. 1. Technological Aspects. Radiation Research. 2011 Mar;Vol. 175(Issue 3):282–290. doi: 10.1667/RR2125.1. [DOI] [PMC free article] [PubMed] [Google Scholar]
- [5].Waselenko JK, et al. Medical Management of the Acute Radiation Syndrome: Recommendations of the Strategic National Stockpile Radiation Working Group. Annals of Internal Medicine. vol. 140(no. 12):1037–1051. doi: 10.7326/0003-4819-140-12-200406150-00015. [DOI] [PubMed] [Google Scholar]
- [6].Wardlaw SC, Levine RA. Quantitative buffy coat analysis. A new laboratory tool functioning as a screening complete blood cell count. The Journal of the American Medical Association (JAMA) 1983 Feb 4;249(5):617–20. doi: 10.1001/jama.249.5.617. [DOI] [PubMed] [Google Scholar]
- [7].Riccardi A, Danova M, Quartero L, et al. Hematological values from quantitative buffy coat analysis (QBC II) system: evaluation in a hematological/oncological outpatient section. Haematologica. 1989 Jul-Aug;74(4):375–8. [PubMed] [Google Scholar]
- [8].Robinson JW. The Beer-Lambert Law. Atomic Spectroscopy. (Second Edition) 1996 Jul 24;:27. [Google Scholar]
- [9].International Atomic Energy Agency, World Health Organization . Safety Report Series No.2. IAEA; Vienna: 1998. Diagnosis and Treatment of Radiation Injuries. [Google Scholar]


