



Abstract
This work investigates gene delivery using polymer microbubbles triggered by ultrasound in vitro. The effect of pressure amplitude (0 – 2 MPa), center frequency (1 – 5 MHz), pulse length (3 – 12000 μs), pulse repetition frequency (5 – 20000 Hz) and exposure time (0 – 30 seconds) on transfection efficiency and cell viability were examined. The effects of radiation force, calcium ion concentration and timing of treatments were also examined. Cells were successfully transfected with pressure amplitudes as low as 250 kPa. Transfection was most efficient with lower frequencies and longer pulse lengths with a transfection efficiency of 24.2 ± 2.0% achieved using a center frequency of 1 MHz, pressure amplitude of 1 MPa, pulse length of 12000 μs and pulse repetition frequency of 5 Hz. Gene delivery was also affected by the extracellular calcium ion concentration and the timing of treatments.
Keywords: Ultrasound contrast agent, microbubble, gene delivery, polymer, sonoporation
Introduction
Gene therapy requires the transfer of genetic material into the nucleus of targeted cells followed by sufficient levels of gene expression to treat the target disease. However, the effectiveness of gene therapy has been limited by the lack of safe and efficient methods for delivering genes into cells. Viruses have been the most commonly used vectors for gene delivery (Edelstein et al. 2007), however, the limitations of some viral vectors including a relatively small capacity for therapeutic DNA (Geis et al. 2012) and some safety concerns including insertion mutagenesis associated with retroviral vectors (Donahue et al. 1992) and the risk of a severe immune response observed with some adenoviral vectors (Liu and Muruve 2003) have created a need for non viral delivery methods. Simple injection of plasmid DNA directly into tissue is a straight forward and non immunogenic method of gene delivery that and has shown moderate success in muscle tissue but is restricted to low levels of transgene expression and limited distribution (Kawabata et al. 1995; Gao et al. 2007). Most plasmids are not rapidly taken up by cells due to their large size (> 2 MDa) and negative charge. Free plasmid DNA has a half life of approximately ten minutes in whole blood (Kawabata et al. 1995) and unprotected plasmids that are taken into the cell by endocytosis can be degraded by the low pH of lysosomes (Coonrod et al. 1997). Plasmids that escape the lysosomes are subjected to nucleases that give plasmids a half life of 50–90 minutes in the cytosol (Lechardeur et al. 1999). Synthetic vectors have been developed to improve the transfection efficiency of naked DNA without generating the safety concerns associated with viral vectors. Cationic polymers and cationic liposomes are the most efficient and widely used synthetic vectors for gene delivery (Zabner 1997) and recent improvements have been able to increase their biocompatibility and reduce degradation in vivo (Balazs and Godbey 2011). Gene therapy can also be achieved through physical delivery methods (such as laser irradiation, electroporation or sonoporation (Mehier-Humbert and Guy 2005b)) that can create transient holes in the plasma membrane allowing DNA to enter the cell.
Ultrasound contrast agents (UCA) are small gas bubbles (< 6 μm) encapsulated within a lipid, albumin or polymer shell (Geis et al. 2012). When exposed to an acoustic pulse, the highly compressible gas core of UCA will rapidly expand and contract in response to the applied pressure rarefaction and compression (Postema et al. 2004; Azmin et al. 2012). When exposed to moderate ultrasound intensities (mechanical index 0.1 – 0.5), UCA will undergo stable cavitation where the bubbles will oscillate around a resonant diameter (Newman and Bettinger 2007). The wall of vibrating UCA can expand and contract millions of times per second with wall velocities as high as 700 m/s (Chomas et al. 2000). These oscillations create a steady flow of fluid surrounding the UCA, termed microstreaming (Wu 2002; Doinikov and Bouakaz 2010). With higher intensities the UCA can undergo inertial cavitation where the bubbles will rapidly expand due to the rarefaction phase of the ultrasound wave, then collapse due to the inertia of the fluid surrounding the bubbles flowing in during the compression phase (Newman and Bettinger 2007). This violent bubble collapse can generate localized mechanical shock waves, microstreaming, microjets, free radicals and temperatures as high as 5000 °K (Ohl and Wolfrum 2003; Ohl et al. 2006; Forbes et al. 2008).
The use of ultrasound to increase the permeability of cell membranes is known as sonoporation and can be caused by microstreaming (Wu 2002; van Wamel et al. 2006) as well as more violent microbubble collapse and can involve enhanced endocytosis (Juffermans et al. 2008; Meijering et al. 2009) or the formation of non specific pores (Mehier-Humbert and Guy 2005a; Lentacker et al. 2009; Geers et al. 2011). Application of ultrasound in combination with microbubbles and free plasmid DNA provides greater transfection efficiency compared to plasmid alone and plasmid with ultrasound without UCA. Ultrasound combined with Optison UCA were able to increase transgene expression by 300 fold compared to naked DNA in vascular smooth muscle cells in vitro (Lawrie et al. 2000). Similar in vitro studies have shown albumin or lipid UCA combined with ultrasound can improve transfection of many different cell lines including Chinese hamster ovary cells (Rahim et al. 2006), cardiomyocytes (Wang et al. 2011) and cancer cells (Guo et al. 2006). Others have used lipid UCA for gene therapy in vivo to treat conditions including cardiovascular disease (Fujii et al. 2009), diabetes (Chen et al. 2006), cancer (Carson et al. 2011), xerostomia or Sjorgen’s Syndrome (Passineau et al. 2010). Polymer UCA can also be used for ultrasound triggered gene delivery, however they have been used much less frequently than lipid and albumin microbubbles. Mehier-Humbert et al. have shown that the properties of the gas and shell of UCA can influence their ability to transfect cells (Mehier-Humbert et al. 2007). Polymer shelled UCA made from polystyrene were shown to transfect cells only when insonated with pressures greater than 600 kPa compared to 200 kPa for lipid UCA (Mehier-Humbert et al. 2007). Other polymer UCA with a porous poly(lactic acid) PLA shell developed by El-Sherif et al. (El-Sherif and Wheatley 2003) may be useful for ultrasound triggered gene delivery due to their enhanced stability compared to lipid UCA, and their ability to carry a therapeutic payload (Eisenbrey et al. 2010; Cochran et al. 2011; Wheatley et al. 2012). This work focuses on the effect of acoustic parameters and exposure conditions on the ability of PLA UCA to transfect human breast cancer cells in vitro.
Materials and methods
Materials
Poly(lactic acid) (PLA) (100DL MW =83 KDa) was purchased from SurModics Biomaterials (Birmingham, AL). Camphor (95%), propidium iodide (95%) and an antibiotic solution (10,000 units penicillin and 10 mg streptomycin per ml), were purchased from Sigma-Aldrich (St. Louis, MO). RPMI 1640 with L-Glutamine was purchased from Mediatech Inc. (Manassas, Va). USDA tested Fetal bovine serum (FBS) was purchased from HyClone (Waltham, MA). Poly(vinyl alcohol) (PVA) (88% mole hydrolyzed MW = 25 KDa) was purchased from Polysciences (Warrington, PA. MCF 7 human breast cancer cells were purchased from ATTC (Manassas, VA). Ammonium carbonate (NF/FCC grade) was purchased from J.T. Baker (Phillipsburg, NJ). Methylene chloride (99.9%), hexanes (99.9%), and isopropyl alcohol (Reagent ACS grade) were from Fisher Scientific (Waltham, MA). All chemicals were used as received.
Contrast Agent Fabrication
Poly (lactic acid) ultrasound contrast agents were fabricated using a double emulsion technique previously developed in our lab (El-Sherif and Wheatley 2003). Five hundred milligrams of PLA were dissolved in 10 ml of pure methylene chloride along with 50 mg of camphor. When the PLA was completely dissolved, 1 ml of an ammonium carbonate solution (4% w/v in deionized water) was added to the polymer solution then immediately sonicated on ice for 30 seconds (10 pulses of 3 seconds each separated by 1 second) with 110 W applied power (Misonix Inc. CL4 tapped horn probe with 0.5 inch tip, Farmingdale, NY). The resulting water in oil emulsion was immediately added to 50 ml of a 5% w/v PVA solution and homogenized for 5 minutes at 9500 rpm with a Brinkman PT 3100 homogenizer and a Polytron PT-3020/2 saw tooth homogenizer probe (Brinkmann Instruments, Westbury, NY). Following homogenization, 100 ml of 2% v/v IPA was added to the emulsion then stirred for 1 hour to allow the methylene chloride to evaporate. The particles were then collected by centrifugation at 2500 g for 5 minutes and washed three times with hexane. After allowing any residual hexane to evaporate the particles were washed in water then frozen and lyophilized for 48 hours with a Vitris Benchtop freeze-dryer (Gardiner, NY). The water and ammonium carbonate from the core of the particles and the camphor from the polymer shell were allowed to sublime during lyophilization to create a porous polymer shell encapsulating a void which is filled with air when the microbubbles are returned to atmospheric pressure.
Microbubble size
The size distribution of PLA UCA was measured by dynamic light scattering using a Zetasizer Nano ZS (Malvern Instruments, Worcestershire, UK). One milligram of dry contrast agent was suspended in 1.5 ml PBS by vortexing for 10 seconds then transferred into a disposable cuvette and allowed to equilibrate for 3 minutes before taking measurements. The samples were then measured in triplicate and particle sizes were reported as peak % number.
Microbubble triggered gene delivery in vitro
The ability of PLA UCA to enhance gene delivery when triggered by ultrasound was examined in vitro. MCF 7 human breast cancer cells were grown on one of the gas-permeable, ultrasound-transparent membranes of an individual Opticell™ 1100 chamber (Catalog # 155331, Thermo Fisher Scientific, Rochester NY) with RPMI 1640 containing 10% FBS and 1% antibiotic until 80–90% confluent. The medium was then removed and replaced with 4 ml of warm (37°C) RPMI 1640 containing 10% FBS, plasmid DNA encoding enhanced green fluorescent protein (EGFP) (10 μg/ml) (a generous gift from Dr. Aleister Saunders, Biosciences department, Drexel University) and polymer UCA (0 – 1 mg/ml). No antibiotic was included in order to reduce the toxicity that can be caused by antibiotic passing through pores in cell membranes. The plasmid DNA expressing enhanced green fluorescent protein (from the jellyfish Aequorea victoria) under the control of a CMV promoter (pCMV-EGFP) was used to allow the detection of transfected cells (Zhang et al. 1996). The individual Opticell™ cartridge was then submerged in a 37 °C water bath and clamped in a vertical position with an unfocused, single element, 0.5 inch diameter ultrasound transducer (1.0, 2.25 or 5 MHz, with a −6 dB bandwidth of 58.9, 89.2 and 70.5% Panametrics-NDT, Waltham, MA) aligned perpendicularly to the Opticell™ at a distance from the front membrane equal to the natural focus of the transducer (the distance at which the transducers were calibrated using a hydrophone). The position of the transducer was adjusted manually with a xyz stage and the distance from the transducer to the outer membrane of the Opticell™ was measured using an oscilloscope (Lecroy 9350A, Chestnut Ridge, NY) to determine the time required for sound to be reflected from the membrane. The distance between the front and back membranes of the Opticell™ was approximately 2mm. The transducer was then excited by an 8116A Pulse/Function Generator (Hewlett-Packard Company, Palo Alto, CA) used to gate a Wavetek 5 MHz Lin/Log Sweep Generator Model 185 (San Diego, CA) which was amplified by an ENI model A150 (55dB) RF Power Amplifier (Rochester, NY) connected to the transducer. Transducers were calibrated with a Precision Acoustics HP series hydrophone by Dr. John Eisenbrey at Thomas Jefferson University. The Wavetek generator was used to generate a sign wave with the desired frequency, pulse length (PL), pulse repetition frequency (PRF) and amplitude. Each Opticell was insonated in three sections that had previously been marked on the outer membrane surface with a marker pen. Each section had a radius of 4 mm and was separated from the other sections by 25 mm. A fourth section at least 25 mm from all exposed sections was not exposed to ultrasound and acted as a control. After insonation, the Opticell was gently removed from the water bath and dried, and 6 ml of fresh RPMI 1640 with 10% FBS was added to fill the Opticell which was then placed in the incubator. After 4 hours, the medium and bubbles in the Opticell were removed and replaced with fresh RPMI 1640 with 10% FBS and 1 % antibiotic. The 4 hour wait was to allow viable cells that may have been detached during insonation to reattach to the Opticell before non viable cells were removed when the media was replaced. The cells were then placed back in the incubator at 37 °C, 99% humidity and 5% CO2.
Analysis of gene delivery efficiency
Twenty four hours after insonation, EGFP expression was quantified. The cells were stained with propidium iodide with a final concentration of 2 μg/ml to label dead cells, then imaged with an Olympus IX71 microscope using a FITC filter (HQ480/40 excitation filter with a center wavelength (CWL) of 480 nm and a full width half maximum (FWHM) bandwidth of 40 nm, HQ535/50 emission filter with a CWL of 535 nm and FWHM bandwidth of 50 nm) and TRITC filter (HQ545/30 excitation filter with a CWL of 545 nm and FWHM bandwidth of 30 nm, HQ610/75 emission filter with a CWL of 610 nm and a FWHM bandwidth of 75 nm) along with phase contrast (all optical filters were from Chroma Technology Corp, Bellows Falls, VT). Five images were taken across each insonated region along with five images across an uninsonated region. The total number of viable cells and the total number of viable cells expressing EGFP per image were counted (a minimum of 250 cells were counted in each image and a minimum of 1250 cells were counted in each insonated region). The percentage of cells expressing EGFP was calculated as:
| (1) |
and the cell viability was calculated as:
| (2) |
This measurement of cell viability provides an estimate of the number of cells that were killed or detached from the Opticell during ultrasound exposure similar to the methods described by others (Rahim et al. 2006; Meijering et al. 2007; Phillips et al. 2010), however it does not provide an exact count of cell loss immediately after exposure.
The total fluorescence intensity was also quantified to measure differences in EGFP expression. The total EGFP expression in each image is expected to be affected by the transfection efficiency, number of plasmids delivered to each cell (Tseng et al. 1997) as well as the health of the cells. Cells were imaged with a FITC filter with a constant gain and exposure. Five images were taken across each insonated region and 5 images across an uninsonated region. The background was subtracted and the fluorescence intensity of each image was calculated using ImageJ (National Institutes of Health, Bethesda, Maryland) and is reported as relative fluorescence units (RFU).
Ultrasound exposure
The effects of the following parameters on transfection efficiency, total fluorescence intensity and cell viability were examined: center frequency, pressure amplitude, PRF, PL, duty cycle (DC), PLA microbubble concentration, exposure time, buffer used during transfection and timing of ultrasound exposure. Pressure amplitudes were calculated from peak negative pressures (PNP) and intensity was calculated as shown in equations 3, 4 and 5:
| (3) |
| (4) |
| (5) |
where ISPPA is the spatial peak pulse average intensity, ISPTA is the spatial peak temporal average intensity, ρ is the density of water (1000 kg/m3), c is the speed of sound in water (approximately 1500 m/s) and Prms is the root mean square of the peak negative pressure.
Pressure amplitude
Cells were insonated with three different center frequencies (1, 2.25 and 5 MHz) and peak negative pressure amplitudes of 0, 0.1, 0.25, 0.5, 1 and 2 MPa. A constant PRF of 3000 Hz, PL of 20 μs and exposure time of 15 seconds was used to insonate cells with RPMI 1640 and 10% FBS containing 10 μg/ml plasmid DNA and 0.25 mg/ml PLA UCA (n=5).
Duty cycle
Cells were insonated with a center frequency of 1 MHz and peak negative pressure amplitude of 500 kPa. A constant PL of 20 μs was maintained as the DC was adjusted to 0.02, 0.06 and 0.18 by using a PRF of 1000, 3000 and 9000 Hz. The DC was also adjusted by maintaining a constant PRF of 3000 Hz and adjusting the PL to 7, 20 and 60 μs. A constant exposure time of 15 seconds was used to insonate cells with RPMI 1640 and 10% FBS containing 10 μg/ml plasmid DNA and 0.25 mg/ml PLA UCA (n=4).
Pulse repetition frequency and pulse length
Cells were insonated with three different center frequencies (1, 2.25 and 5 MHz) and a constant peak negative pressure amplitude of 1 MPa. A constant DC of 0.06 was maintained while simultaneously adjusting the PRF to 5, 20, 200, 3000 and 20000 Hz and the PL to 12000, 3000, 300, 20 and 3 μs. A constant exposure time of 15 seconds was used to insonate cells in RPMI 1640 with 10% FBS containing 10 μg/ml plasmid DNA and 0.25 mg/ml PLA UCA (n=5).
Pressure and pulse length
Cells were insonated with three center frequencies (1, 2.25 and 5 MHz) and a constant ISPTA of 2.0 W/cm2 or 0.33 W/cm2. A constant PRF of 3000 Hz was maintained while simultaneously adjusting the PL to 5, 20 and 80 μs and pressure amplitude to 2.0, 1.0 and 0.5 MPa in order to maintain an ISPTA of 2.0 W/cm2. To maintain a constant ISPTA of 0.33 W/cm2, the PL was adjusted to 62.5, 250 and 1000 ms and the pressure amplitude was changed to 400, 200 and 100 kPa while maintaining a constant PRF of 1 Hz. A constant exposure time of 15 seconds was used to insonate cells with RPMI 1640 with 10% FBS containing 10 μg/ml plasmid DNA and 0.25 mg/ml PLA UCA (n=5).
Microbubble concentration
Cells were insonated with a center frequency of (1, 2.25 and 5 MHz), pressure amplitude of 1 MPa, PL of 12 ms and PRF of 5 Hz. A constant exposure time of 15 seconds was used to insonate cells in RPMI 1640 with 10% FBS and 10 μg/ml plasmid DNA. Microbubble concentrations of 0, 0.025, 0.05, 0.25 and 1.0 mg/ml UCA were tested (n=5).
Exposure time
Cells were insonated with a center frequency of 1 MHz, pressure amplitude of 1 MPa, PL of 12 ms and PRF of 5 Hz. Cells were incubated with RPMI 1640 with 10% FBS and 10 μg/ml plasmid DNA and 0.05 mg/ml UCA then insonated for 0, 2, 15 or 30 seconds (n=6).
Radiation force
Cells were insonated as above. A constant exposure time of 15 seconds was used to insonate cells in RPMI 1640 with 10% FBS, 10 μg/ml plasmid DNA and 0.05 mg/ml UCA. An Opticell with cells growing in a monolayer on one membrane of the chamber was placed in the water bath so that the primary radiation forces from the ultrasound would push the microbubbles towards the cells or away from the cells (n=6).
Calcium and magnesium ion concentrations
Cells were insonated as above. A constant exposure time of 15 seconds was used to insonate cells in 4 ml of PBS with 10 μg/ml plasmid DNA and 0.05 mg/ml UCA. A constant magnesium chloride concentration of 0.49 mM was added to PBS along with calcium chloride concentrations of 0, 0.25, 0.5, 1, 1.5 or 2 mM. Or, the calcium chloride concentration was held constant at 1 mM as the magnesium chloride concentration was changed to 0, 0.5 and 1 mM. Two minutes after cells were exposed to ultrasound, 6 ml of RPMI 1640 with 10% FBS was added the Opticell which was then placed in the incubator for 4 hours before the media was replaced with complete media containing 10% FBS and 1% antibiotic (n=6).
Multiple exposures
Cells were insonated as above. A constant exposure time of 15 seconds was used to insonate cells in RPMI 1640 with 10% FBS, 10 μg/ml plasmid DNA and 0.05 mg/ml UCA. After the first ultrasound exposure, cells were placed back in the incubator. After 4 hours, one group of Opticells (0 h 4 h) was removed from the incubator and the media was replaced with RPMI 1640 with 10% FBS and fresh plasmid DNA and UCA at the same concentration used in the first treatment. The Opticell was placed into the water bath in the same position and treated with the same ultrasound exposure. A second group (0 h 12 h) was exposed to a second identical ultrasound treatment 12 hours after the initial treatment. A third group (1x) was exposed to only a single treatment. Four hours after each treatment the media was replaced with complete media containing 10% FBS and 1% antibiotic (n=5).
Comparison with Optison
The transfection efficiency achieved with PLA UCA was compared with a commercially available ultrasound contrast made with an albumin shell encapsulating octafluoropropane, Optison. PLA microbubbles at a concentration of 0.05 mg/ml or approximately 1.5 × 10⁶ microbubbles/ml were added to cells and insonated (1MHz, 1 MPa, PRF=5 Hz, PL=12 ms) for 15 seconds in RPMI 1640 with 10% FBS and 10 μg/ml plasmid DNA. This was compared cell cells insonated with the same conditions using Optison UCA (1.5 × 10⁶ microbubbles/ml) in place of PLA microbubbles (n=6).
Statistical analysis
Each exposure condition was evaluated in at least 4 separate experiments. All data are expressed as a mean value ± standard error of the mean. Statistically significant differences for multiple groups were determined using a one way ANOVA with Tukey’s multiple comparison post test. Statistical significance was defined as p < 0.05. All testing was done using Prism 5 (GraphPad, San Diego, CA).
Results and Discussion
Pressure amplitude
The effect of acoustic pressure amplitude on transfection efficiency and cell viability was examined first to determine if a pressure threshold exists for these PLA UCA and how it compared with other polymer and lipid UCA (Mehier-Humbert et al. 2007; Bohmer et al. 2010). Cells were insonated with three different center frequencies (1, 2.25 and 5 MHz) using a constant PL of 20 μs, constant PRF of 3000 Hz and a constant exposure time of 15 seconds. PLA UCA with a diameter of 1.6 ± 0.2 μm were used at a concentration of 0.25 mg/ml. Exposing UCA to an acoustic pressure amplitude of 100 kPa provided no significant increase in transfection compared to uninsonated cells with any of the frequencies tested (p<0.05) from 0.09 ± 0.02% with no ultrasound to 0.15 ± 0.06%, 0.17 ± 0.4% and 0.14 ± 0.04% at 100 kPa using center frequencies of 1, 2.25 and 5 MHz. There was also no significant increase in the fluorescence intensity observed in cells insonated with a pressure amplitude of 100 kPa compared to uninsonated cells (0.52 × 10⁶ ± 0.01 × 10⁶ RFU for uninsonated cells compared to 0.58 × 10⁶ ± 0.02 × 10⁶ RFU, 0.64 × 10⁶ ± 0.04 × 10⁶ RFU and 0.65 × 10⁶ ± 0.03 × 10⁶ RFU for cells insonated at 100 kPA with a frequency of 1, 2.25 or 5 MHz). The low fluorescence observed in uninsonated cells is believed to be the autofluorescence (fluorescent images of uninsonated cells are also shown in row 1 of figure 4). This indicates that there is a pressure threshold greater than 100 kPa required for transfection with these PLA UCA. Increasing the pressure amplitude from 100 to 250 kPa resulted in a significant increase in transfection for cells insonated with 1 MHz (10.2 ± 0.8%, p<0.05) and 2.25 MHz (10.7 ± 1.1%, p<0.05), but not 5 MHz (0.3 ± 0.1%, p>0.05) as shown in figure 1a. Increasing the pressure amplitude to 500 kPa resulted in a significant increase in transfection efficiency for 1 MHz (15.3 ±1.5, p<0.05) and 5 MHz (8.3 ± 1.0%, p<0.05) compared to 250 kPa but no significant increase in transfection was achieved by further increasing the pressure amplitude to 1000 kPa (17.3 ± 1.2%, 11.8 ± 1.0% and 10.1 ± 0.6% for 1, 2.25 and 5 MHz, p>0.05). The maximum transfection efficiency achieved with these conditions was 17.3 ± 1.2% with 1 MHz and 1 MPa. A similar trend was observed with the total EGFP-derived fluorescence intensity of these cells as shown in figure 1b, with the highest fluorescence intensity occurring at 1 MPa for all three frequencies (4.3 × 10⁶ ± 0.4 × 10⁶ RFU, 3.3 × 10⁶ ± 0.1 × 10⁶ RFU and 2.8 × 10⁶ ± 0.2 × 10⁶ RFU for 1, 2.25 and 5 MHz). This suggests that microbubbles triggered with lower frequencies of ultrasound were more effective at creating pores in cells compared to the higher 2.25 and 5 MHz frequencies.
Figure 4.

Fluorescent images of MCF 7 breast cancer cells expressing GFP 24 hours after exposure to ultrasound with a constant acoustic pressure amplitude of 1 MPa while the PRF and PL were simultaneously adjusted to maintain a constant DC of 0.06 and an ISPTA of 2.0 W/cm2 (size bar = 100 μm).
Figure 1.

The effect of pressure amplitude and center frequency on (a) transfection efficiency, (b) total fluorescence intensity and (c) cell viability. MCF 7 cells were insonated for 15 seconds with 0.25 mg/ml PLA UCA and 10 μg/ml plasmid DNA with a PL of 20 μs and PRF of 3000 Hz (*p<0.05, n=5).
In previous studies the resonance frequency of these PLA UCA has been measured to be in the range of 2.28 – 3.2 MHz. However, here the transfection efficiency was significantly greater when using 1 MHz compared to 2.25 or 5 MHz for pressure amplitudes of 500 kPa or greater. The threshold for transfection at 1 and 2.25 MHz (100–250 kPa) was also lower than the threshold for 5 MHz (250–500 kPa). This agrees with other studies using lipid and albumin UCA that have observed improved sonoporation and lower pressure thresholds with lower frequencies (Apfel and Holland 1991; Miller et al. 1999; Karshafian et al. 2009). The acoustic pressure amplitudes necessary for ultrasound triggered gene delivery with lipid microbubbles can range from 130 to 500 kPa (Rahim et al. 2006; Mehier-Humbert et al. 2007; Meijering et al. 2007), similar pressure thresholds from 120 to 400 kPa were observed for albumin microbubbles (Bao et al. 1997; Greenleaf et al. 1998; Larina et al. 2005). One study found the pressure amplitude threshold of polymer UCA, consisting of air filled polystyrene microbubbles, to be between 400 and 600 kPa (Mehier-Humbert et al. 2007) which is nearly double the pressure amplitude needed for the PLA UCA examined in this study.
The effect of pressure amplitude on cell viability was also examined and is shown in figure 1c. Increasing the pressure amplitude to the threshold for transfection (250 kPa for 1 and 2.25 MHz and 500 kPa for 5 MHz) also resulted in a significant drop in cell viability (63.3 ± 3.3 %, 77.7 ± 2.8% and 90.3 ± 2.4% for 1, 2,25 and 5 MHz p<0.05) with significantly more cell death in samples treated with 1 MHz compared to 2.25 or 5. Similar trends have also been observed in other studies with lipid and albumin UCA(Guzman et al. 2001; Karshafian et al. 2009), as increasing sonoporation also results in a greater proportion of cells that are unable to repair their damaged cell membranes, resulting in a drop in viability.
Duty cycle
The effects of pulse length and pulse repetition frequency were also examined with a constant center frequency of 1 MHz, pressure amplitude of 500 kPa, microbubble concentration of 0.25 mg/ml and exposure time of 15 seconds. Increasing the PRF while maintaining a constant PL of 20 μs resulted in a significant increase in transfection efficiency and total fluorescence intensity for samples insonated with a PRF of 9 kHz (DC=0.18, ISPTA = 1.5 W/cm2) compared to 1 kHz (DC=0.02, ISPTA = 0.167 W/cm2) with a transfection efficiency of 21.5 ± 1.0% compared to 6.8 ± 3.7 % (p<0.05) as shown in figure 2a and a fluorescence intensity of 5.8 × 10⁶ ± 0.3 × 10⁶ RFU compared to 2.3 × 10⁶ ± 1.1 ×10⁶ RFU as shown in figure 2b. The cell viability also dropped from 80.7 ± 6.8 % to 59.6 ± 2.2 % with the same change in PRF as shown in figure 2c. A similar trend was observed as the PL was increased while maintaining a constant PRF of 3 kHz. Increasing the pulse length from 7 μs (DC=0.02, ISPTA = 0.167 W/cm2) to 20 μs (DC=0.06, ISPTA = 0.5 W/cm2) and from 20 μs to 60 μs (DC=0.18, ISPTA = 1.5 W/cm2) both resulted in a significant increase in transfection efficiency (3.6 ± 0.4%, 14.1 ± 1.4 % and 24.8 ± 0.9% for 7, 20 and 60 μs) and total fluorescence intensity (1.4 × 10⁶ ± 0.1 × 10⁶ RFU, 3.6 × 10⁶ ± 0.4 × 10⁶ RFU and 6.2 × 10⁶ ± 0.3 × 10⁶ RFU, for 7, 20 and 60 μs, p<0.05) and a drop in cell viability (84.5 ± 2.8 %, 68.7 ± 4.8 % and 59.9 ± 2.8 % 7, 20 and 60 μs) as shown in figure 2d, 2e and 2f.. However there was no significant difference in transfection efficiency or total fluorescence intensity when comparing samples insonated with the same DC and ISPTA within this small range. Insonating with a PRF of 9 kHz and PL of 20 μs was not significantly different from insonating with a PRF of 3 kHz and a PL of 60 μs (p>0.05). Other studies have also seen increased sonoporation with increasing duty cycles in vitro with lipid and albumin UCA triggered with duty cycles up to 0.15 (Pan et al. 2005; Karshafian et al. 2009). However, some studies with lipid UCA only observed a dependence on PRF and not pulse lengths in a range from 10 – 40 μs (Rahim et al. 2006) and other studies with lipid or Optison UCA observed no significant dependence on pulse lengths from 20 μs to 60 ms (Guzman et al. 2001; Chen et al. 2003a; Miao et al. 2005). One possible explanation for this may be that at higher pressures these soft shelled UCA are not stable and are destroyed within 100 μs (Mannaris and Averkiou 2012). However, other studies using albumin UCA observed an increase in hemolysis with increasing pulse lengths up to 200 μs and increasing PRFs up to 200 Hz. In both cases the higher DC was shown to generate a greater inertial cavitation dose as well as a cascade effect where a higher percentage of bubbles survived the time between pulses (Chen et al. 2003b).
Figure 2.

The effect of pulse repetition frequency on (a) transfection efficiency, (b) total fluorescence intensity and (c) viability of cells insonated with a constant pulse length of 20 μs and the effect of pulse length on (d) transfection efficiency, (e) total fluorescence intensity and (f) viability of cells insonated with a constant pulse repetition frequency of 3000 Hz. All cells were insonated for 15 seconds at 1 MHz with a pressure amplitude of 500 kPa and a PLA microbubble concentration of 0.25 mg/ml (*p<0.05, n=4).
Pulse repetition frequency and pulse length
Pulse lengths and pulse repetition frequencies were also varied simultaneously to maintain a constant DC of 0.06, a constant ISPPA of 33.3 W/cm2 and a constant ISPTA of 2.0 W/cm2 in order to determine the importance of pulse length over a wider range from 3 μs to 12 ms. Increasing the PL from 20 μs to 12 ms while reducing the PRF from 3000 Hz to 5 Hz resulted in a significant (p<0.01) increase in transfection and total fluorescence intensity for all three center frequencies tested as shown in figure 3a and 3b, with transfection efficiencies increasing from 17.3 ± 1.2%, 11.8 ± 1.0% and 10.1 ± 0.6% to 24.2 ± 2.0%, 24.8 ± 1.1% and 16.6 ± 0.8% for 1, 2.25 and 5 MHz respectively. This increase in pulse length also caused a significant decrease (p<0.01) in cell viability as shown in figure 3c with cell viability dropping from 58.9 ± 1.9%, 79.7 ± 2.4 % and 90.9 ± 1.6% to 43.5 ± 2.9%, 48.3 ± 3.0% and 80.2 ± 2.5% as the PRF and PL changed from 3000 Hz and 20 μs to 5 Hz and 12 ms for center frequencies of 1, 2.25 and 5 MHz respectively. It is also important to note that this increase in transfection efficiency is completely dependent on the presence of the microbubbles. When cells were insonated without microbubbles for 15 seconds with a pressure of 1 MPa, a PRF of 5 Hz, PL of 12 ms (the acoustic parameters that provided the greatest transfection efficiency at each center frequency) the transfection efficiency that had been observed in the presence of UCA dropped to 0.01 ± 0.01%, 0.02 ± 0.01% and 0.04 ± 0.01% for center frequencies of 1, 2.25 and 5 MHz and the fluorescence intensity also dropped to 0.45 × 10⁶ ± 0.01 × 10⁶ RFU, 0.48 × 10⁶ ± 0.01 × 10⁶ RFU and 0.46 × 10⁶ ± 0.01 × 10⁶ RFU. While many studies focus on pressure amplitude, mechanical index, acoustic energy density, ISPPA or ISPTA (Pislaru et al. 2003; Larina et al. 2005; Forbes et al. 2008; Karshafian et al. 2009) as the key parameters effecting gene deliver efficiency, these results show that while these parameters were all held constant the transfection efficiency could change by over 100%. While increasing the DC by increasing the PRF or PL were both able to equally improve the transfection efficiency when compared over a small range (figure 2) as this range of pulse lengths was increased the importance of longer PL becomes more evident as shown in figure 3 and figure 4. The importance of PL may be a useful characteristic of these PLA UCA which may allow greater control over the degree of sonoporation in vivo by increasing PL to improve sonoporation, or reducing PL to reduce cell death in more sensitive organs.
Figure 3.

The effect of pulse repetition frequency and pulse length on (a) transfection efficiency, (b) total fluorescence intensity and (c) cell viability. Cells were insonated for 15 seconds with 0.25 mg/ml PLA UCA and 10 μg/ml plasmid DNA with a pressure amplitude of 1 MPa and a constant duty cycle of 0.06 (*p<0.05, n=5).
Pressure and pulse length
The effect of pressure and pulse length were also examined together while maintaining a constant ISPTA of 2.0 W/cm2 as shown in figure 5, or 0.33 W/cm2 and shown in figure 6. Doubling the pressure amplitude from 1MPa to 2 MPa while decreasing the PL and DC by 75% from 20 μs to 5 μs resulted in a significant drop in transfection and fluorescence intensity as shown in figure 5a and 5b (p<0.01) Transfection efficiency dropped from 17.3 ± 1.2%, 11.8 ± 1.0 and 10.1 ± 0.6% to 3.0 ± 0.3%, 2.7 ± 0.6% and 1.6 ± 0.2% for 1, 2.25 and 5 MHz respectively and the cell viability increased from 58.9 ± 1.9 %, 79.7 ± 2.4 % and 90.9 ± 1.6 % to 91.5 ± 1.8 %, 97.4 ± 1.2 % and 96.8 ± 1.7 % as shown in figure 5c. Decreasing the pressure amplitude by 50% from 1 MPa to 500 kPa and increasing the PL by 400% from 20 μs to 80 μs resulted in an increase in transfection efficiency to 20.7 ± 1.1%, 19.9 ± 0.4% and 16.5 ± 0.3% for 1, 2.25 and 5 MHz respectively and was statistically significant for 2.25 and 5 MHz (p<0.01). However, at a lower ISPTA of 0.33 W/cm2 and pressure amplitudes of 400 kPa and less, the opposite trend was observed. Increasing the PL from 62.5 ms to 1000 ms (continuous wave) while decreasing the pressure amplitude from 400 kPa to 100 kPa resulted in a significant drop in transfection efficiency (p<0.01) from 19.6 ± 1.3%, 18.5 ± 1.1% and 15.0 ± 0.4% to 4.3 ± 0.4%, 2.6 ± 0.5% and 0.4 ± 0.1% for 1, 2.25 and 5 MHz respectively (figure 6a) and a drop in fluorescence intensity from 4.5 × 10⁶ ± 0.7 × 10⁶ RFU, 3.8 × 10⁶ ± 0.2 × 10⁶ RFU and 3.8 × 10⁶ ± 0.3 × 10⁶ RFU to 1.7 × 10⁶ ± 0.2 × 10⁶ RFU, 1.4 × 10⁶ ± 0.2 × 10⁶ RFU and 0.6 × 10⁶ ± 0.01 × 10⁶ RFU (figure 6b). While the results from figures 3 and 5 support the hypothesis that PL is the most important parameter for triggering PLA UCA, figures 1 and 6 both show the importance of using a pressure amplitude of 200 kPa or greater to trigger these PLA UCA.
Figure 5.

Effect of PL and pressure amplitude on (a) transfection efficiency, (b) total fluorescence intensity and (c) viability of cells insonated with a constant PRF of 3000 Hz and a pressure and PL that were simultaneously changed to maintain a constant ISPTA of 2.0 W/cm2 (*p<0.05, n=5).
Figure 6.

Effect of PL and pressure amplitude on (a) transfection efficiency, (b) total fluorescence intensity and (c) viability of cells insonated for 15 seconds with a constant PRF of 1 Hz and a pressure and PL that were simultaneously changed to maintain a constant ISPTA of 0.33 W/cm2 (*p<0.05, n=5).
Microbubble concentration
The effect of microbubble concentration on transfection and cell viability were also examined with ultrasound at all three center frequencies (1, 2.25 and 5 MHz) and a constant pressure amplitude of 1 MPa, PL of 12 ms and PRF of 5 Hz and are shown in figure 7. Insonation with all three frequencies resulted in less than 0.04% transfection when no PLA microbubbles were added to the cells. Addition of microbubbles at a concentration of 0.025 mg/ml resulted in a significant increase in transfection at all three frequencies (20.8 ± 1.0%, 17.3 ± 1.7% and 4.3 ± 0.7% for 1, 1.25 and 5 MHz) with significantly greater transfection at 1 and 2.25 MHz compared to 5 MHz (p<0.05) as shown in figure 7a. Increasing the microbubble concentration ten-fold from 0.025 mg/ml to 0.25 mg/ml (24.2 ± 2.0%, 24.8 ± 1.1% and 16.6 ± 0.8%) resulted in no significant change in transfection of cells insonated at 1 MHz, however, there was a significant increase in transfection for cells insonated with 2.25 MHz and an even greater dose related increase in transfection for cells insonated with 5 MHz (p<0.05). As the concentration of UCA is increased to 1 mg/ml, the transfection efficiency continued to increase for cells insonated with 5 MHz (20.0 ± 0.4%, p<0.05), however there was a drop in transfection efficiency for cells insonated at 1MHz (16.1 ± 1.4%) and 2.25 MHz (21.5 ± 2.0%). A microbubble concentration of 1 mg/ml also caused a significant drop in the total fluorescence intensity with all three frequencies, from 7.5 × 10⁶ ± 1.3 × 10⁶ RFU, 8.2 × 10⁶ ± 0.5 × 10⁶ RFU and 5.2 × 10⁶ ± 0.2 × 10⁶ RFU at a concentration of 0.25 mg/ml to 2.6 × 10⁶ ± 0.2 × 10⁶ RFU, 3.6 × 10⁶ ± 0.3 × 10⁶ RFU and 3.6 × 10⁶ ± 0.2 × 10⁶ RFU at a concentration of 1 mg/ml for 1, 2.25 and 5 MHz respectively as shown in figure 7b, this drop in fluorescence may have been caused by the lower viability of cells treated with higher concentrations of microbubbles. The relationships between UCA concentration, center frequency and extent of transfection suggest that within the contrast agent, a smaller percentage of the population responds to higher frequencies (5 MHz compared to 1 MHz) requiring more agent to be added to the sample to produce the same level of transfection. In the case of 1 and 2.5 MHz insonation, it is probable that at higher concentrations the microbubbles begin to shadow each other leading to a drop in transfection which has also been observed in other systems (Passineau et al. 2010). These results do show that ultrasound triggered transfection is dependent on the presence of PLA microbubbles in this system, and that the transfection efficiency is affected by microbubble concentration. However, this system is static, with cells growing in a 200 μm thick chamber and may not accurately represent all physiological conditions, making it difficult to determine what concentrations would be required for in vivo applications.
Figure 7.

The effect of PLA microbubble concentration on (a) transfection efficiency, (b) total fluorescence intensity and (c) viability of cells insonated for 15 seconds with a constant pressure amplitude of 1 MPa, PL of 12 ms and PRF of 5 Hz (*p<0.05, n=5).
Exposure time
The effect of insonation time was also examined and is shown if figure 8. Cells were insonated with 0.05 mg/ml UCA and a center frequency of 1 MHz, pressure amplitude of 1 MPa, PL of 12 ms and PRF of 5 Hz. With only 2 seconds of ultrasound exposure there was a significant increase in transfection efficiency and total fluorescence intensity along with a significant drop in cell viability (p<0.001). Increasing the insonation time from 2 to 30 seconds resulted in no significant change in either transfection efficiency (20.9 ± 0.8% vs 22.3 ± 0.7%, p>0.05) (figure 8a) or fluorescence intensity (10.5 × 10⁶ ± 0.8 × 10⁶ RFU vs 10.3 × 10⁶ ± 0.5 × 10⁶ RFU, p>0.05) (figure 8b) but did result in a small but statistically significant drop in cell viability (p<0.05) from 75.2 ± 2.5% to 68.0 ± 2.0% (figure 8c). The limited effect of increasing exposure time beyond two seconds suggests that the majority of the UCA within the ultrasound beam are destroyed within the first two seconds. This rapid sonoporation may be useful for in vivo applications where the microbubbles quickly pass through the ultrasound beam.
Figure 8.

The effect of insonation time on the (a) transfection efficiency, (b) total fluorescence intensity and (c) cell viability of cells insonated with 0.05 mg/ml UCA and a center frequency of 1 MHz, pressure amplitude of 1 MPa, PL of 12 ms and PRF of 5 Hz (*p<0.05, n=6).
Radiation force
The design of many in vitro sonoporation experiments utilizes a rotating tube system where UCA and cells are both in suspension as they are exposed to ultrasound. One disadvantage of the rotating tube system is that most target cells in vivo are not in suspension. Growing cells in an Opticell cassette allows the possibility of insonating cells from the apical or basolateral side, either using radiation forces to push the UCA towards the cells or away from the cells. By reversing the direction of ultrasound exposure to push the microbubbles away from the cells, the transfection efficiency dropped from 21.1 ± 1.9% to 0.6 ± 0.6% (figure 9a) and the fluorescence intensity dropped from 9.3 × 10⁶ ± 0.3 × 10⁶ RFU to 0.6 × 10⁶ ± 0.07 × 10⁶ RFU (figure 9b) and was not significantly different from cells that were not exposed to ultrasound. Other in vitro experiments by Rahim et al. showed that lipid UCA insonated in an orientation to push the UCA away from the cells resulted in a significantly greater transfection rate of approximately 3% compared to uninsonated cells (approximately 0%) (Rahim et al. 2006). While it is not unexpected that radiation forces will increase the distance between cells and UCA resulting in reduced sonoporation, the absence of any transfection with PLA UCA may suggest these UCA require more time to generate enough force to transfect cells. This agrees with previous experiments in this study that have shown a strong dependence on longer pulse lengths with these UCA. It is possible that within the time required for these UCA to have an effect, the radiation forces push the UCA too far away. This may be relevant in large vessels or chambers larger than 200 μm in diameter such as salivary glands or large arteries. In situations such as these it may be useful to rotate the orientation of ultrasound exposure to expose all surfaces of the target.
Figure 9.

The effect of radiation forces on (a) transfection efficiency, (b) total fluorescence intensity and (c) cell viability of cells insonated for 15 seconds with a center frequency of 1 MHz, a pressure amplitude of 1 MPa, PL of 12 ms, PRF of 5 Hz and UCA concentration of 0.05 mg/ml. The direction of ultrasound exposure was changed from pushing UCA towards cells to away from cells (*p<0.05, n=6).
Effect of calcium concentration
In preliminary studies, we found greater transfection efficiency when cells were exposed to ultrasound (1 MHz, 1 MPa, PRF=5Hz, PL=12 ms) in RPMI 1640 compared to DMEM (unpublished results). One of the many differences in the formulations of these two media is the calcium ion concentration (0.42 vs 1.8 mM for RPMI 1640 and DMEM respectively. With the addition of 10% FBS containing approximately 2 mM Ca2+ the final calcium ion concentrations are approximately 0.58 and 1.82 mM). This difference in calcium ion concentration is of interest due to the possible role of calcium in sonoporation (Kumon et al. 2007; Zhou et al. 2008; Fan et al. 2010). In vitro studies in the absence of UCA have shown that sonoporation is reduced in the absence of calcium (Schlicher et al. 2006) which is necessary for the cell’s natural wound healing mechanisms (Steinhardt et al. 1994). To investigate the role of Ca2+ in our system, cells were insonated with 0.05 mg/ml UCA for 15 seconds at a center frequency of 1 MHz, pressure amplitude of 1 MPa, PL of 12 ms and PRF of 5 Hz. Culture media was replaced by PBS containing 137 mM NaCl, 8.1 mM Na2HPO4, 1.47 mM KCl, 2.68 mM KH2PO4, 0.49 mM MgCl2 and CaCl2 at concentrations of 0, 0.25, 0.5, 1.0, 1.5 or 2.0 mM. Increasing the calcium ion concentration from 0 mM to 0.25 mM resulted in a significant (p<0.001) increase in transfection efficiency (7.3 ± 0.8% vs. 22.7 ± 0.5%) (figure 10a), fluorescence intensity (1.4 × 10⁶ ± 0.1 × 10⁶ RFU vs. 7.7 × 10⁶ ± 0.5 × 10⁶ RFU) (figure 10b) as well as a significant increase in cell viability (36.0 ± 3.4% vs. 67.2 ± 1.7%) (figure 10c). However, upon increasing the calcium ion concentration further no additional increase in transfection was achieved and between 1 and 1.5 mM there was a significant (p<0.001) drop in transfection (21.0 ± 0.7% vs. 14.0 ± 0.4%) which dropped to 11.9 ± 0.6 % at 2 mM. Cell viability, on the other hand, remained constant at around 67%. Zhou et al. have shown that the time for complete membrane resealing of sonoporated Xenopus oocytes is dependent on Ca2+ concentration. Complete resealing took 58–170 seconds with 0.54 mM Ca2+ but only 6–26 seconds at 1.8 mM Ca2+(Zhou et al. 2008). The increase in transfection observed in figure 10 as the Ca2+ concentration decreased from 2.0 to 0.25 mM may have been caused by the cell membranes of damaged cells sealing less rapidly when exposed to lower calcium ion concentrations allowing more time for plasmid DNA to enter the cell. However, the drop in transfection efficiency and viability observed when the Ca2+ concentration was reduced to 0 mM confirms the observation that calcium is required for sonoporation that has been reported by others (Schlicher et al. 2006). The calcium ion concentration in the blood is usually greater than 2.1 mM and is not easily changed which may limit the transfection efficiency in some in vivo applications. In other applications such as transfection of the salivary gland, where the microbubble and plasmid suspension can be delivered into the lumen in a controlled buffer, it may be useful to optimize the calcium ion concentration.
Figure 10.

The effect of calcium ion concentration on (a) transfection efficiency, (b) total fluorescence intensity and (c) cell viability of cells insonated for 15 seconds with a center frequency of 1 MHz, a pressure amplitude of 1 MPa, PL of 12 ms, PRF of 5 Hz and UCA concentration of 0.05 mg/ml. Microbubbles and plasmid were suspended in PBS containing 0.49 mM magnesium chloride and 0–2 mM calcium chloride (*p<0.05, n=6).
Effect of magnesium concentration
In addition to requiring calcium, Steinhardt et al. have shown that resealing of disrupted cell membranes can be antagonized by magnesium ions (Steinhardt et al. 1994). This would suggest that higher concentrations of Mg2+ could slow the process of membrane resealing and allow more plasmid to enter the cell. However, as shown in figure 11, when Mg2+ was added together with 1 mM CaCl2 under the same insonation conditions as above, no significant difference in transfection was observed for any of the Mg2+ concentrations tested (19.9 ± 1.1%, 21.0 ± 0.7% and 21.2 ± 0.8% for Mg2+ concentrations of 0, 0.5 and 1 mM, p>0.05) (figure 11a). There was also no significant change in fluorescence intensity (6.7 × 10⁶ ± 0.3 × 10⁶ RFU, 7.0 × 10⁶ ± 0.4 × 10⁶ RFU and 9.0 × 10⁶ ± 0.5 × 10⁶ RFU) (figure 11b) or cell viability (71.4 ± 1.4 %, 66.5 ± 2.3 % and 65.6 ± 2.7 % for 0, 0.5 and 1 mM, p>0.05) (figure 11c).
Figure 11.

The effect of magnesium ion concentration on (a) transfection efficiency, (b) total fluorescence intensity and (c) cell viability of cells insonated for 15 seconds with a center frequency of 1 MHz, a pressure amplitude of 1 MPa, PL of 12 ms, PRF of 5 Hz and UCA concentration of 0.05 mg/ml. Microbubbles and plasmid were suspended in PBS containing 1.0 mM calcium chloride and 0–1 mM magnesium chloride (n=6).
Multiple exposures
As shown in figure 8, after 2 seconds of exposure no additional transfection was achieved. This could be due to a lack of sufficient intact microbubbles after ultrasound exposure preventing addition sonoporation, or due to heterogeneity in the cell population making some cells less susceptible to transfection than others. Cells grown in tissue culture are particularly vulnerable to stressful conditions, and efforts to perform repeated transfection within a short time frame (minutes) resulted in unacceptable loss of cells due to detachment from the substrate (unpublished results). To test if insonating the same cells a second time with fresh UCA and plasmid after a period of recovery would result in greater transfection efficiency, and if that recovery period was significant, cells were insonated either a single time (1x) or twice, with the second insonation either 4 hours after the first insonation (0 h 4 h) or 12 hours after the first insonation (0 h 12 h). Insonating cells with two separate exposures 4 hours apart resulted in a significantly higher transfection rate compared to a single exposure (21.24 ± 0.8% vs. 28.3 ± 1.0%, p<0.001)(figure 12a) as well as a higher fluorescence intensity (9.3 × 10⁶ ± 0.3 × 10⁶ RFU vs. 13.0 × 10⁶ ± 0.8 × 10⁶ RFU) (figure 12b). However, when the second ultrasound exposure was performed 12 hours after the initial treatment there was a significantly greater transfection efficiency compared to treating after 4 hours (37.01 ± 0.9% vs. 28.3 ±1.0%, p<0.001) as well as a significant increase in fluorescence intensity (15.8 × 10⁶ ± 0.9 × 10⁶ RFU vs. 13.0 × 10⁶ ± 0.8 × 10⁶ RFU). A second ultrasound treatment also resulted in a significant drop in viability from 68.0 ± 0.8% to 51.2 ±1.6% or 51.3 ± 1.0% (figure 12c) when the second treatment was 4 or 12 hours after the first, however there was no significant difference in viability when comparing cells that were transfected after 4 hours compared to 12 hours. The differences in transfection efficiency achieved with different timings of the second exposure observed in figure 12 may be partly a result of the cells being in different stages of the growth cycle. Karshafian et al. have shown that sonoporation of KHT-C cells in suspension was dependent on cell cycle with more cells being permeabilized in S and G2 phase compared to G1 (Karshafian et al. 2007). The cell cycle may have an effect on the mechanical properties of cell membranes (Zhang et al. 2002; Karshafian et al. 2007) making the membrane more susceptible to sonoporation during S phase. Other non viral gene delivery methods have also shown a dependence on cell cycle with more cells being transfected in late S or G2 phase, possibly due to the breakdown of the nuclear membrane during cell division (Brunner et al. 2002). This may be useful for transfecting some in vivo targets. The cell cycle of the cells in many healthy tissues such as the salivary gland are controlled by a circadian rhythm with the peak of DNA synthesis occurring during the peak of activity (Klein 1982) suggesting there may be an optimal time of day to transfect these cells. Alternatively, the cell cycles of most cancer cells are asynchronous; it may be more effective to transfect cancerous cells multiple times over a period to ensure more cells are treated while they are in S phase or G2 phase.
Figure 12.
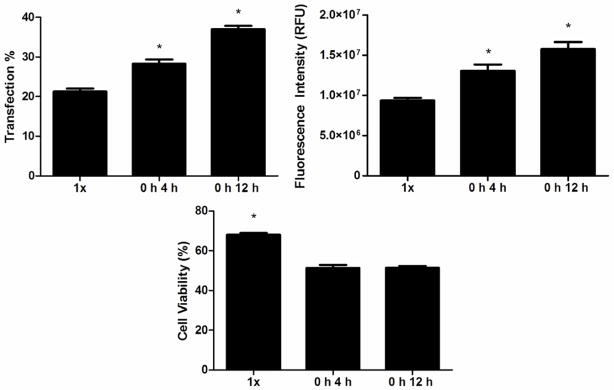
The effect of multiple exposures on (a) transfection efficiency, (b) total fluorescence intensity and (c) cell viability of cells insonated for 15 seconds with 0.05 mg/ml UCA at a center frequency of 1 MHz, a pressure amplitude of 1 MPa, PL of 12 ms and PRF of 5 Hz. Cells were treated either once (1x) or twice, with the second exposure 4 hours after the first (0 h 4 h) or 12 hours after the first (0 h 12 h) (*p<0.05, n=5).
Comparison with Optison
The relative potency of the PLA UCA used in these experiments was compared with a commercially available “hard shell” contrast agent made with an albumin shell, Optison. An equivalent microbubble concentration of 1.5 × 10⁶ microbubbles/ml was used for both contrast agents and both were insonated with the same ultrasound conditions that provided the maximum transfection efficiency with PLA UCA. No significant difference in transfection efficiency or total fluorescence intensity was observed for cells treated with Optison compared to PLA UCA (p>0.05). Cells insonated with Optison had a transfection efficiency of 19.0 ± 1.2% compared to 21.2 ± 0.8 % for PLA UCA and a fluorescence intensity of 8.1 × 10⁶ ± 0.7 × 10⁶ RFU compared to 9.3 × 10⁶ ± 0.3 × 10⁶ RFU for cells insonated with RFU. However, the viability of cells insonated with Optison was significantly greater than cells insonated with PLA UCA (73.0 ± 1.3% vs. 68.1 ± 0.8%, p< 0.05). This suggests that both agents have a similar ability to transfect cells when insonated under these conditions. It is also possible that both agents share similar mechanisms of sonoporation. Others have shown that sonic cracking, where the shell of the bubble ruptures and allows the gas to escape, occurs up to 35% of the time with Optison (Prentice et al. 2005), this combined with microjetting and the microstreaming of the oscillating bubble may be responsible for the observed sonoporation.
Conclusions
Gene delivery to MCF 7 breast cancer cells was achieved by insonating a monolayer of cells incubated with a suspension of PLA UCA and free plasmid DNA with a range of ultrasound exposures. A threshold pressure amplitude of 250 kPa or greater was required for gene delivery with PLA UCA and a strong dependence on frequency and pulse length was also observed, with more efficient transfection at lower frequencies (1 MHz) and longer pulse lengths (12 ms). The exposure times tested also had no effect on transfection indicating sonoporation occurs in two seconds or less. In vitro ultrasound triggered gene delivery with PLA UCA did show a strong dependence on extracellular calcium ion concentration and a possible relationship between transfection and cell cycle. The conditions tested in these experiments were limited by the equipment used and it is possible that insonating with frequencies lower than 1 MHz or longer pulse lengths may be more efficient. While these experiments have shown that PLA UCA and ultrasound can be used to transfect cells with naked plasmid DNA in vitro, further work is necessary to evaluate the ability of these results to translate in vivo. In the future, it may be possible to take advantage of the enhanced drug loading properties of these polymer UCA (Eisenbrey et al. 2010; Cochran et al. 2011) in order to simultaneously deliver chemotherapeutics along with tumor suppressor genes to achieve a synergistic antitumor effect (Nielsen et al. 1998).
Acknowledgments
The authors would like to thank Dr. Aleister Saunders for providing the plasmid encoding EGFP and Dr. John Eisenbrey for assistance with calibrating the transducers used in these experiments. This work was funded by the SIR Foundation Allied Scientist Training Grant (MC) and the PA Dept. of Health CURE award.
Footnotes
Publisher's Disclaimer: This is a PDF file of an unedited manuscript that has been accepted for publication. As a service to our customers we are providing this early version of the manuscript. The manuscript will undergo copyediting, typesetting, and review of the resulting proof before it is published in its final citable form. Please note that during the production process errors may be discovered which could affect the content, and all legal disclaimers that apply to the journal pertain.
References
- Apfel RE, Holland CK. Gauging the likelihood of cavitation from short-pulse, low-duty cycle diagnostic ultrasound. Ultrasound Med Biol. 1991;17:179–85. doi: 10.1016/0301-5629(91)90125-g. [DOI] [PubMed] [Google Scholar]
- Azmin M, Harfield C, Ahmad Z, Edirisinghe M, Stride E. How Do Microbubbles and Ultrasound Interact? Basic Physical, Dynamic and Engineering Principles. Curr Pharm Des. 2012;18:2118–34. doi: 10.2174/138161212800099955. [DOI] [PubMed] [Google Scholar]
- Balazs DA, Godbey W. Liposomes for Use in Gene Delivery. Journal of Drug Delivery. 2011 doi: 10.1155/2011/326497. [DOI] [PMC free article] [PubMed] [Google Scholar]
- Bao S, Thrall BD, Miller DL. Transfection of a reporter plasmid into cultured cells by sonoporation in vitro. Ultrasound Med Biol. 1997;23:953–9. doi: 10.1016/s0301-5629(97)00025-2. [DOI] [PubMed] [Google Scholar]
- Bohmer MR, Chlon CHT, Raju BI, Chin CT, Shevchenko T, Klibanov AL. Focused ultrasound and microbubbles for enhanced extravasation. J Control Release. 2010;148:18–24. doi: 10.1016/j.jconrel.2010.06.012. [DOI] [PMC free article] [PubMed] [Google Scholar]
- Brunner S, Furtbauer E, Sauer T, Kursa M, Wagner E. Overcoming the nuclear barrier: cell cycle independent nonviral gene transfer with linear polyethylenimine or electroporation. Mol Ther. 2002;5:80–6. doi: 10.1006/mthe.2001.0509. [DOI] [PubMed] [Google Scholar]
- Carson AR, McTiernan CF, Lavery L, Hodnick A, Grata M, Leng X, Wang J, Chen X, Modzelewski RA, Villanueva FS. Gene therapy of carcinoma using ultrasound-targeted microbubble destruction. Ultrasound Med Biol. 2011;37:393–402. doi: 10.1016/j.ultrasmedbio.2010.11.011. [DOI] [PMC free article] [PubMed] [Google Scholar]
- Chen S, Ding J-h, Bekeredjian R, Yang B-z, Shohet RV, Johnston SA, Hohmeier HE, Newgard CB, Grayburn PA. Efficient gene delivery to pancreatic islets with ultrasonic microbubble destruction technology. Proc Natl Acad Sci U S A. 2006;103:8469–74. doi: 10.1073/pnas.0602921103. [DOI] [PMC free article] [PubMed] [Google Scholar]
- Chen S, Shohet RV, Bekeredjian R, Frenkel P, Grayburn PA. Optimization of ultrasound parameters for cardiac gene delivery of adenoviral or plasmid deoxyribonucleic acid by ultrasound-targeted microbubble destruction. J Am Coll Cardiol. 2003a;42:301–8. doi: 10.1016/s0735-1097(03)00627-2. [DOI] [PubMed] [Google Scholar]
- Chen W-S, Brayman AA, Matula TJ, Crum LA, Miller MW. The pulse length-dependence of inertial cavitation dose and hemolysis. Ultrasound Med Biol. 2003b;29:739–48. doi: 10.1016/s0301-5629(03)00029-2. [DOI] [PubMed] [Google Scholar]
- Chomas JE, Dayton PA, May D, Allen JG, Klibanov AL, Ferrara K. Optical observation of contrast agent destruction. Appl Phys Lett. 2000;77:1056–8. [Google Scholar]
- Cochran MC, Eisenbrey J, Ouma RO, Soulen M, Wheatley MA. Doxorubicin and paclitaxel loaded microbubbles for ultrasound triggered drug delivery. Int J Pharm. 2011;414:161–70. doi: 10.1016/j.ijpharm.2011.05.030. [DOI] [PMC free article] [PubMed] [Google Scholar]
- Coonrod A, Li FQ, Horwitz M. On the mechanism of DNA transfection: efficient gene transfer without viruses. Gene Ther. 1997;4:1313–21. doi: 10.1038/sj.gt.3300536. [DOI] [PubMed] [Google Scholar]
- Doinikov AA, Bouakaz A. Theoretical investigation of shear stress generated by a 1 contrast microbubble on the cell membrane as a mechanism for sonoporation. J Acoust Soc Am. 2010;128:11–9. doi: 10.1121/1.3419775. [DOI] [PubMed] [Google Scholar]
- Donahue RE, Kessler SW, Bodine D, McDonagh K, Dunbar C, Goodman S, Agricola B, Byrne E, Raffeld M, Moen R, et al. Helper virus induced T cell lymphoma in nonhuman primates after retroviral mediated gene transfer. J Exp Med. 1992;176:1125–35. doi: 10.1084/jem.176.4.1125. [DOI] [PMC free article] [PubMed] [Google Scholar]
- Edelstein ML, Abedi MR, Wixon J. Gene therapy clinical trials worldwide to 2007--an update. J Gene Med. 2007;9:833–42. doi: 10.1002/jgm.1100. [DOI] [PubMed] [Google Scholar]
- Eisenbrey JR, Burstein OM, Kambhampati R, Forsberg F, Liu JB, Wheatley MA. Development and 9 optimization of a doxorubicin loaded poly(lactic acid) contrast agent for ultrasound directed drug delivery. J Control Release. 2010;143:38–44. doi: 10.1016/j.jconrel.2009.12.021. [DOI] [PMC free article] [PubMed] [Google Scholar]
- El-Sherif DM, Wheatley MA. Development of a novel method for synthesis of a polymeric ultrasound contrast agent. J Biomed Mater Res A. 2003;66:347–55. doi: 10.1002/jbm.a.10586. [DOI] [PubMed] [Google Scholar]
- Fan Z, Kumon RE, Park J, Deng CX. Intracellular delivery and calcium transients generated in sonoporation facilitated by microbubbles. J Control Release. 2010;142:31–9. doi: 10.1016/j.jconrel.2009.09.031. [DOI] [PMC free article] [PubMed] [Google Scholar]
- Forbes MM, Steinberg RL, O’Brien WD., Jr Examination of inertial cavitation of Optison in producing sonoporation of chinese hamster ovary cells. Ultrasound Med Biol. 2008;34:2009–18. doi: 10.1016/j.ultrasmedbio.2008.05.003. [DOI] [PMC free article] [PubMed] [Google Scholar]
- Fujii H, Sun Z, Li S-H, Wu J, Fazel S, Weisel RD, Rakowski H, Lindner J, Li R-K. Ultrasound-targeted gene 18 delivery induces angiogenesis after a myocardial infarction in mice. JACC Cardiovascular imaging. 2009;2:869–79. doi: 10.1016/j.jcmg.2009.04.008. [DOI] [PubMed] [Google Scholar]
- Gao X, Kim K-S, Liu D. Nonviral gene delivery: What we know and what is next. The AAPS Journal. 2007;9:E92–E104. doi: 10.1208/aapsj0901009. [DOI] [PMC free article] [PubMed] [Google Scholar]
- Geers B, Lentacker I, Alonso A, Sanders NN, Demeester J, Meairs S, De Smedt SC. Elucidating the mechanisms behind sonoporation with adeno-associated virus-loaded microbubbles. Mol Pharm. 2011;8:2244–51. doi: 10.1021/mp200112y. [DOI] [PubMed] [Google Scholar]
- Geis NA, Katus HA, Bekeredjian R. Microbubbles as a vehicle for gene and drug delivery: current clinical implications and future perspectives. Curr Pharm Des. 2012;18:2166–83. doi: 10.2174/138161212800099946. [DOI] [PubMed] [Google Scholar]
- Greenleaf WJ, Bolander ME, Sarkar G, Goldring MB, Greenleaf JF. Artificial Cavitation Nuclei Significantly Enhance Acoustically Induced Cell Transfection. Ultrasound Med Biol. 1998;24:587–95. doi: 10.1016/s0301-5629(98)00003-9. [DOI] [PubMed] [Google Scholar]
- Guo D-P, Li X-Y, Sun P, Tang Y-B, Chen X-Y, Chen Q, Fan L-M, Zang B, Shao L-Z, Li X-R. Ultrasound targeted microbubble destruction improves the low density lipoprotein receptor gene expression in HepG2 cells. Biochem Biophys Res Commun. 2006;343:470–4. doi: 10.1016/j.bbrc.2006.02.179. [DOI] [PubMed] [Google Scholar]
- Guzman HR, Nguyen DX, Khan S, Prausnitz MR. Ultrasound-mediated disruption of cell membranes. I. Quantification of molecular uptake and cell viability. J Acoust Soc Am. 2001;110:588–96. doi: 10.1121/1.1376131. [DOI] [PubMed] [Google Scholar]
- Juffermans LJM, Kamp O, Dijkmans PA, Visser CA, Musters RJP. Low-intensity 1 ultrasound-exposed microbubbles provoke local hyperpolarization of the cell membrane via activation of BK(Ca) channels. Ultrasound Med Biol. 2008;34:502–8. doi: 10.1016/j.ultrasmedbio.2007.09.010. [DOI] [PubMed] [Google Scholar]
- Karshafian R, Bevan PD, Williams R, Samac S, Burns PN. Sonoporation by ultrasound-activated microbubble contrast agents: effect of acoustic exposure parameters on cell membrane permeability and cell viability. Ultrasound Med Biol. 2009;35:847–60. doi: 10.1016/j.ultrasmedbio.2008.10.013. [DOI] [PubMed] [Google Scholar]
- Kawabata K, Takakura Y, Hashida M. The fate of plasmid DNA after intravenous injection in mice: involvement of scavenger receptors in its hepatic uptake. Pharm Res. 1995;12:825–30. doi: 10.1023/a:1016248701505. [DOI] [PubMed] [Google Scholar]
- Klein RM. Acinar cell proliferation in the parotid and submandibular salivary glands of the neonatal rat. Cell Tissue Kinet. 1982;15:187–95. doi: 10.1111/j.1365-2184.1982.tb01037.x. [DOI] [PubMed] [Google Scholar]
- Kumon RE, Aehle M, Sabens D, Parikh P, Kourennyi D, Deng CX. Ultrasound-induced calcium oscillations and waves in Chinese hamster ovary cells in the presence of microbubbles. Biophys J. 2007;93:L29–31. doi: 10.1529/biophysj.107.113365. [DOI] [PMC free article] [PubMed] [Google Scholar]
- Larina IV, Evers BM, Esenaliev RO. Optimal drug and gene delivery in cancer cells by ultrasound-induced cavitation. Anticancer Res. 2005;25:149–56. [PubMed] [Google Scholar]
- Lawrie A, Brisken AF, Francis SE, Cumberland DC, Crossman DC, Newman CM. Microbubble-enhanced ultrasound for vascular gene delivery. Gene Ther. 2000;7:2023–7. doi: 10.1038/sj.gt.3301339. [DOI] [PubMed] [Google Scholar]
- Lechardeur D, Sohn KJ, Haardt M, Joshi PB, Monck M, Graham RW, Beatty B, Squire J, O’Brodovich H, Lukacs GL. Metabolic instability of plasmid DNA in the cytosol: a potential barrier to gene transfer. Gene Ther. 1999;6:482–97. doi: 10.1038/sj.gt.3300867. [DOI] [PubMed] [Google Scholar]
- Lentacker I, Wang N, Vandenbroucke RE, Demeester J, De Smedt SC, Sanders NN. Ultrasound exposure of lipoplex loaded microbubbles facilitates direct cytoplasmic entry of the lipoplexes. Mol Pharm. 2009;6:457–67. doi: 10.1021/mp800154s. [DOI] [PubMed] [Google Scholar]
- Liu Q, Muruve DA. Molecular basis of the inflammatory response to adenovirus vectors. Gene Ther. 2003;10:935–40. doi: 10.1038/sj.gt.3302036. [DOI] [PubMed] [Google Scholar]
- Mannaris C, Averkiou MA. Investigation of Microbubble Response to Long Pulses Used in Ultrasound- Enhanced Drug Delivery. Ultrasound Med Biol. 2012;38:681–91. doi: 10.1016/j.ultrasmedbio.2011.12.018. [DOI] [PubMed] [Google Scholar]
- Mehier-Humbert S, Guy RH. Physical methods for gene transfer: improving the kinetics of gene delivery into cells. Advanced Drug Delivery Reviews. 2005a;57:733–53. doi: 10.1016/j.addr.2004.12.007. [DOI] [PubMed] [Google Scholar]
- Mehier-Humbert S, Guy RH. Physical methods for gene transfer: improving the kinetics of gene delivery into cells. Adv Drug Deliv Rev. 2005b;57:733–53. doi: 10.1016/j.addr.2004.12.007. [DOI] [PubMed] [Google Scholar]
- Mehier-Humbert S, Yan F, Frinking P, Schneider M, Guy RH, Bettinger T. Ultrasound-mediated gene delivery: influence of contrast agent on transfection. Bioconjug Chem. 2007;18:652–62. doi: 10.1021/bc0602432. [DOI] [PubMed] [Google Scholar]
- Meijering BDM, Henning RH, Van Gilst WH, Gavrilović I, Van Wamel A, Deelman LE. Optimization of ultrasound and microbubbles targeted gene delivery to cultured primary endothelial cells. J Drug Target. 2007;15:664–71. doi: 10.1080/10611860701605088. [DOI] [PubMed] [Google Scholar]
- Meijering BDM, Juffermans LJM, van Wamel A, Henning RH, Zuhorn IS, Emmer1 M, Versteilen AMG, Paulus WJ, van Gilst WH, Kooiman K, de Jong N, Musters RJP, Deelman LE, Kamp O. Ultrasound and microbubble-targeted delivery of macromolecules is regulated by induction of endocytosis and pore formation. Circ Res. 2009;104:679–87. doi: 10.1161/CIRCRESAHA.108.183806. [DOI] [PubMed] [Google Scholar]
- Miao CH, Brayman AA, Loeb KR, Ye P, Zhou L, Mourad P, Crum LA. Ultrasound enhances gene delivery of human factor IX plasmid. Hum Gene Ther. 2005;16:893–905. doi: 10.1089/hum.2005.16.893. [DOI] [PubMed] [Google Scholar]
- Miller DL, Bao S, Morris JE. Sonoporation of cultured cells in the rotating tube exposure system. Ultrasound Med Biol. 1999;25:143–9. doi: 10.1016/s0301-5629(98)00137-9. [DOI] [PubMed] [Google Scholar]
- Newman CMH, Bettinger T. Gene therapy progress and prospects: ultrasound for gene transfer. Gene 10 Ther. 2007;14:465–75. doi: 10.1038/sj.gt.3302925. [DOI] [PubMed] [Google Scholar]
- Nielsen LL, Lipari P, Dell J, Gurnani M, Hajian G. Adenovirus-mediated p53 gene therapy and paclitaxel have synergistic efficacy in models of human head and neck, ovarian, prostate, and breast cancer. Clin Cancer Res. 1998;4:835–46. [PubMed] [Google Scholar]
- Ohl CD, Arora M, Ikink R, de Jong N, Versluis M, Delius M, Lohse D. Sonoporation from jetting cavitation bubbles. Biophys J. 2006;91:4285–95. doi: 10.1529/biophysj.105.075366. [DOI] [PMC free article] [PubMed] [Google Scholar]
- Ohl CD, Wolfrum B. Detachment and sonoporation of adherent HeLa-cells by shock wave-induced cavitation. Biochim Biophys Acta. 2003;1624:131–8. doi: 10.1016/j.bbagen.2003.10.005. [DOI] [PubMed] [Google Scholar]
- Pan H, Zhou Y, Izadnegahdar O, Cui J, Deng CX. Study of sonoporation dynamics affected by ultrasound duty cycle. Ultrasound Med Biol. 2005;31:849–56. doi: 10.1016/j.ultrasmedbio.2005.03.014. [DOI] [PubMed] [Google Scholar]
- Passineau MJ, Zourelias L, Machen L, Edwards PC, Benza RL. Ultrasound-assisted non-viral gene transfer to the salivary glands. Gene Ther. 2010 doi: 10.1038/gt.2010.86. [DOI] [PubMed] [Google Scholar]
- Phillips LC, Klibanov AL, Wamhoff BR, Hossack JA. Targeted gene transfection from microbubbles into vascular smooth muscle cells using focused, ultrasound-mediated delivery. Ultrasound Med Biol. 2010;36:1470–80. doi: 10.1016/j.ultrasmedbio.2010.06.010. [DOI] [PMC free article] [PubMed] [Google Scholar]
- Pislaru SV, Pislaru C, Kinnick RR, Singh R, Gulati R, Greenleaf JF, Simari RD. Optimization of ultrasound mediated gene transfer: comparison of contrast agents and ultrasound modalities. Eur Heart J. 2003;24:1690–8. doi: 10.1016/s0195-668x(03)00469-x. [DOI] [PubMed] [Google Scholar]
- Postema M, van Wamel A, Lancee CT, de Jong N. Ultrasound-induced encapsulated microbubble phenomena. Ultrasound Med Biol. 2004;30:827–40. doi: 10.1016/j.ultrasmedbio.2004.02.010. [DOI] [PubMed] [Google Scholar]
- Prentice P, Cuschieri A, Dholakia K, Prausnitz M, Campbell P. Membrane disruption by optically controlled microbubble cavitation. Nat Phys. 2005;1:107–10. [Google Scholar]
- Rahim A, Taylor SL, Bush NL, ter Haar GR, Bamber JC, Porter CD. Physical parameters affecting ultrasound/microbubble-mediated gene delivery efficiency in vitro. Ultrasound Med Biol. 2006;32:1269– 79. doi: 10.1016/j.ultrasmedbio.2006.04.014. [DOI] [PubMed] [Google Scholar]
- Schlicher RK, Radhakrishna H, Tolentino TP, Apkarian RP, Zarnitsyn V, Prausnitz1 MR. Mechanism of intracellular delivery by acoustic cavitation. Ultrasound Med Biol. 2006;32:915–24. doi: 10.1016/j.ultrasmedbio.2006.02.1416. [DOI] [PubMed] [Google Scholar]
- Steinhardt RA, Bi G, Alderton JM. Cell membrane resealing by a vesicular mechanism similar to neurotransmitter release. Science. 1994;263:390–3. doi: 10.1126/science.7904084. [DOI] [PubMed] [Google Scholar]
- Tseng W-C, Haselton FR, Giorgio TD. Transfection by Cationic Liposomes Using Simultaneous Single Cell Measurements of Plasmid Delivery and Transgene Expression. J Biol Chem. 1997;272:25641–7. doi: 10.1074/jbc.272.41.25641. [DOI] [PubMed] [Google Scholar]
- van Wamel A, Kooiman K, Harteveld M, Emmer M, ten Cate FJ, Versluis M, de Jong N. Vibrating microbubbles poking individual cells: drug transfer into cells via sonoporation. J Control Release. 2006;112:149–55. doi: 10.1016/j.jconrel.2006.02.007. [DOI] [PubMed] [Google Scholar]
- Wang G-z, Liu J-h, Lu S-z, Lu Y, Guo C-j, Zhao D-h, Fang D-p, He D-f, Zhou Y, Ge C-j. Ultrasonic destruction of albumin microbubbles enhances gene transfection and expression in cardiac myocytes. Chin Med J (Engl) 2011;124:1395–400. [PubMed] [Google Scholar]
- Wheatley MA, Cochran MC, Eisenbrey JR, Oum KL. Cellular signal transduction can be induced by TRAIL conjugated to microcapsules. J Biomed Mater Res A. 2012 doi: 10.1002/jbm.a.34189. [DOI] [PubMed] [Google Scholar]
- Wu J. Theoretical study on shear stress generated by microstreaming surrounding contrast agents attached to living cells. Ultrasound Med Biol. 2002;28:125–9. doi: 10.1016/s0301-5629(01)00497-5. [DOI] [PubMed] [Google Scholar]
- Zabner J. Cationic lipids used in gene transfer. Adv Drug Delivery Rev. 1997;27:17–28. doi: 10.1016/s0169-409x(97)00019-7. [DOI] [PubMed] [Google Scholar]
- Zhang G, Gurtu V, Kain SR. An Enhanced Green Fluorescent Protein Allows Sensitive Detection of Gene Transfer in Mammalian Cells. Biochem Biophys Res Commun. 1996;227:707–11. doi: 10.1006/bbrc.1996.1573. [DOI] [PubMed] [Google Scholar]
- Zhang G, Long M, Wu ZZ, Yu WQ. Mechanical properties of hepatocellular carcinoma cells. World J Gastroenterol. 2002;8:243–6. doi: 10.3748/wjg.v8.i2.243. [DOI] [PMC free article] [PubMed] [Google Scholar]
- Zhou Y, Shi J, Cui J, Deng CX. Effects of extracellular calcium on cell membrane resealing in sonoporation. J Control Release. 2008;126:34–43. doi: 10.1016/j.jconrel.2007.11.007. [DOI] [PMC free article] [PubMed] [Google Scholar]