Abstract
The perfluorcarbon (perfluorobutane) ultrasound contrast agent ST68, composed of sonicated mixtures of non-ionic surfactants, is stable in solution for only a few weeks at 4°C. Freeze-drying critically diminished ST68’s ability to reflect ultrasound (its echogenicity). A method of incorporating specific lyoprotectants before lyophilization was investigated. Reintroduction of perfluorobutane to the protected freeze-dried sample, followed by reconstituting with preserved echogenicity. Glucose, trehalose, sucrose, and mannitol were tested at 100 mM and in vitro echogenicity data was collected from samples with dose concentrations of 50 µl/l to 300 µl/l. Glucose was found to be the best lyoprotectant providing an average (n=3) maximum peak enhancement of 23.2 ± 1.2 dB in vitro, measured at 5 MHz, 684 kPa, and a pulse repetition frequency (PRF) of 100 Hz (p<0.05 over freeze-dried ST68 control) and 20.8 ± 0.8 dB in vivo in New Zealand white rabbits at 5 MHz and a PRF of 6.7 kHz. Pulse inversion harmonic US images of a rabbit kidney, pre- and post-contrast injection (0.1 ml/kg), showed excellent enhancement and clear vascular delineation, similar to that of the original agent. For the first time this contrast agent can be successfully freeze-dried yielding a longer self-life without the need for refrigeration.
Keywords: Ultrasound Contrast Agent, Freeze-drying, Lyoprotectant, Surfactant, Sugar, Glassy Matrix
1. Introduction
Frequently, the contrast of ultrasound (US) imaging is low due to density and compressibility similarities between different tissues within the body (Sarvazyan and Hill 2004). In order to enhance contrast, an increase in reflected US is needed; reflections occur at the interface between materials with differing acoustical impedances. The concept of using gas-filled microbubbles as ultrasound contrast agents (UCA) was first introduced by Gramiak and Shaw in 1968, when they discovered that injecting agitated saline into the ascending aorta during echocardiographic readings produced strong echoes within the heart. It was not until the 1980’s that Feinstein et al. (1984) produced microbubbles, encapsulated in a human albumin shell, that were small and stable enough to transverse the pulmonary circulation and enable systemic vascular imaging. Starting in the early 90’s, commercially available UCA were introduced. A quest for increased in vivo stability has led to the substitution of air with less soluble, denser, gases such as perfluorocarbons (PFC) and sulfur hexafluoride to fill the microbubbles, producing a smaller and more stable bubble in vivo thereby enabling a wider range of applications (Miller and Nanda 2004). PFC’s have been extensively studied for their toxicity profile when injected intravenously. They have been found to have extremely low solubility (Weathersby and Homer 1980, Marshall and Longnecker 1996), to be unreactive and not metabolized in dogs (Killam et al 1999), and to be 100% exhaled within 6 minutes in humans (Hutter et al 1999). To be safely delivered intravenously, UCA should not be larger than 8 µm in order to pass through the lung capillaries and bolus injection volumes are typically between 0.5 to 8 ml, including any saline flush used to generate flow after contrast injection (Bouakaz and de Jong 2007, Lindner 2009).
Addition of gas filled UCA, being near perfect reflectors of acoustic waves (99.8%), changes the impedance mismatch from tissue/tissue to tissue/air and thereby enhances the signal to noise ratio of the resulting image (Anderson 2004). Increased image contrast improves endocardial border delineation when used in echocardiography, allowing better real-time detection of myocardial perfusion (Correas et al. 2001). These improvements also aid in the discovery of tumors and lesions in organs such as the liver and kidneys (Goldberg et al. 1994).
Our laboratory previously developed a series of surfactant-based UCA, composed of sonicated mixtures of non-ionic surfactants which self assemble around a gaseous core (Wheatley et al. 1994). One particular agent, ST68, consists of Span 60 and Tween 80 filled with octafluoropropane (a PFC gas) (Basude and Wheatley 2001). This agent can consistently be produced with a mean size of 1.5 to 2 µm and produces over 20 dB enhancement for doses less than 100 µl/l in vitro (Basude et al. 2000) and 0.05 ml/kg in vivo (Forsberg et al. 1996). However, further development of this agent is hampered by the fact that it consists of an aqueous suspension of bubbles, which have limited stability with time (less than a week at 4°C). An ideal UCA should be stable at room temperature for at least 6 months (Wang et al. 1996).
The technique of freeze-drying, or lyophilization, has been implemented to increase the shelf-life and stability of vaccines, viruses, and proteins in pharmaceutical production (Jennings 1999) and in liposomes as drug carriers with and without acoustic reflectivity (i.e. increased echogenicity) (Huang et al. 2002; Hua. et al. 2003). However, this process generates stresses during the freezing and drying stages which could destabilize the suspension and destroy the bubbles (Abdelwahed et al. 2006a). Some agents, such as liposomes, require the addition of cryoprotectants to aid stability during freezing (Ozer. et al. 1988) or lyoprotectants to help prevent structural and functional integrity loss that occurs during the drying process (Jennings 1999). This is achieved by preventing fusion and aggregation during freeze-drying thus allowing for better reconstitution (Hua. et al. 2003). It has been suggested that the major damaging factors associated with freeze-drying liposomes are lipid-phase transition and fusion (Crow 1997). Peer and co workers (2003) have shown that hyaluronan residues added to the surface of liposomes act as a cryoprotectant. Also, it was found that polymer nanoparticles have better redispersion properties after lyophilization with the addition of as polyethylene glycol, above 15 wt%, as well as sugars (Jeong et al. 2005; Abdelwahed et al. 2006a, Lee et al. 2009). It is believed that for sugars, a glassy matrix is formed around individual particles thereby preventing interactions between them and creating protection from the mechanical stresses exerted by the formation of ice crystals (Abdelwahed et al. 2006b; Christensen et al. 2008).
We have found that ST68 can be frozen and thawed without loss of echogenicity (unpublished results), however, during lyophilization stabilization is needed to protect against drying stresses. Lyoprotectants were therefore chosen to achieve such stability. With ST68, the gas bubbles in solution are stabilized by surfactants, a class of materials which has been shown to render poor protection against dehydration-induced damage (Costantino and Pikal 2004). Mono- and disaccharides are commonly used as both cryo- and lyoprotectants and are safe for parenteral administration into the human body (Garrow et al. 2000; Hua. et al. 2003).
Freshly prepared (native) ST68 consists of microbubbles suspended in buffer. Gas diffuses from the bubbles despite the steric stabilizing effect of polyoxy ethylene (POE) head groups (also known as polyethylene glycol) on Tween, causing the individual bubbles to eventually coalesce and burst. Keeping ST68 microbubbles from either collapsing or fusing during freeze-drying would potentially enable them to maintain echogenicity after reconstitution. This paper explores the feasibility of freeze-drying ST68 with and without lyoprotectants. Glucose, trehalose, sucrose, and mannitol, being among the most common excipients (Abdelwahed et al. 2006a), were evaluated as viable lyoprotectant that would enable reconstitution while maintaining the original echogenicity.
2. Materials and Methods
2.1 Materials
Span 60 (sorbitan monostearate), Tween 80 (polyoxyethylene sorbitan monooleate), potassium chloride, sucrose, D-glucose anhydrous, D-mannitol, D-trehalose dihydrate, potassium phosphate monobasic, sodium chloride, and sodium phosphate dibasic were all purchased from Sigma-Aldrich (St. Louis, MO). Octafluropropane (99% min) was purchased from American Gas Group (Toledo, OH).
2.2 Sample Preparation
ST68 was manufactured using a method developed in our laboratory (Wheatley et al. 1994; Wheatley and Singhal 1995; Wheatley et. al 2006). Aliquots of 2 ml of non-diluted ST68, were placed in 15 ml lyophilization vials (West Pharmaceutical Services, Lionville, PA) and diluted with 2 ml of a solution of selected sugar lyoprotectant dissolved in deionized (DI) water. Samples were flash frozen in liquid nitrogen (shown to prevent sample and solvent separation (Costantino and Pikal 2004) and improve the redispersion of nanoparticles (Lee et al. 2009) with Flurotec® lyophilization stoppers (West Pharmaceutical Services) placed on the vials to the first groove as exemplified by Jennings (1999). The lyoprotected ST68 was dried on a previously chilled (initially to −80°C) shelf for 18 to 20 hours using a Virtis Benchtop freeze-dryer (Gardiner, NY) at pressures below 300 µBar and a condenser temperature of −76°C. Prior to venting, a piston was lowered thus sealing the stoppers on the vials. To measure the temperature profile of the samples, a thermocouple was frozen within the center of the matrix prior to lyophilization. The temperature of the frozen matrix was recorded every 10 minutes on a remote 4 Channel Datalogger Thermometer (Sper Scientific LTD, Scottsdale, AZ) for the duration of the freeze-drying process.
After the ST68 samples were lyophilized, octafluoropropane gas was introduced via a needle into the vials through the stopper septum at a flow rate of 50 ml/min for the first 5 to 10 seconds then 20 ml/min for the next minute to insure the vials were filled. Finally, parafilm was wrapped around the stopper/vial seal to prevent gas diffusion. Before use, the freeze-dried ST68 was reconstituted by hand agitation with 2 ml DI water and 2 ml phosphate buffered saline (PBS), both at 4°C, yielding a 1:1 dilution facto compared to the original non-diluted sample.
2.3 Residual Water Content
Freeze-dried samples of ST68 in lyophilization vials were unstoppered and weighed. Each vial was then placed within an Imperial III incubator (Lab-Line Instruments Inc., Melrose Park, ILL) set to 60°C for 24 hours and weighed again. This procedure was repeated until the weight of the samples remained constant indicating that all residual water had been removed. The water content was calculated as a percentage of initial weight.
2.4 Size Characterization
All size measurements were carried out using a Zetasizer nano ZS (Malvern Inst., Worcestershire, UK). Twenty-five µl of agent was dispersed into 975 µl of PBS and gently inverted to ensure thorough mixing. For each sample, three measurements (z-average diameter which was found to be more consistent in measuring ST68 size than number or size average) were taken and averaged together.
2.5 Microscope Imaging
Polarized Light Microscopy (PLM) images of ST68 samples were taken of individual drops of ST68 with each excipient. These samples were previously placed onto a glass slide and frozen in a −80°C freezer before being lyophilized overnight. PLM images were taken at 20X with an Olympus BX50 model U-SDO (Tokyo, Japan) using PixeLINK Capture OEM 2005 software (Ottawa, ON, Canada).
Samples of ST68G-100 (100 mM glucose stabilized freeze-dried ST68) and ST68 control (freeze-dried without lyoprotectant) were prepared on an aluminum specimen mount, previously covered with a 12 mm non-conductive adhesive tab, having excess sample blown off with pressurized air. Samples were then carbon coated for 8 seconds using a Cressington 208 bench-top carbon evaporator (Watford, England). Images were taken with a Zeiss Supra 50 (Cambridge, Cambridgeshire, UK) scanning electron microscope (S.E.M.) with Oxford Energy Dispersive Microanalysis (EDS) (Abingdon, Oxfordshire, UK) set to 3.5 kV and with an aperture of 4 mm.
2.6 In vitro Acoustic Setup
An acrylic sampling container holding 50 ml of 37°C PBS, housing an acoustic viewing window of 3 × 3 cm, was placed within a larger acrylic tank holding 20 gallons of 37°C DI water to be used for acoustic testing of the samples, as previously described (Basude et al. 2000). The contents of the sampling container were continuously stirred with a magnetic stirrer between 200 and 400 rpm. A Panametrics (Waltham, MA) 5 MHz transducer with a 12.7 mm diameter, −6 dB bandwidth of 91%, and focal length of 50.8 mm was focused through the sampling window. Acoustic pressure amplitudes were generated with a Panametrics pulse/receiver (5072 PR) at a pulse repetition frequency (PRF) equal to 100 Hz. Using a 0.5 mm polyvinylidene fluoride needle hydrophone (Precision Acoustics, Dorset, UK), peak positive and negative pressures were measured at 0.69 and 0.45 MPa, respectively. Received signals were amplified 40 dB and read using a digital oscilloscope (LeCroy 9350A, LeCroy Corporation, Chestnut Ridge, NY). Labview 7.1 express (National Instruments, Austin, TX) was utilized to process the data.
2.7 In vitro Dose and Time Response
Quantities of test samples of ST68 were measured by pipette (Gilson Pipetman, Middleton, WI) and dispersed into the sampling container. A cumulated dose curve (expedient for discerning comparisons between lyoprotectants) was generated by pipetting increments of agent into the sample chamber while measuring the acoustic response. The curve was used to determine the dose at which maximum reflection was achieved and to assess differences between samples prepared with various lyoprotectants. Shadowing occurred when the concentration of bubbles was high, thus causing a total reflection of the US signal (Bogdahn et al. 2001). To examine the stability of the UCA while being exposed to an ultrasound beam, 1samples on the rise of the dose response curve (100 µl/l for reconstituted freeze-dried samples and 30 µl/l for the native agent) were insonated over a 15 minute period with readings taken every minute, after a 10 second delay to allow for sample mixing. The chosen volumes gave similar concentrations of microbubbles (2.5 to 3.0 × 10⁹ microbubbles per milliliter as measured by a hemocytometer) and were selected to prevent anomalous high stability readings that would be obtained by recording unchanged enhancement from degrading bubbles in an over-saturated system. Data was normalized by the initial dB value to allow for inter-sample comparison. Half-life data was extracted from the response of the agents over time by fitting a line to the section of the curve which passed through 50% of maximum enhancement. For all, a native ST68 and a freeze-dried (not lyoprotected) control were used for comparison.
2.8 In vivo Acoustic Testing
Dose response curves were generated in three 3 kg New Zealand white rabbits with ST68G-100. Each rabbit was sedated with 35 mg/kg ketamine and 3.5 mg/kg xylazine. Increasing volumes, from 0.005, 0.01, 0.05, 0.1, to 0.15 ml/kg were injected through an angiography catheter inserted into the left ear vein, followed by a flush of 5 ml sterile saline. Roughly 5 to 10 minutes passed between each dose to ensure total removal of the agent and a return to baseline values. A Sonix RP scanner (Ultrasonix Medical Corp., Richmond, BC, Canada) recorded all data received by the L14-5 linear array set to 5 MHz with a PRF of 6.7 kHz and a gain of 44% in pulse Doppler mode, having been focused on the mid abdominal aorta. Pulse inversion harmonic imaging (PIHI), with a power of −8 dB and a PRF of 1 kHz, was used to image the kidney with a dose of 0.1 ml/kg. These studies were carried out under the guidance of a veterinarian and all protocols were approved by Jefferson University’s Animal Care and Use Committee. A similar dose curve was previously generated with native and nano ST68 (Forsberg et al. 1996; Wheatley et al. 2006).
2.9 Statistical Analysis
All data is presented as mean ± SEM (standard error about the mean) with all experiments repeated at least 3 times (n=3). For all data, statistical significance was determined using a one-way ANOVA with a Newman-Keuls post test assuming normal distribution and focusing on comparisons with controls. All testing was preformed using Prism 3.0 (GraphPad, San Diego, CA) with a probability value cut off of 0.05 chosen to determine statistical significance.
3. Results
3.1 Effect of Each Lyoprotectant on the UCA
For all lyoprotectants, bubble size remained constant with an average of 3 ± 0.2 µm with no statistical difference calculated between samples (p>0.05). These results (not shown) are larger than previously reported (Basude et al. 2000). All samples were significantly less than 8 µm, ensuring they would be able to transverse the pulmonary capillary bed (Bouakaz and de Jong 2007). However, upon visual inspection, large particles remained after reconstitution with the use of mannitol and sucrose; this also occurred with non-lyoprotected ST68 control samples. Since these particles were buoyant, they rapidly rose to the top of the cuvette and eluded Zetasizer measurements which are based on Brownian motion of particles in the target area.
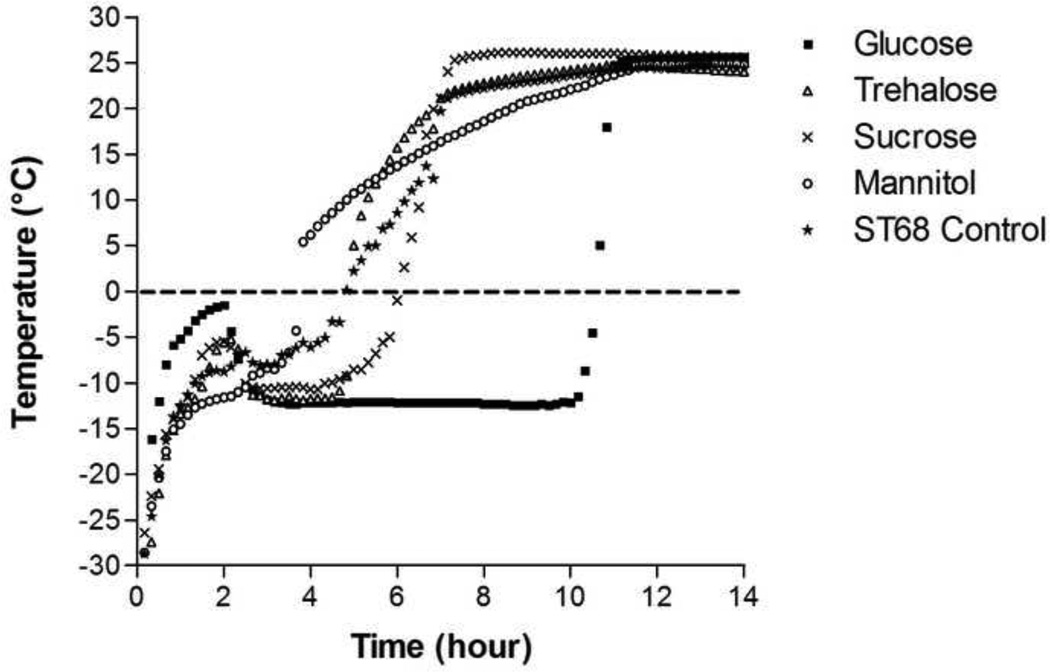
During lyophilization, the thermocouples embedded in sample vials indicated that glucose was able to keep the sample at a temperature of −12°C, (zero slope, linear portion of the temperature/time curve (Fig. 1)), the longest (7 hours). Trehalose and sucrose maintained this temperature for only 2 hours while mannitol merely passed through, having a constantly rising temperature profile. All samples, aside from mannitol-protected ST68, had an initial rise in temperature to the 2 hour mark followed by a cooling to the −12°C steady state sublimation temperature.
Figure 1.
Recorded temperature readings of lyoprotected (100mM) and control ST68 samples during freeze-drying. Glucose addition maintained the sample at a constant temperature of −12°C longer (7 hours) than other excipients: 1 to 2 hours for trehalose and sucrose addition with mannitol addition causing a steadily rising temperature profile.
After lyophilization, all of the samples had between 2 and 6% residual water content (Table 1), with no statistical differences measured (p>0.05). Trehalose samples had the lowest (2.2 ± 0.2%) with glucose and control samples being around 5%. Water content alone did not affect the overall echogenicity or stability of the sample.
Table 1.
Residual Water in Lyophilized ST68
| Excipient | Water Content (%) |
|---|---|
| Glucose | 5.0 ± 0.2 |
| Trehalose | 2.2 ± 0.2 |
| Sucrose | 4.2 ± 1.3 |
| Mannitol | 4.1 ± 0.1 |
| ST68 Control | 5.2 ± 0.8 |
3.2 In vitro Acoustic Performance
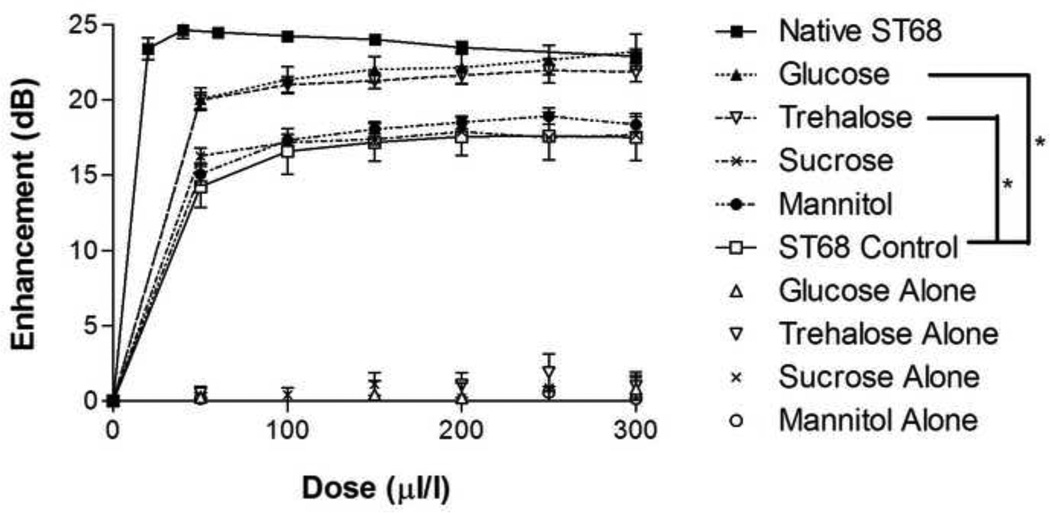
At 100 mM (Huang et al. 2002), both glucose and trehalose provided statistically greater in vitro enhancement (p<0.001) than that of the reconstituted sucrose, mannitol, and the ST68 control (freeze-dried without the addition of lyoprotectant) (Fig. 2). A peak enhancement of 23.2 ± 1.2 dB and 21.9 ± 0.7 dB were measured for glucose and trehalose respectively, both being statistically equivalent (p>0.5) to the 24.5 ± 0.2 dB enhancement of native ST68. Samples lyophilized in the presence of sucrose and mannitol provided a peak enhancement of 17.9 ± 0.1 dB and 18.9 ± 0.5 dB, respectively, but were not statistically greater than the control, which yielded a 17.6 ± 1.6 dB peak enhancement (p>0.05). For all sugar controls (freeze-dried dissolved sugar in PBS without the addition of ST68), an average enhancement of 0.4 ± 0.1 dB was recorded, signifying that the lyoprotectant itself did not have any inherent echogenic properties.
Figure 2.
Dose response curve of lyophilized ST68 in 100 mM lyoprotectant solutions. All sugar controls (e.g. glucose alone) are dissolved in PBS, lyophilized, and PFC gas introduced but do not contain any agent. Glucose and trehalose were significantly greater than the control and also sucrose and mannitol by the same degree (*p<0.001, error bars = SEAM, f = 5 MHz, 684 kPa, PRF = 100 Hz)
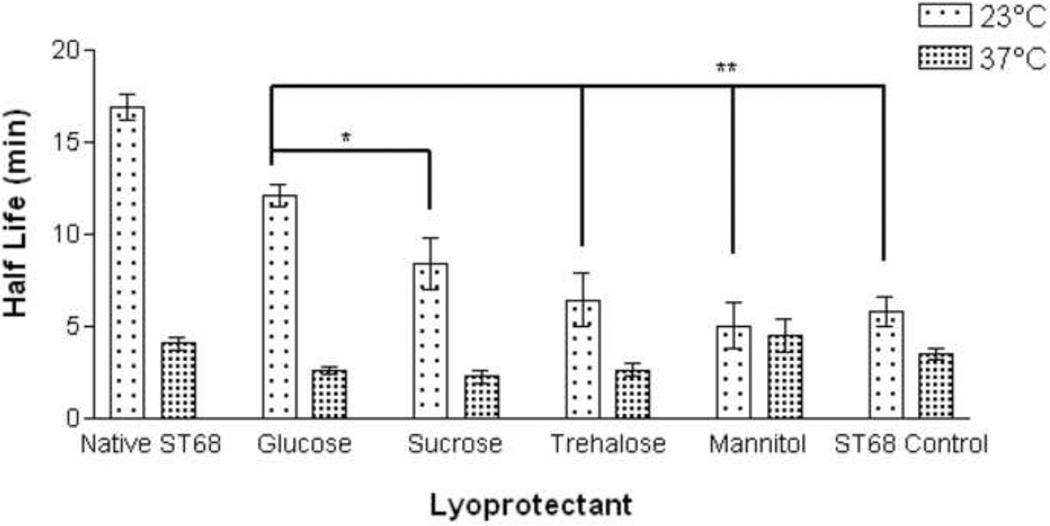
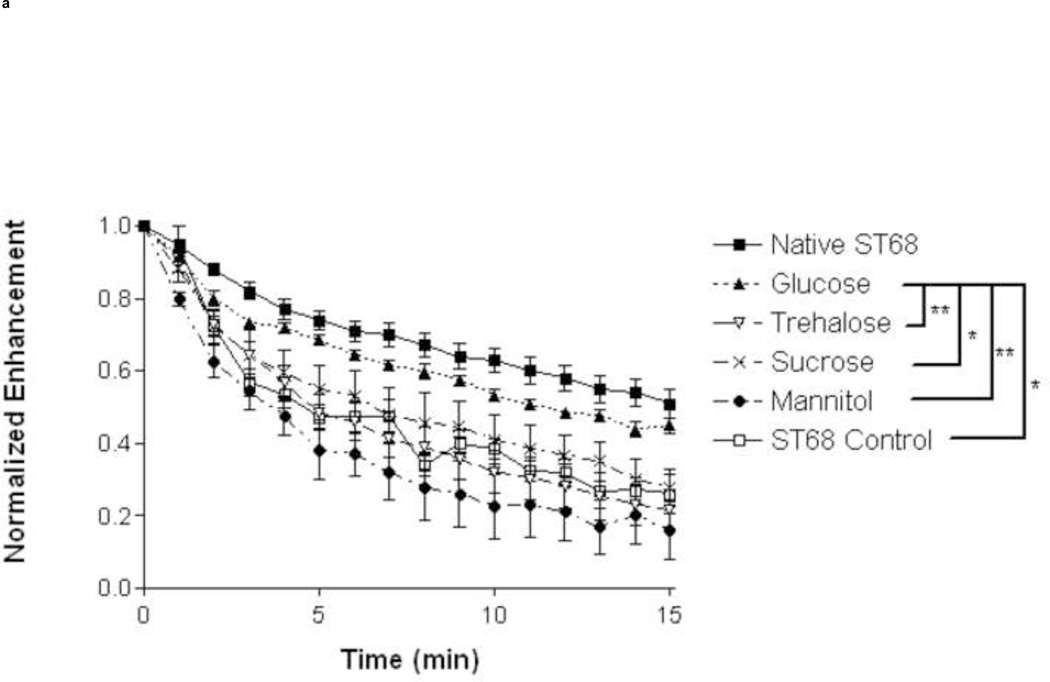
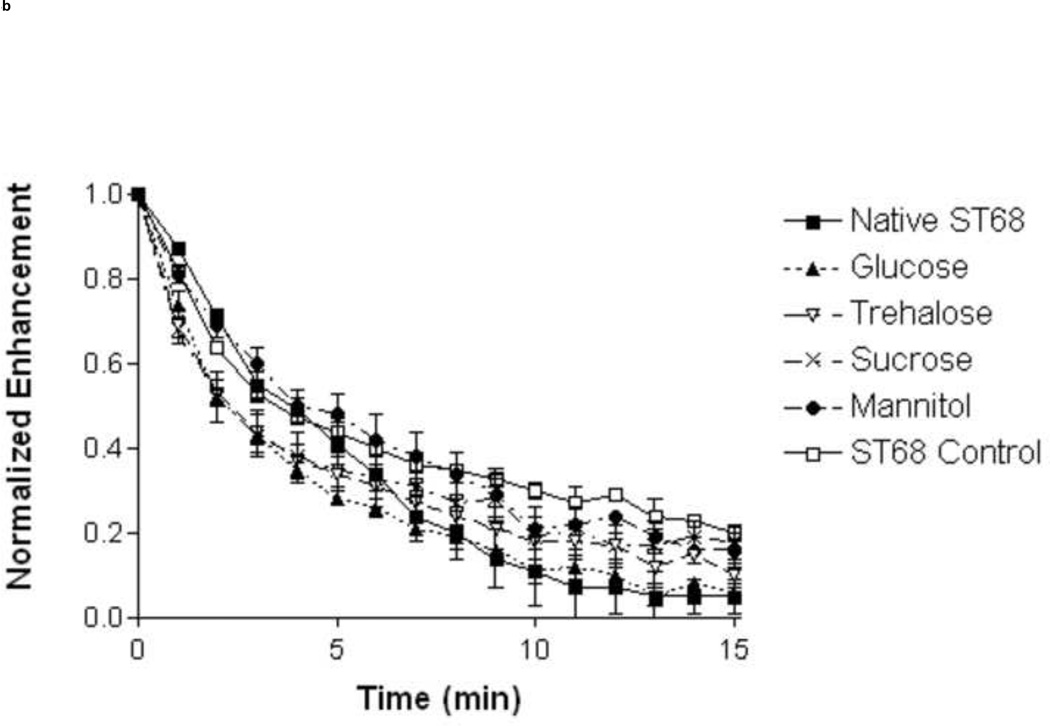
A study of stability (Fig. 3) was completed for all lyoprotected samples at room temperature (23°C) and body temperature (37°C). At 23°C glucose provided longer stability (12.1 ± 0.6 min.) over the ST68 control (5.8 ± 0.8 min., p<0.01) and all other lyoprotectants (p<0.05 over sucrose and <0.01 over rest). After 15 minutes, samples preserved with glucose retained the highest residual activity (45% [7 ± 0.4 dB]) over all other lyoprotected samples (p<0.05 for sucrose and ST68 control, p<0.01 for trehalose and mannitol) and did not statistically differ from native ST68 (55% [11.7 ± 0.9 dB]) over the duration (Fig. 4a). However, at 37°C there were no statistical differences (p>0.05) between the half lives of any reconstituted lyoprotected ST68 when compared to the naked reconstituted control, yielding an average half life of 3.1 ± 0.5 minutes (Fig. 3) and sustaining measurable echogenicity for over 10 minutes (Fig. 4b).
Figure 3.
Half life of lyophilized ST68 in 100 mM lyoprotectant solutions tested at room (23°C) and body (37°C) temperature. ANOVA testing revealed ST68 with glucose at room temperature to be the only lyoprotected agent statistically greater than that of the ST68 control and all other lyoprotectants (*p<0.05, **p<0.01). (f = 5 MHz, 684 kPa, PRF = 100 Hz)
Figure 4.
Normalized time response of lyophilized ST68 in 100 mM lyoprotectant solutions tested at 23°C (A) and 37°C (B) temperature. ANOVA testing showed ST68 with glucose at 23°C to be the only lyoprotected agent statistically greater than that of the ST68 control and all other lyoprotected samples after 15 minutes (*p<0.05, **p<0.01) (f = 5 MHz, 684 kPa, PRF = 100 Hz)
3.3 Polarized Light Microscopy
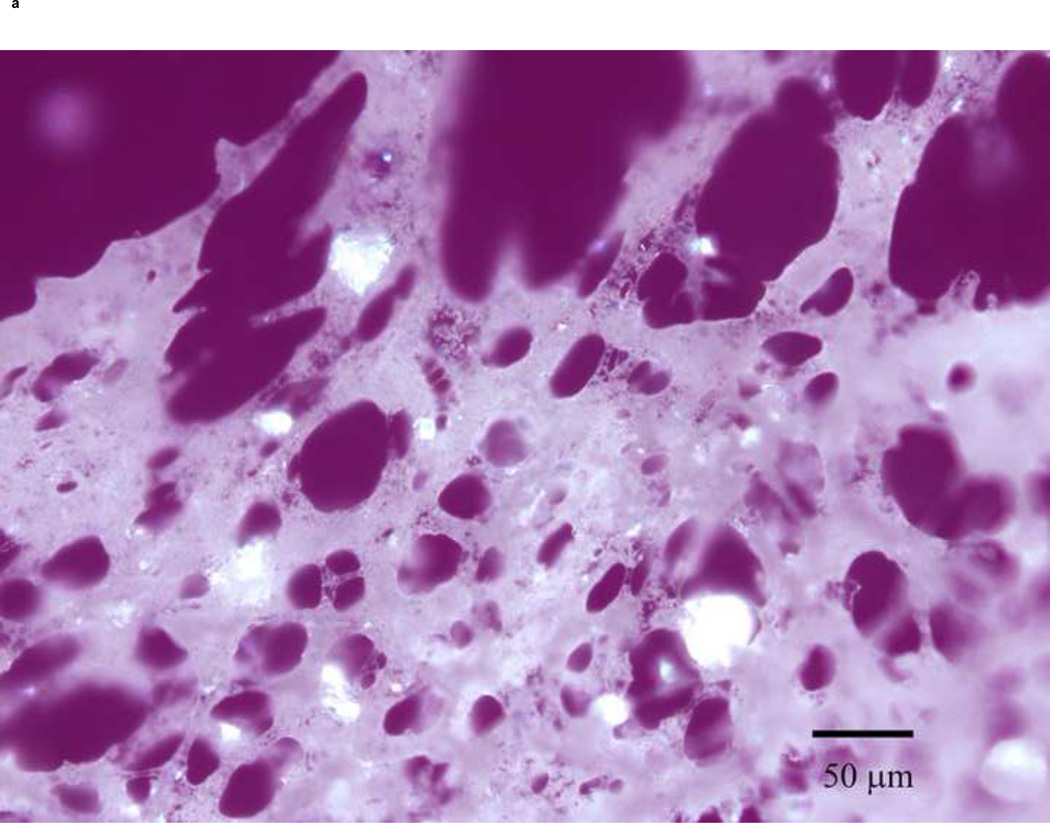
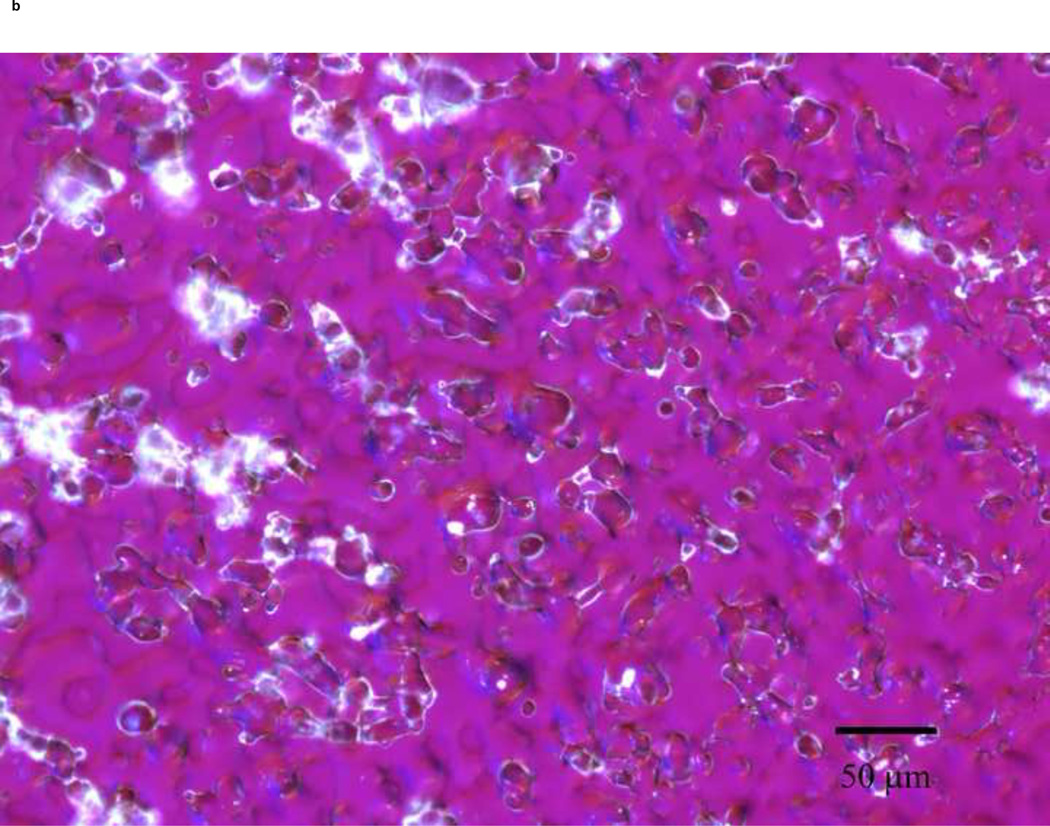
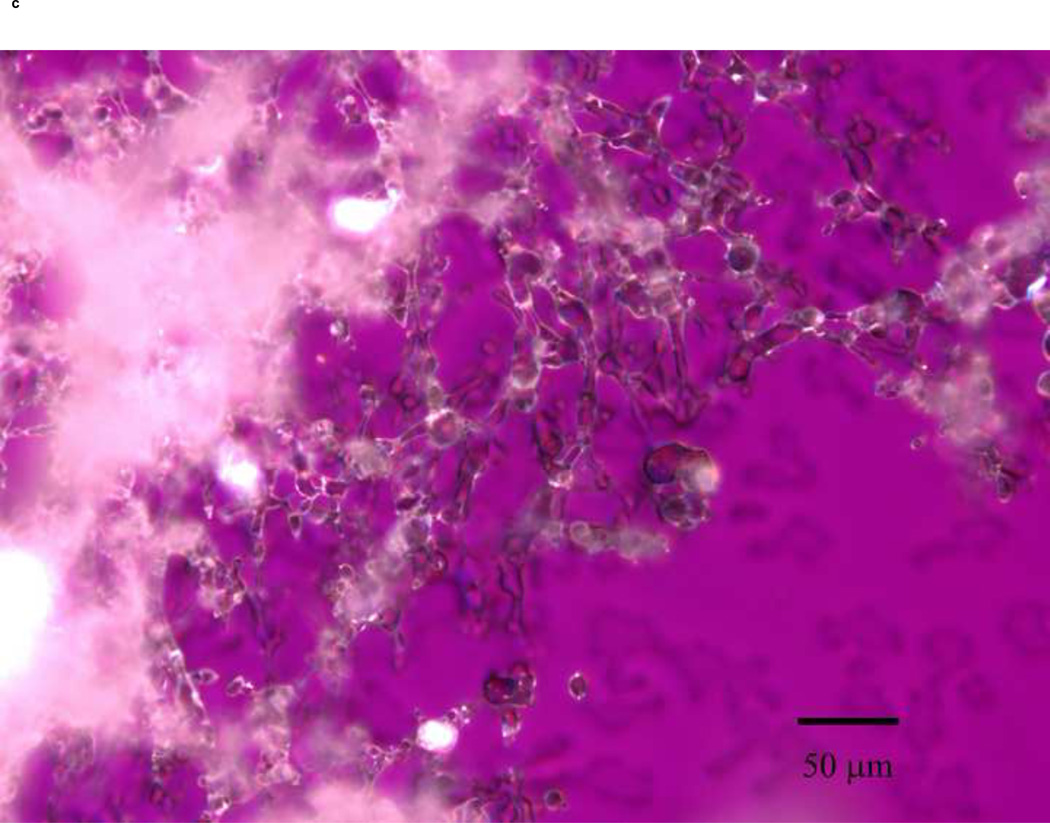
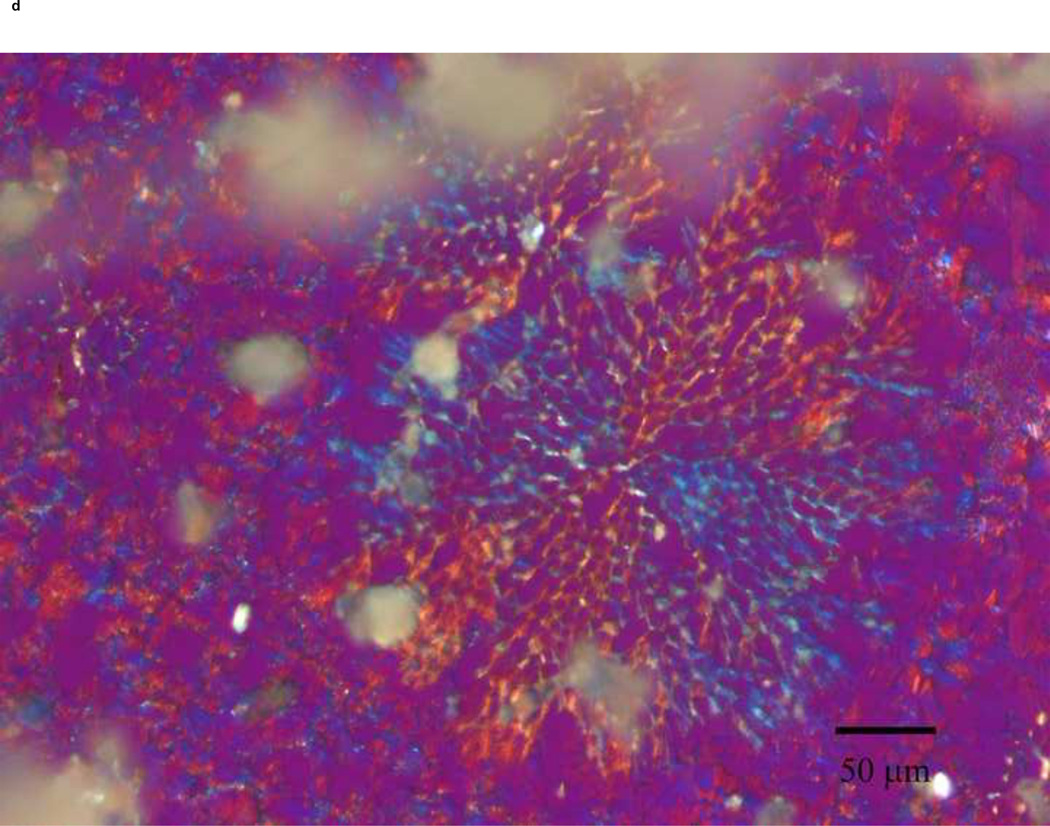
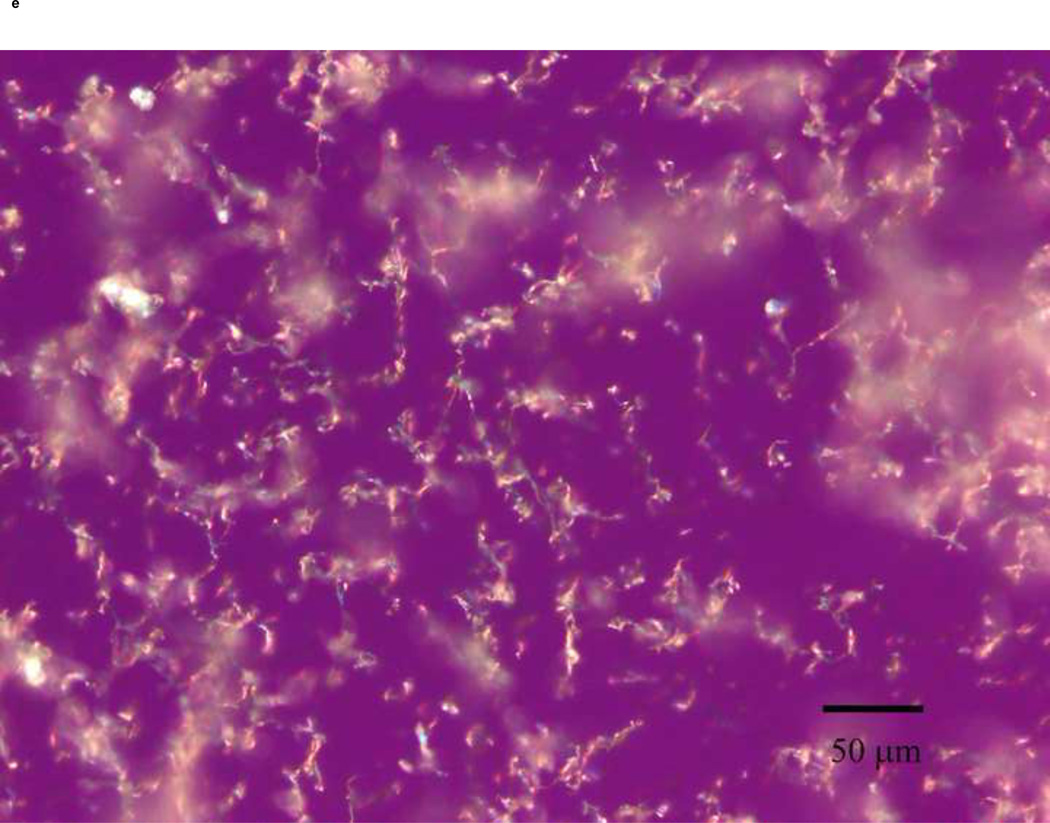
PLM images were taken to better describe the mechanism of stabilization of the different sugars. The images indicate that mannitol (Fig. 5d) is the only excipient that crystallized while glucose (a), trehalose (b) and sucrose (c) formed amorphous matrices. ST68 control, without any lyoprotectant, (e) is amorphous as well but does not show any presence of a glassy matrix.
Figure 5.
Olympus BX50 PLM images were taken at 20X of lyophilized samples of ST68 with and without excipients (100mM). Mannitol (D) shows a crystalline structure while the others excipients form glassy matrices. Control ST68 samples (E) contained no evidence of either an amorphous glassy matrix or crystallization, being diluted 1:1 with PBS instead of a sugar solution. Visually, glucose protected ST68 (A) seems to form the most intact glassy matrix with trehalose (B) and sucrose (C) have glassy spindles.
3.4 Glucose Concentration Optimization
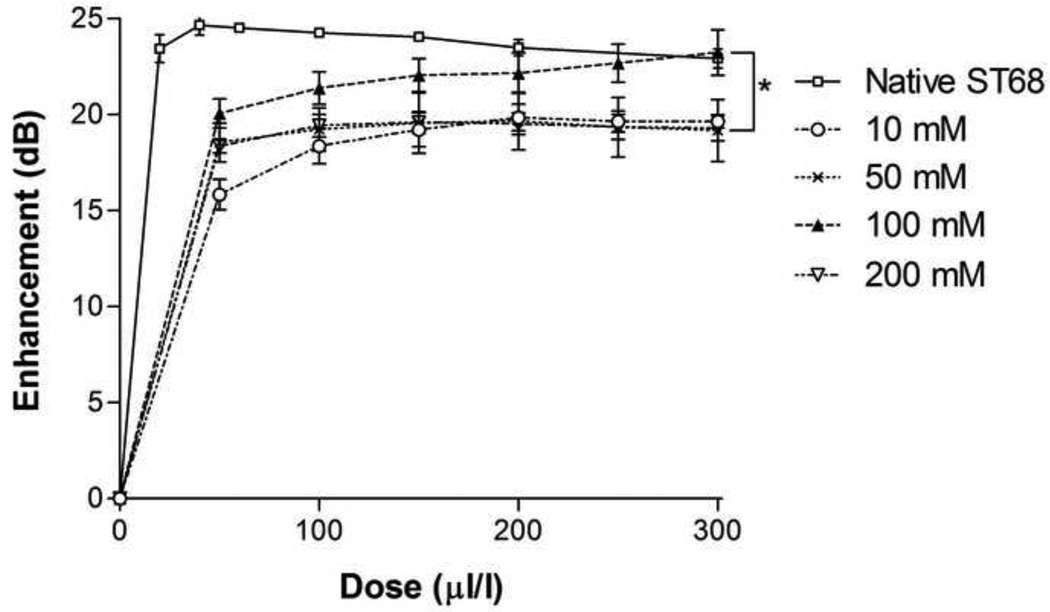
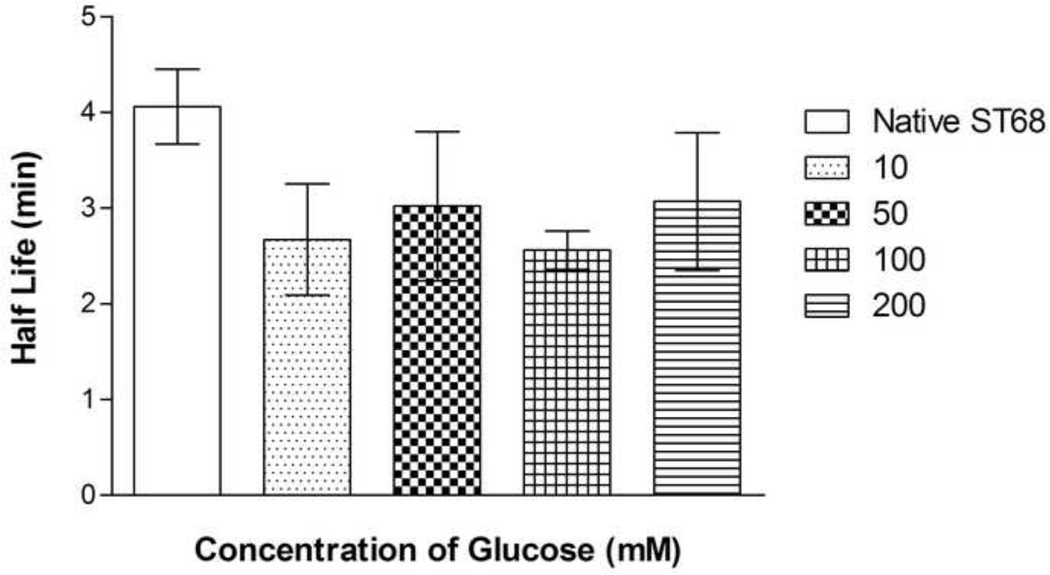
A range of final glucose concentrations, from 10 mM to 200 mM or 0.2 to 3.6% w/v, was tested for optimization. This range is consistent with concentrations used for freeze-drying in literature (Jeong et al. 2005). While not statistically significant (p>0.05), 100 mM of glucose-protected samples (ST68G-100), 1.8% w/v, provided a 4 dB greater peak enhancement (23.2 ± 1.2 dB) over the other concentrations (Fig. 6). The half life at 37°C of all glucose lyoprotected agents, however, remained constant at an average of 2.8 ± 0.1 minutes, signifying that the concentration of glucose did not significantly affect the stability of ST68 (Fig. 7). Yet, with 200 mM of glucose, the final product (cake) after freeze-drying had evidence of collapse, melt back (thawing during drying), and crystallization. This caused reconstitution difficulties.
Figure 6.
Dose response curve of lyophilized ST68 in various glucose concentrations. No statistical differences measured (p>0.05). (f = 5 MHz, 684 kPa, PRF = 100 Hz)
Figure 7.
Half life data of lyophilized ST68 in various glucose concentrations. No differences are statistically significant (p>0.05). (f = 5 MHz, 684 kPa, PRF = 100 Hz)
3.5 Shelf-life Study
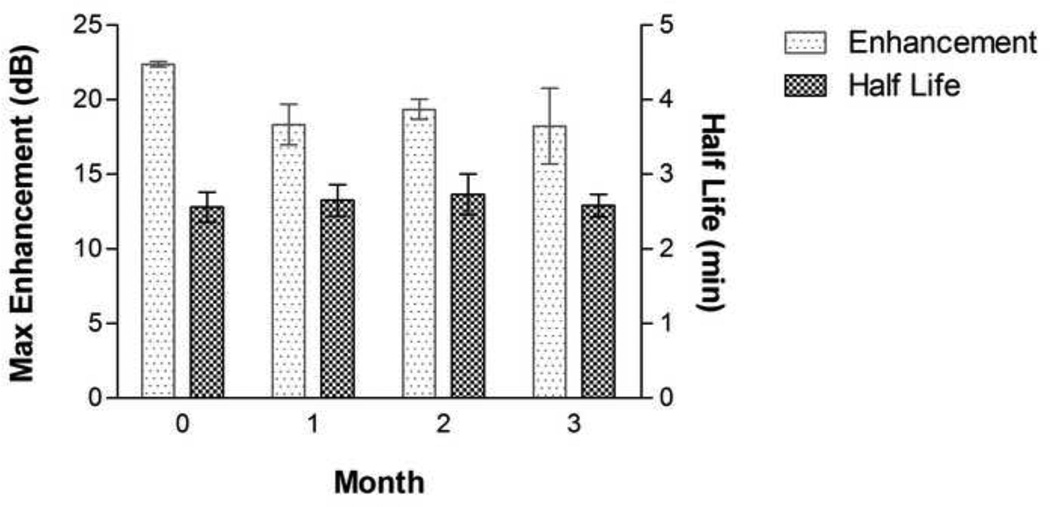
ST68G-100 was tested at 100 µl/l for stability at the start of each month over a period of 3 months. No statistical differences were found (p>0.05), having an average maximum enhancement of 19.6 ± 1.0 dB and half-life of 2.6 ± 0.1 minutes for the duration (Fig. 8). Originally, ST68 would be stable for a maximum of a few weeks, being stored at 4°C, before the collapse and coalescence of bubbles decreased the effect of the agent. Having a freeze-dried form of this agent stable for over 3 months at room temperature negates the need for immediate production prior to use.
Figure 8.
Maximum echogenicity and half life data of ST68G-100 tested over a period of 3 months at the start of each month. No statistical differences were measured (p>0.05). (f = 5 MHz, 684 kPa, PRF = 100 Hz)
3.6 Scanning Electron Microscope Imaging
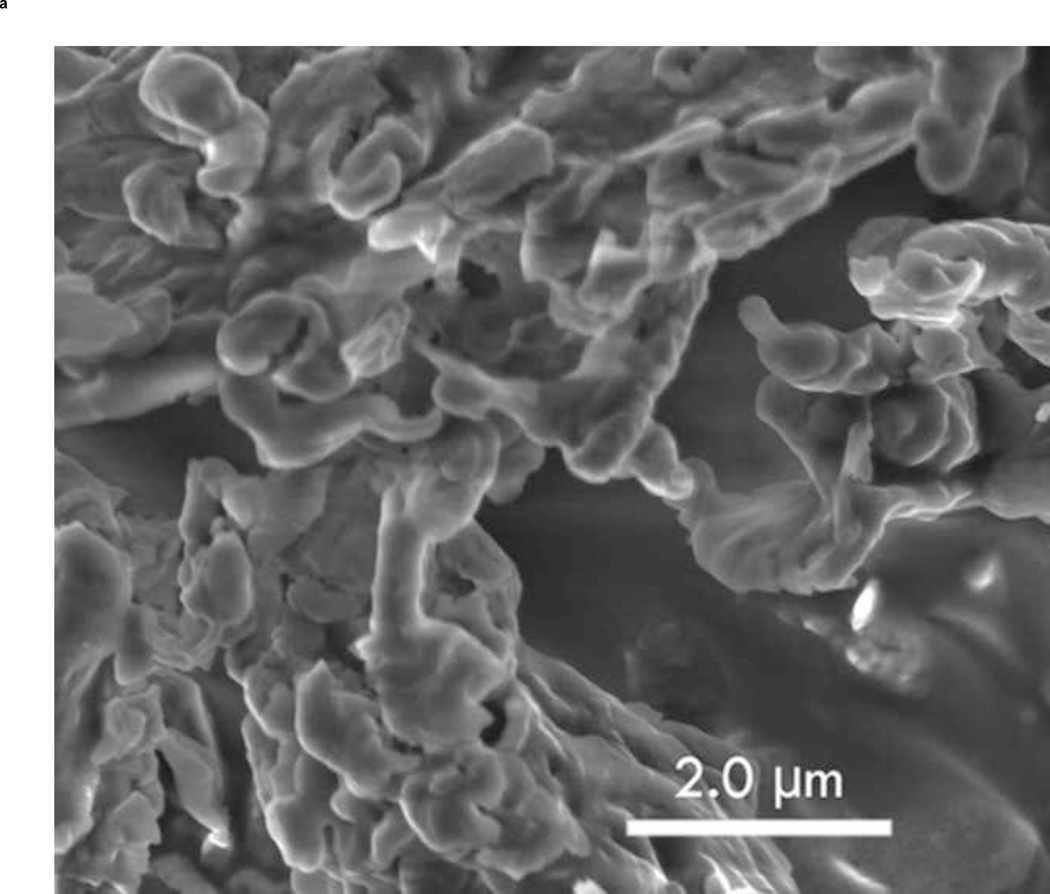
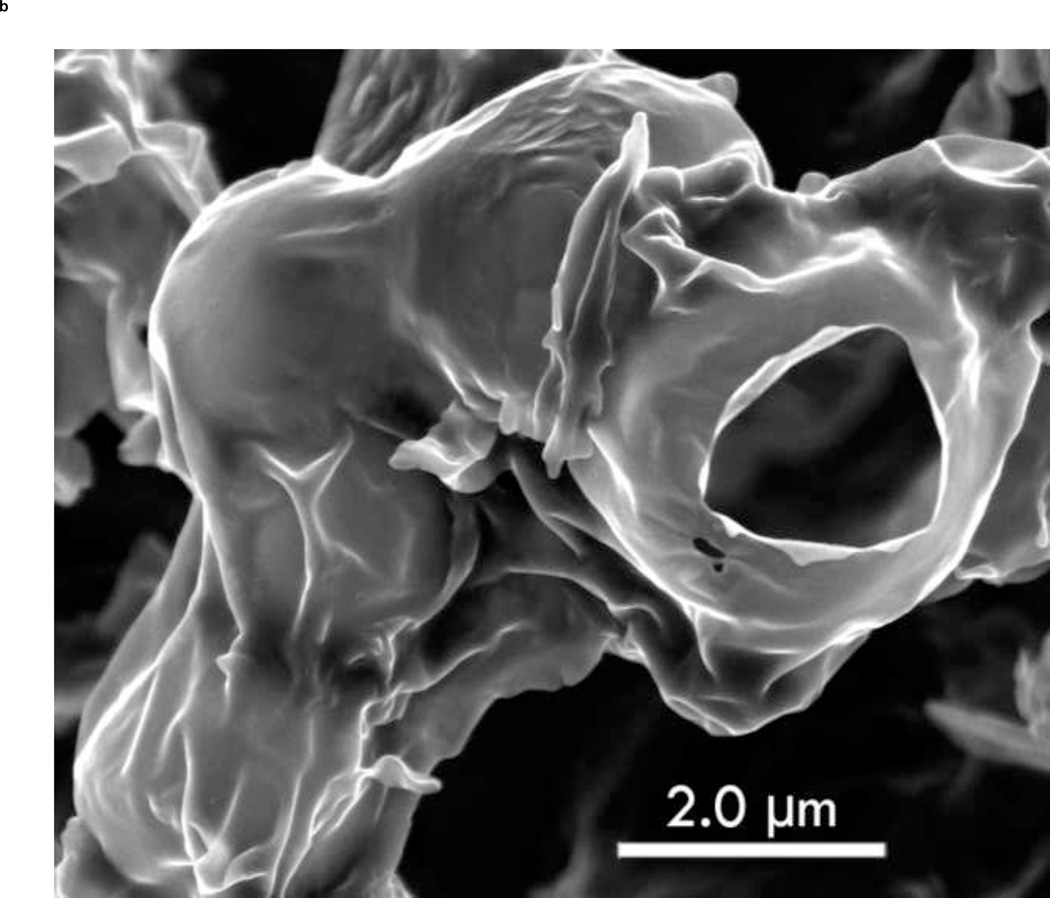
To show the difference between ST68G-100 and ST68 control (without lyoprotectant), S.E.M. images were taken of both after freeze-drying and PFC gas introduction. Protected bubbles can be seen in Fig. 9a while without the addition of a lyoprotectant, bubbles are not present (Fig. 9b). The ruptured capsule in Fig. 9a clearly shows the hollow mature of these particles, as well as their fragile nature since it could have been ruptured during sample preparation for imaging.
Figure 9.
Zeiss Supra 50 S.E.M. images of ST68G-100 (A) and ST68 without lyoprotectant (B) were taken at 6,000x with an Oxford Energy Dispersive Microanalysis (EDS) set to 3.5 kV and an aperture of 4mm. (Size bar = 2 µm)
3.7 In vivo Study
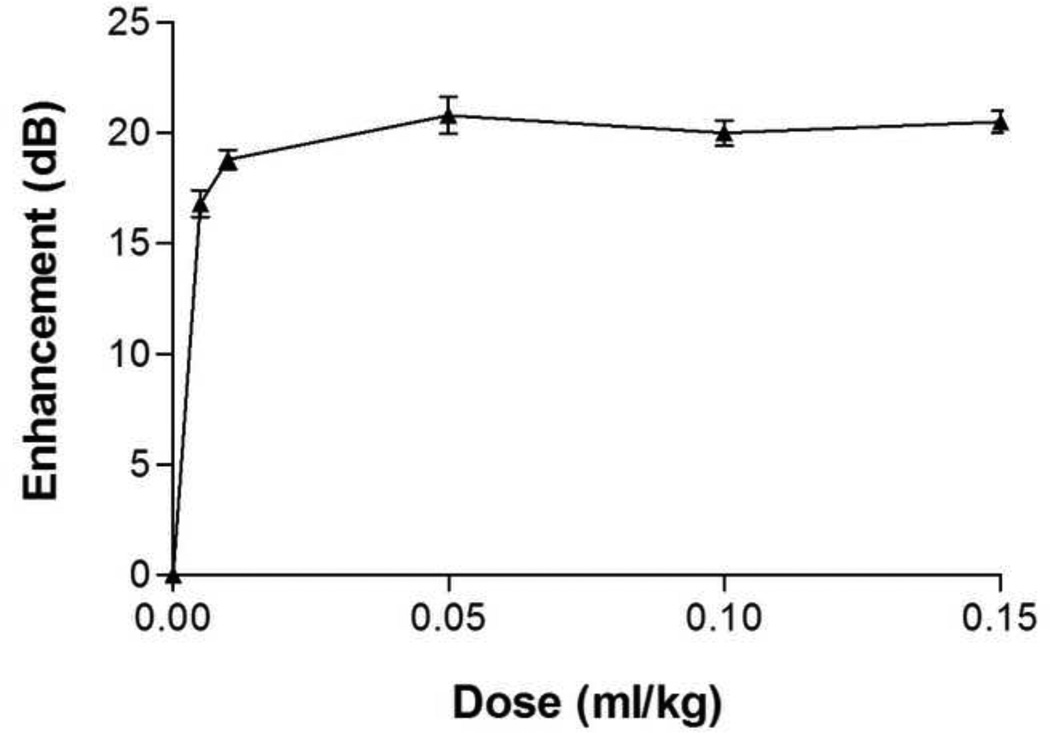
The in vivo dose response experiments of ST68G-100 (Fig. 10) were modeled after previous studies (Forsberg et al. 1996; Wheatley et al. 2006) of ST68 for direct comparison. Previously, a maximum peak enhancement of 26.1 ± 0.5 dB (Forsberg et al. 1996) and 23.7 ± 2.9 dB (Wheatley et al. 2006) were recorded for the native and nano ST68, respectively. The freeze-dried agent, ST68G-100, was chosen for this study based on results outlined above and provided a peak enhancement of 20.8 ± 0.8 dB, being 4 dB below the recorded average of native and nano ST68.
Figure 10.
Dose response curves of ST68G-100 in-vivo preformed on a New Zealand white rabbit with a Sonix RP scanner on pulse Doppler mode at 5 MHz and a PRF of 6.7 kHz.
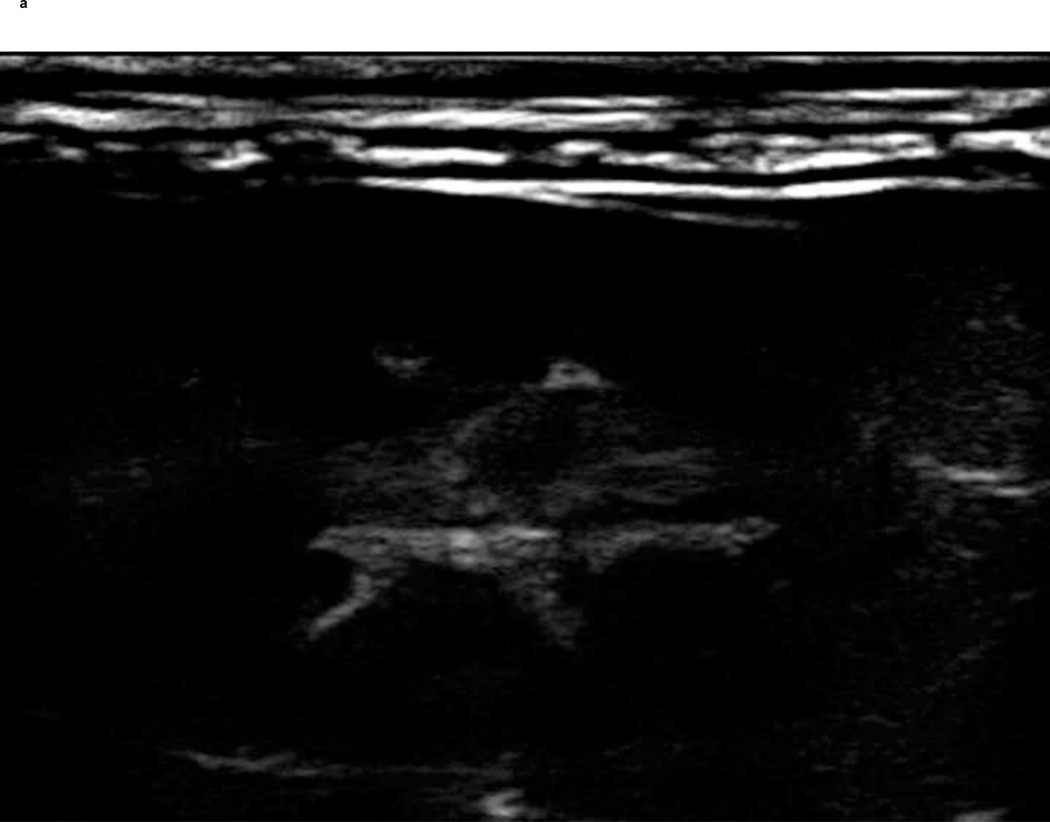
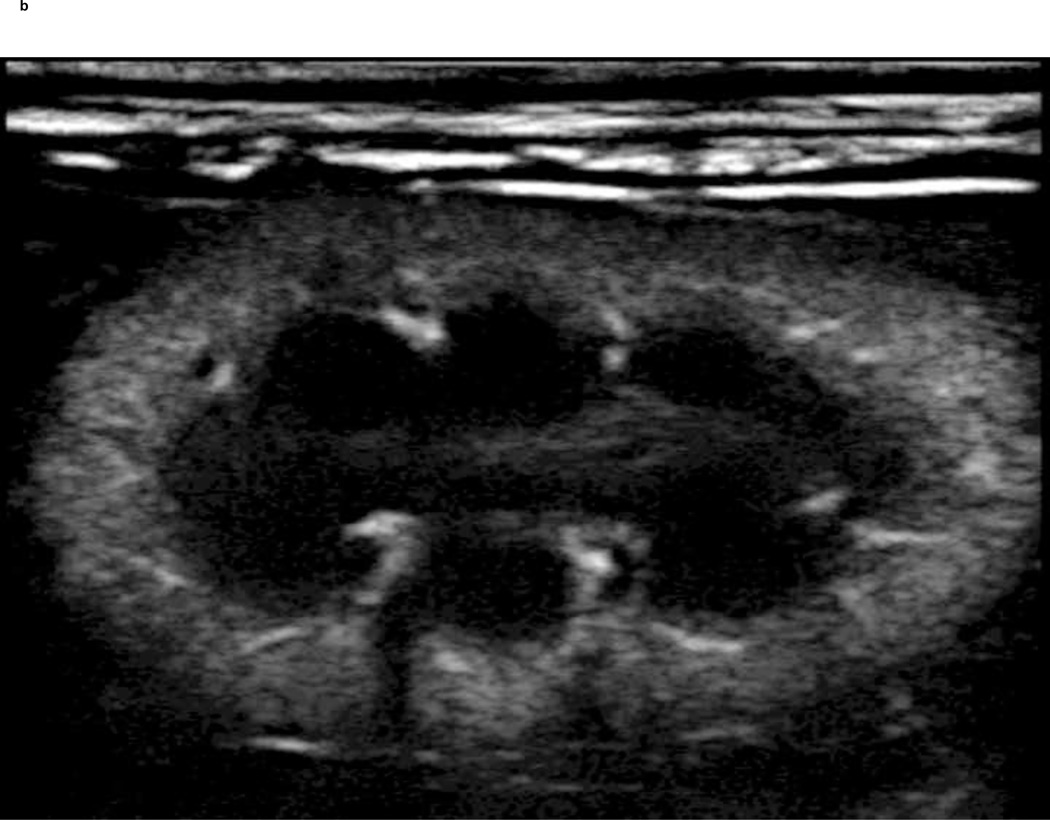
A PIHI (5 MHz) of a New Zealand white rabbit kidney pre and post injection of a reconstituted freeze-dried ST68G-100 sample is depicted in Fig. 11. The vasculature and parenchyma boundaries of the kidney are clearly visible after injection of 0.1 ml/kg contrast. Additionally, pulse Doppler images (results not shown) of the same agent and injection volume were comparable to non-freeze dried examples.
Figure 11.
Before (A) and 5 seconds after (B) 0.1 ml/kg injection of ST68G-100 into a 3.3 kg New Zealand white rabbit with enhancement lasting for at least 40 seconds (Sonix RP scanner in pulse inversion mode at 5 MHz, PRF of 1 kHz, −8 Power)
4. Discussion
Most surfactant-stabilized bubbles consist of self-assembled vesicles, with a degree of fragility, so it becomes vital that an excipient be used to protect the UCA from destruction and aggregation during freeze-drying. This allows for full reconstitution of an agent with similar echogenicity and stability to the freshly prepared agent (in this case ST68). Sugars are frequently used with their success, for example in stabilizing structurally similar liposomes, attributed in part to their ability to interact (hydrogen bond) with the polar head groups of the constituent phospholipids (water replacement hypothesis) (Carpenter and Crowe 1989; Green and Angell 1989; Engel et al. 1994). A second hypothesis (water entrapment hypothesis) holds that the excipient entraps the residual water at the interface by glass formation, thus preserving the native salvation (Koster et al. 1994; van Winden and Crommelin 1999; Cordone et al. 2007). The lyoprotectant has the ability to form an amorphous, glassy matrix around the vesicles upon drying while lowering dehydration forces (Costantino and Pikal 2004). This matrix is clearly seen in our system as seen in the S.E.M. images (Fig. 9). Also in evidence is a ruptured bubble, which may or may not have ruptured during the S.E.M. process, but which visibly shows the hollow nature of the bubble formed with a very thin shell. Sharma and Kalonia (2004) suggest that sugar lyoprotectants follow both of these hypotheses – replacing water and forming a stable glassy matrix. Furthermore, PLM images (Fig. 5) show that an amorphous glassy matrix is present in all lyoprotectants except mannitol (c), which depicts a crystalline structure. From these images alone, it seems that glucose (a) forms the most protective glassy matrix.
Although all the tested lyoprotectants resulted in agents that reconstituted to give over 15 dB of enhancement, glucose and trehalose provided the best protection resulting in a 5 dB increase over the others. However, this pairing is surprising. Simperler reported experimental and calculated glass transition temperatures (Tg) of some of the pure sugars of interest, trehalose (107°C), sucrose (60°C), glucose (23°C) (Simperler et al. 2006), while mannitol is reported at 11°C (Yu et al. 1998). Hua et al. studied the protective effects of these sugars on liposome-encapsulated ftorafur and vitamin A and also measured the glass transition temperature (Tg) of their suspensions (Hua et al. 2003). The group reported the retention rates for reconstituted freeze-dried liposomal contents followed the same trend as the Tg, indicating that the best protection was from trehalose and the worst from glucose. In freeze-drying, primary drying of the solvent by sublimation should be carried out below the collapse temperature (Tc), around 2°C higher than the Tg for pure components (Abdelwahed et al. 2006a). The collapse temperature is the value above which the material softens to the point of deformation (Costantino and Pikal 2004). Because of the closeness of the two values, many authors refer to Tg as Tc, adding some confusion in the literature. The equal protective effects of glucose and trehalose observed by us were therefore unexpected and suggests that there is more involved in stabilizing UCA than with liposomes.
Despite their differences, both glucose and trehalose are found in excess in certain organisms as a means to survive harsh environmental conditions (Croes and Thomas 2000; Cordone et al. 2007). An alternate, though not dissimilar, mechanism of stabilization comes from the glassy matrix of sugars, exemplified by trehalose, being viscous enough to inhibit molecular motion (Costantino and Pikal 2004; Sampedro and Uribe 2004; Cordone et al. 2007). It is possible that in the case of ST68 the increase in viscosity caused by the presence of the excipients slows the molecular motion of the POE groups on the sorbitan heads of the Tween 80 and prevents bubble coalescence.
The temperature profiles (Fig. 1) help support this theory. The samples containing sugars that formed a glassy matrix took longer to fully lyophilize, indicating a decreased rate of water sublimation and hence a decrease in the drying stresses. All protected samples reached a steady state at −12°C, indicating a constant rate of sublimation where the heat being removed from the sample equaled the heat being supplied to it, with mannitol samples passing through this temperature quickly. This constant temperature has been shown for other sugar solutions (Schelenz et al. 1995). Only mannitol samples did not show a period of warming followed by a cooling at the 2 hour mark to the steady state temperature of −12°C. This warming might be explained by the formed amorphous glassy matrix as shown in the PLM image (Fig. 5). This glassy matrix increases the ability of the solvent (water) to vitrify during flash freezing. Vitrification, in this case, is used to describe the prevention of crystallization (Jennings, 1999). While the collapse temperature of water is −135°C, the water itself will not start to sublime until it reforms from its vitrified amorphous state to a more stable crystalline state as explained by Hudson and Donn (1991) and Jennings (1999).
A better formed glassy matrix, and thus increased vitrification of the water, will prolong the period of time it takes for the water to crystallize (Patapoff and Overcashier 2002), with glucose solutions taking almost twice as long to sublime than trehalose solutions, due to the decrease in nucleation points (Nelson 1998) and lessened degree of resulting crystallization. During this time, no heat of sublimation is being removed; therefore, the sample gradually warms as the shelf temperature warms. Once crystallization has reached a critical point, the water begins to sublime and the sample cools to −12°C. Additionally, increased vitrification, caused by a well formed glassy matrix, decreases the size of the water crystals and helps decrease the rate of sublimation as a result, since sublimation is diffusion limited (Nelson 1998; Patapoff and Overcashier 2002). The degree of crystallization not only affects the overall sublimation time but also the amount of stresses experienced by the sample. These stresses are caused by the rate of sublimation, “water vapor mass transfer kinetics” (Nakagawa et al. 2010), determined by crystal size, and the rate of the water crystal growth (Abdelwahed et al. 2006b), both minimized by the excipient’s ability to form a glassy matrix. Mannitol-protected ST68, which was shown to crystallize (Fig. 5d), had the most rapid rate of sublimation (Fig. 1) due to channels formed within the matrix from the crystals, resulting from poor vitrification. These results explain how glucose-stabilized ST68 had the highest echogenicity over all excipients, with mannitol having the lowest.
A significant feature upon reconstitution was that samples involving sucrose and mannitol, along with the ST68 control, contained large particles that remained refractory to resuspension. It has been shown that mannitol and sucrose can actually promote particle aggregation in nanoparticles and could explain these results (Abdelwahed et al. 2006a; Lee et al. 2009). However, literature suggests that particles freeze-dried in the presence of glucose would also have reconstitution problems (Abdelwahed et al. 2006a), but these were not evident with glucose-protected ST68 microbubbles. Residual particles left after reconstitution are usually an indication that the product collapsed during freeze-drying alluding to the primary drying phase taking place at temperatures above the Tc of the samples (Costantino and Pikal 2004). But again, for the amorphous excipients tested, glucose has the lowest reported Tg (and hence Tc) and would be expected to perform poorly (Abdelwahed et al. 2006a). The progressively higher Tg of glucose, sucrose, and trehalose would suggest that they should be able to sustain sample structure and prevent bubble collapse at correspondingly higher temperatures (Jennings 1999; Costantino and Pikal 2004).
Visual inspection of all freeze-dried ST68 samples showed fully intact cakes with no signs of shrinkage or melt-back. When considering the Tg of the sample, we must look further than that of just the sugar lyoprotectant. The solution of microbubbles and lyoprotectant together has a far different Tg than the sugars alone. Crowe et al. (1996) formulated a simple equation to calculate the solution’s Tg as a weighted percent of solute and solvent’s Tg. The concentration (100 mM) of sugars used for protecting ST68 minimally changes the Tg of the solvent (water). Using this equation, the Tgs change from the values listed above to −133.7, −133.9, −134.3, and −134.3°C for sucrose, trehalose, mannitol, and glucose respectively. These temperatures are far lower than that of the bench top freeze-dryer used in this study. Therefore, the process of freeze-drying ST68 in the presents of sugar excipients cannot be explained by this estimated Tg since this alone does not characterize the actual collapse of the entire bubble matrix, though some collapse and breakage of bubbles is inevitable. Technically, the collapse temperature, or Tg in this case, occurs when the amorphous water becomes mobile, i.e. forms crystals but this does not include the added stability of the microbubbles (Jennings, 1999). A more accurate characterization of our system would be the degree that each excipient formed a glassy matrix and was thus able to minimize the dehydration stresses felt upon the bubbles caused by subliming water vapor flow (Patapoff and Overcashier 2002) and prevent particle aggregation rather than referring to the temperatures at which water becomes mobile (collapse temperature).
Upon further examination of glucose as a lyoprotectant (Fig. 6 and 7), it was found that while the tested concentration range (0.18 to 3.6% w/v) did not statistically affect the echogenicity of stability of the reconstituted ST68, however, 3.6% w/v (200 mM) glucose provided to be in such excess that the resulting freeze-dried cake was collapsed and crystallized. With freeze-dried glucose alone (without ST68), a final crystallized product also resulted. This indicates that there is a cut-off point for the amount of glucose that can be added before the glucose causes the product to collapse in on itself instead of coating, protecting, and supporting the UCA. The concentration of 1.8% w/v (100 mM) showed a slight increase in echogenicity over lesser concentrations and was chosen for further in vivo study, although the increase was not statistically significant. ST68G-100 consistently produces an average in vivo enhancement of 20 ± 0.6 dB (Fig. 10). This enhancement is within 2 dB of the predicted in vitro results (Fig. 2) indicating that the in vitro results provide a close prediction of the maximum in vivo enhancement.
On a final note, the in vivo dose response results (Fig. 10) confirm that the chosen freeze-drying method produces an agent that reconstitutes to an excellent imaging agent. The data also shows that the in vitro and in vivo measurements are very close. Taking the average blood volume of a New Zealand white rabbit as 92.5 ml/kg (Jahr et al. 2001) a completely dispersed 0.005 ml/kg dose of ST68G-100 would correspond to 54 µl/l, while 0.01 ml/kg and 0.05 ml/kg doses would equal 108 µl/l and 540 µl/l, respectively. This dose range, from 0.005 ml/kg to 0.05 ml/kg (54 µl/l to 540 µl/l), cover the range tested in the in vitro dose response curves, with 100 µl/l being the tested dose for all stability studies. However, a bolus injection contrast would not fully disperse throughout the rabbit uniformly as it would when injected into the in vitro sampling container and thus in vitro data acts only as a guide. In addition many other mechanisms are at play in vivo, such as interactions with blood components such as phospholipids and the pressures experienced within the heart. Nevertheless, the in vitro enhancement produced with a 100 µl/l dose results in 21.3 ± 0.8 dB while 0.01 ml/kg (108 µl/l) dose results in 18.8 ± 0.4 dB, which validates the in vitro testing method to approximate in vivo conditions as closely as possible.
In conclusion, an effective method of preserving surfactant-stabilized UCA, that retains echogenicity and stability, has been developed. While the exact mechanism is unclear, it was found that glucose, at a concentration of 100 mM (1.8% w/v), provided the best overall lyoprotection of ST68 over sucrose, mannitol, or a close second, trehalose. Upon reconstitution, this agent at 37°C in vitro gave a peak US enhancement of 23.2 ± 1.2 dB (at 5 MHz) with a half life of 2.6 ± 0.2 minutes and had measurable echogenicity continuing for over 10 minutes. In vivo, echogenicity of 20.8 ± 0.8 dB was recorded as the maximum. Having the ability to freeze-dry this agent greatly increases its utility by increasing the shelf-life (thus recorded stable for 3 months) and portability of the agent while eliminating the necessity for immediate on-site preparation.
5. Acknowledgments
This work was funded by the National Institute of Health (grant HL-52901). S.E.M. images were taken in the Centralized Research Facility at Drexel University in the Department of Engineering with the assistance of Dee Breger. Sonographers D.A. Merton and Tracy Fox assisted with in vivo imaging work at Thomas Jefferson University Dept. of Radiology. Thanks are due to J-B Lui MD (Thomas Jefferson Hospital) for in vivo assistance in placing the intravenous catheter and injecting samples.
Footnotes
Publisher's Disclaimer: This is a PDF file of an unedited manuscript that has been accepted for publication. As a service to our customers we are providing this early version of the manuscript. The manuscript will undergo copyediting, typesetting, and review of the resulting proof before it is published in its final citable form. Please note that during the production process errors may be discovered which could affect the content, and all legal disclaimers that apply to the journal pertain.
References
- Abdelwahed W, Degobert G, Fessi H. Investigation of nanocapsules stabilization by amorphous excipients during freeze-drying and storage. Euro. Pharm. Biopharm. 2006a;63:87–94. doi: 10.1016/j.ejpb.2006.01.015. [DOI] [PubMed] [Google Scholar]
- Abdelwahed W, Degobert G, Stainmesse S, Fessi H. Freeze-drying of nanoparticles: Formulation, process and storage considerations. Adv. Drug Deliv. Rev. 2006b;58:1688–1713. doi: 10.1016/j.addr.2006.09.017. [DOI] [PubMed] [Google Scholar]
- Anderson B. Echocardiography: the normal examination and echocardiographic measurements. Manly, Queensland, AU: MGA Graphics; 2004. [Google Scholar]
- Basude R, Duckworth JW, Wheatley MA. Influence of environmental conditions on a new surfactant-based contrast agent: ST68. Ultrasound Med. Biol. 2000;26:621–628. doi: 10.1016/s0301-5629(99)00151-9. [DOI] [PubMed] [Google Scholar]
- Basude R, Wheatley MA. Generation of ultraharmonics in surfactant based ultrasound contrast agents: use and advantages. Ultrasonics. 2001;39:437–444. doi: 10.1016/s0041-624x(01)00080-4. [DOI] [PubMed] [Google Scholar]
- Bogdahn U, Hölscher T, Schlachetzki F. Transcranial color-coded duplex sonography (TCCS) In: Dunitz M, editor. Ultrasound Contrast Agents: Basic principles and clinical applications. London, UK: Martin Dunitz Ltd; 2001. pp. 253–265. [Google Scholar]
- Bouakaz A, de Jong N. WFUMB safety symposium on echo-contrast agents: Nature and types of ultrasound contrast agents. Ultrasound Med. Biol. 2007;33:187–96. doi: 10.1016/j.ultrasmedbio.2006.07.008. [DOI] [PubMed] [Google Scholar]
- Carpenter JF, Crowe JH. An infrared spectroscopic study of the interactions of carbohydrates with dried proteins. Biochemistry. 1989;28:3916–3922. doi: 10.1021/bi00435a044. [DOI] [PubMed] [Google Scholar]
- Christensen D, Kirby D, Foged C, Agger EM, Andersen P, Perrie Y, Nielsen HM. alpha, alpha'-trehalose 6,6'-dibehenate in non-phospholipid-based liposomes enables direct interaction with trehalose, offering stability during freeze-drying. Biochim. Biophys. Acta. 2008;1778:1365–1373. doi: 10.1016/j.bbamem.2008.01.013. [DOI] [PubMed] [Google Scholar]
- Costantino HR, Pikal MJ. Lyophilization of biopharmaceuticals (Biotechnology: Pharmaceutical Aspects) Arlington, VA: American Association of Pharmaceutical Sciences; 2004. [Google Scholar]
- Cordone L, Cottone G, Guiffrida S. Role of residual water hydrogen bonding in sugar/water/biomolecule systems: a possible explanation for trehalose peculiarity . J. Phys.: Condens. Matter. 2007;19:1–16. [Google Scholar]
- Correas JM, Bridal L, Lesavre A, Mejean A, Claudon M, Helenon O. Ultrasound contrast agents: properties, principles of action, tolerance, and artifacts. Eur. Radiol. 2001;11:1316–1328. doi: 10.1007/s003300100940. [DOI] [PubMed] [Google Scholar]
- Croes SA, Thomas RE. Freeze Tolerance and Cryoprotectant Synthesis of the Pacific Tree Frog Hyla regilla. Copeia. 2000;2000:863–868. [Google Scholar]
- Crowe JH, Oliver AE, Hoekstra FA, Crowe LM. Stabilization of Dry Membranes by Mixtures of Hydroxyethyl Starch and Glucose: The Role of Vitrification. Cryobiol. 1997;35:20–30. doi: 10.1006/cryo.1997.2020. [DOI] [PubMed] [Google Scholar]
- Crow LM, Reid DS, Crowe JH. Is trehalose special for preserving dry biomaterials? Biophys. 1996;71:2087–2093. doi: 10.1016/S0006-3495(96)79407-9. [DOI] [PMC free article] [PubMed] [Google Scholar]
- Engel A, Bendas G, Wilhelm F, Mannova M, Ausborn M, Nuhn P. Freeze drying of liposomes with free and membrane-bound cryoprotectants — the background of protection and damaging processes. Int. J. Pharm. 1994;107:99–110. [Google Scholar]
- Feinstein SB, Cate FJT, Zwehl W, Ong K, Maurer G, Tei C, Shah PM. Meerbaum S, Corday E. Two-dimensional contrast echocardiography. I: in vitro development and quantitative analysis of echo contrast agents. JACC. 1984;3:14–20. doi: 10.1016/s0735-1097(84)80424-6. [DOI] [PubMed] [Google Scholar]
- Forsberg F, Rawool NM, Merton DA, Liu JB, Wang W, Kankate P, Alessandro J, Goldberg BB, Wheatley MA. Comparison of Air and Perfluorocarbon Filled Microbubbles for Ultrasound Contrast Studies. IEEE Ultrasonics Symp. 1996;2:1337–1340. [Google Scholar]
- Garrow JS, James WPT, Ralph A. Human nutrition and dietetics. 10th Ed. London, UK: Churchill Livingstone; 2000. [Google Scholar]
- Goldberg BB, Liu J-B, Forsberg F. Ultrasound contrast agents: A review. Ultrasound Med. Biol. 1994;20:319–333. doi: 10.1016/0301-5629(94)90001-9. [DOI] [PubMed] [Google Scholar]
- Gramiak R, Shaw PM. Echocardiography of the aortic root. Invest. Radiol. 1968;3:356–358. doi: 10.1097/00004424-196809000-00011. [DOI] [PubMed] [Google Scholar]
- Green JL, Angell CA. Phase relations and vitrification in saccharide-water solutions and the trehalose anomaly. J. Phys. Chem. 1989;93:2880–2882. [Google Scholar]
- Hua Z-Z, LI B-G, Liu Z-J, Sun D-W. Freeze-drying of liposomes with cryoprotectants and its effect on retention rate of encapsulated ftorafur and vitamin A. Drying Technol. 2003;21:1491–1505. [Google Scholar]
- Huang S, Hamilton AJ, Tiukinhoy SD, Nagaraj A, Kane BJ, Klegerman M, McPherson DD, MacDonald RD. Liposomes as ultrasound imaging contrast agents and as ultrasound-sensitive drug delivery agents. Cell Molec. Biol. Letters. 2002;7:233–235. [PubMed] [Google Scholar]
- Hudson RL, Donn B. An experimental study of sublimation of water ice and the release of trapped gasses. Icarus. 1991;94:326–332. [Google Scholar]
- Hutter JC, Luu HM, Mehlhaff PM, Killam AL, Dittrich HC. Physiologically based pharmacokinetic model for fluorocarbon elimination after the administration of an octafluoropropane-albumin microsphere sonographic contrast agent. J. Ultrasound Med. 1999;18(1):1–11. doi: 10.7863/jum.1999.18.1.1. [DOI] [PubMed] [Google Scholar]
- Jahr JS, Lurie F, Xi S, Golkaryeh M, Kuznetsova O, Kullar R, Driessen B. A Novel Approach to Measuring Circulating Blood Volume: The Use of a Hemoglobin-Based Oxygen Carrier in a Rabbit Model. Anesth. Analg. 2001;92:609–614. doi: 10.1097/00000539-200103000-00010. [DOI] [PubMed] [Google Scholar]
- Jennings TA. Lyophilization: Introduction and Basic Principles. Denver, CO: Interpharm. Press; 1999. [Google Scholar]
- Jeong Y-I, Shim Y-H, Kim C, Lim G-T, Choi K-C, Yoon C. Effect of Cryoprotectants on the Reconstitution of Surfactant-free Nanoparticles of Poly(DL-lactide-co-glycolide) J. Microencap. 2005;22:593–601. doi: 10.1080/02652040500162659. [DOI] [PubMed] [Google Scholar]
- Killam AL, Mehlhaff PM, Zavorskas PA, Greener Y, McFerranm BA, Miller JJ, Burrascano C, Jablonski EG, Anderson L, Dittrich HC. Tissue distribution of 125I-labeled albumin in rats, and whole blood and exhaled elimination kinetics of octafluoropropane in anesthesized canines, following IV administration of Optison (FS069) Int. J. Tox. 1999;18:49–63. [Google Scholar]
- Koster KL, Webb MS, Bryant G, Lynch DV. Interactions between soluble sugars and POPC (1-palmitoyl-2-oleoylphosphatidylcholine) during dehydration: vitrification of sugars alters the phase behavior of the phospholipid. Biochim. Biophy. Acta - Biomem. 1994;1193:143–150. doi: 10.1016/0005-2736(94)90343-3. [DOI] [PubMed] [Google Scholar]
- Lee MK, Kim MY, Kim S, Lee J. Cryoprotectants for freeze drying of drug nano-suspensions: Effect of freezing rate. J. Pharm. Sci. 2009;98:4808–4817. doi: 10.1002/jps.21786. [DOI] [PubMed] [Google Scholar]
- Lindner JR. Contrast ultrasound molecular imaging of inflammation in cardiovascular disease. Cardiovascular Res. 2009;84:182–189. doi: 10.1093/cvr/cvp302. [DOI] [PMC free article] [PubMed] [Google Scholar]
- Marshall BE, Longnecker DE. General anesthetics. In: Goodman LS, Gilman A, editors. The Pharmacological Basis of Therapeutics. 9th Ed. New York: McGraw-Hill; 1996. p. 315. [Google Scholar]
- Miller AP, Nanda NC. Contrast echocardiography: new agents. Ultrasound Med. Biol. 2004;30:425–434. doi: 10.1016/j.ultrasmedbio.2003.12.002. [DOI] [PubMed] [Google Scholar]
- Nakagawa K, Hottot A, Vessot S, Andrieu J. Modeling of freezing step during vial freeze-drying of pharmaceuticals - influence of nucleation temperature on primary drying rate. Asia-Pacific J. Chem. Eng. 2010 in press. [Google Scholar]
- Nelson J. Sublimation of ice crystals. J. Atmos. Sci. 1999;55:910–919. [Google Scholar]
- Ozer Y, Talsma H, Crommelin DJA, Hincai AA. Influence of freezing and freeze-drying on the stability liposomes dispersed in aqueous media. Acta Pharm. Technol. 1988;34:129–139. [Google Scholar]
- Patapoff TW, Overcashier DE. The importance of freezing on lyophilization cycle development. BioPharm Int. 2002 Mar;:16–21. [Google Scholar]
- Peer D, Florentin A, Rimona Margali R. Hyaluronan is a key component in cryoprotection and formulation of targeted unilamellar liposomes. BBA -Biomembranes. 2003;1612:1676–1682. doi: 10.1016/s0005-2736(03)00106-8. [DOI] [PubMed] [Google Scholar]
- Pikal MJ. Freeze Drying. In: Swarbrick J, editor. Encyclopedia of Pharmaceutical Technolcogy. 3rd Ed. Vol 3. New York, NY: Informa Healthcare USA, Inc; 2006. pp. 1807–1833. [Google Scholar]
- Sampedro JG, Uribe S. Trehalose-enzyme interactions result in structure stabilization and activity inhibition. The role of viscosity. Mol. Cell Biochem. 2004;256:319–327. doi: 10.1023/b:mcbi.0000009878.21929.eb. [DOI] [PubMed] [Google Scholar]
- Sarvazyan AP, Hill CR. Physical Chemistry of the Ultrasound—Tissue Interation. In: Hill CR, Bamber JC, ter Harr GR, editors. Physical Principles of Medical Ultrasonics. 2nd Edition. West Sussex, UK: Wiley; 2004. pp. 223–236. [Google Scholar]
- Schelenz G, Engel J, Rupprecht H. Sublimation during lyophilization detected by temperature profile and X-ray technique. Int. J. Pharm. 1995;113:133–140. [Google Scholar]
- Sharma VK, Kalonia DS. Effect of vacuum drying on protein-mannitol interactions: the physical state of mannitol and protein structure in the dried state. AAPS PharmaSciTech. 2004;5:1–12. doi: 10.1208/pt050110. [DOI] [PMC free article] [PubMed] [Google Scholar]
- Simperler A, Kornherr A, Chopra R, Bonnet PA, Jones W, Motherwell WDS, Zifferer G. Glass Transition Temperature of Glucose, Sucrose, and Trehalose: An Experimental and in Silico Study. J. Phys. Chem. B. 2006;110:19678–19684. doi: 10.1021/jp063134t. [DOI] [PubMed] [Google Scholar]
- van Winden ECA, Crommelin DJA. Short term stability of freeze-dried, lyoprotected liposomes. J. Controlled Release. 1999;58:69–86. doi: 10.1016/s0168-3659(98)00130-8. [DOI] [PubMed] [Google Scholar]
- Wang W, Moser CC, Wheatley MA. Langmuir trough study of surfactant mixtures used in the production of a new ultrasound contrast agent consisting of stabilized microbubbles. J. Phys. Chem. 1996;100:13815–13821. [Google Scholar]
- Weathersby PK, Homer LAD. Solubility of inert gases in biological fluids and tissues: A review. Undersea Biomed. Res. 1980;7:277–296. [PubMed] [Google Scholar]
- Wheatley MA, Forsberg F, Dube N, Patel M, Oeffinger BE. Surfactant-stabilized contrast agent on the nanoscale for diagnostic ultrasound imaging. Ultrasound Med. Biol. 2006;32:83–93. doi: 10.1016/j.ultrasmedbio.2005.08.009. [DOI] [PubMed] [Google Scholar]
- Wheatley MA, Shah P, Singhal S, Goldberg BB. Surfactant-stabilized microbubble mixtures, process for preparing and methods of using the same. US patent #5. 1994;352:436. [Google Scholar]
- Wheatley MA, Singhal S. Structural studies on stabilized microbubbles: development of a novel contrast agent for diagnostic ultrasound. Reactive Polymers. 1995;25:157–166. [Google Scholar]
- Yu L, Mishra DS, Rigsbee DR. Determination of the glass properties of D-mannitol using sorbitol as an impurity. J. Pharm. Sci. 1998;87:774–777. doi: 10.1021/js970224o. [DOI] [PubMed] [Google Scholar]


