

Abstract
Researchers collaborate on scientific projects that are often measured by both the quantity and the quality of the resultant peer-reviewed publications. However, not all collaborators contribute to these publications equally, making metrics such as the total number of publications and the H-index insufficient measurements of individual scientific impact. To remedy this, we use an axiomatic approach to assign relative credits to the coauthors of a given paper, referred to as the A-index for its axiomatic foundation. In this paper, we use the A-index to compute the weighted sums of peer-reviewed publications and journal impact factors, denoted as the C- and P-indexes for collaboration and productivity, respectively. We perform an in-depth analysis of bibliometric data for 186 biomedical engineering faculty members and from extensive simulation. It is found that these axiomatically weighted indexes better capture a researcher’s scientific caliber than do the total number of publications and the H-index, allowing for fairer and sharper evaluation of researchers with diverse collaborative behaviors.
Collaboration among researchers is on the rise (1), reflecting the increased complexity of interdisciplinary research and improving the quantity and quality of the resultant publications. The more researchers involved in a project, the more complicated it is to quantify their individual contributions. It becomes desirable and necessary to account for the bias of the established metrics such as the H-index (2, 3) that ignore collaboration or assume equal contribution of each coauthor. In his foundational paper (2), Hirsch remarks that the H-index is best used when comparing researchers with a similar scientific age, and highly collaborative researchers may have an inflated H-index. He suggests normalizing the H-index on the basis of the average number of coauthors, but this fails to take into account their relative contributions.
A collaboration effect on scientific output has been investigated (4–8), and techniques have been proposed to measure credit shares but they frequently rely on subjective assumptions such as inflated or fractional counting methods (9, 10). The method proposed in (8) always assigns full credit share to the first and corresponding authors. This ignores that the first author of a paper with few coauthors likely contributed much more than the first author of a paper with many coauthors. Most importantly, these methods fail to acknowledge the stochastic behavior of a coauthor’s contribution. For example, two first authors of different papers with the same number of coauthors may have very different contributions because of many factors. Without a specific credit share provided by the coauthors themselves, our goal is to derive a credit share system from minimal assumptions.
In this paper, we propose some axioms that allow us to view relative credit shares among coauthors as random vectors from a uniform distribution under two constraints. Because true credit shares are unreported in publications, we predict them using the expected random vector from the derived distribution. For a researcher and an associated publication, we denote his/her corresponding component in the expected credit vector as his/her A-index (11). We then use the A-index to produce weighted sums of publications and journal impact factors (JIFs), henceforth referred to as the collaboration and productivity indexes (C- and P-indexes) respectively. Recently, metrics based on the A-index were successfully applied (12) to revisit a high-profile study by Ginther et al. (13, 14) in which the probability of receiving a US National Institutes of Health (NIH) R01 award was analyzed with respect to the applicants’ race/ethnicity. This paper details the methodology of these A-index–based metrics and demonstrates their superior ability to identify quality researchers compared with conventional measures, including the popular H-index.
Measures of Scientific Impact
A researcher’s N-index is defined as his/her total number of publications. Although it is easy to calculate, the N-index completely ignores the scientific impact of each paper and implicitly assumes all coauthors are equally important. The H-index is an established bibliometric that takes into account the scientific impact via the number of citations. A researcher has an H-index value h if h of his/her papers have at least h citations each and their other papers are less frequently cited. Although generally more informative than the N-index, there are many situations where the H-index inadequately summarizes a researcher’s qualification. For example, suppose two researchers have two publications each but the publications for one researcher have 100 citations each whereas the others have only 2 citations. Unfortunately, both researchers receive an H-index of 2. This example points out that the H-index performs poorly for young academics with few publications, which has been well documented (15).
Assume a given publication has n coauthors who can be divided into  groups. Let
  denote the number of coauthors in the ith group and assume that each of the
  coauthors in the group have the same credit. Define the credit vector to be
  , where
  is the credit assigned to each of the
  members in group i and
  denotes the transpose of
  . The A-index is derived from the following three axioms:
Axiom 1. Ranking Preference.
Elements of
 satisfy
 .
.
Axiom 2. Credit Normalization.
The sum
 , where
 .
.
Axiom 3. Maximum Entropy.
The credit vector
 is uniformly distributed in the domain defined by Axioms 1 and 2.
It follows that the fairest estimation of credit assignment for a coauthor in group i is the expectation with respect to all permissible credit vectors. In Formulation and Simulation of Scientific Impact, this expectation is shown to be
 |
which we define as the A-index for the authors in group i. If no coauthors claim equal contribution, then  ,
,  , and
, and
 |
One appealing feature of the A-index is the rigorous framework, which is lacking in all other coauthor credit metrics. The A-index is also more flexible than other metrics because it allows multiple coauthors in a given rank. Axiom 1 is the basis for all coauthor metrics but the current lack of a universally accepted coauthor ranking system compromises their power. Adoption of a ranking system would also benefit the collaboration process because it would encourage collaborators to clarify individual expectations.
Axiom 2 is also typically assumed for most coauthor metrics, ensuring that the A-index measures relative contribution. Clearly, a researcher achieves an A-index of 1 if and only if he/she is the sole author of the publication, which differs from inflated methods such as those in (8).
The motivation for Axiom 3 requires more discussion. Of course, to derive an expected credit share we must assume  comes from some probability distribution. Axiom 3 essentially postulates every scenario is equally possible between a coauthor doing his/her very best or the bare minimum. For instance, the consensus is the first-ranked group is the most important to the publication, but the actual relative importance can vary from paper to paper. A uniform distribution under the constraints set by Axioms 1 and 2 has been chosen due to the lack of prior information of relative credit and is consistent with the maximum entropy principle (16). However, we could modify Axiom 3 if there were information suggesting the uniform distribution was inappropriate.
To demonstrate the versatility of the A-index, we look at common collaboration scenarios and the resulting A-indexes. Let n denote the total number of coauthors. If every coauthor assumes equal contribution, then  for every coauthor. This scenario is more likely when there are few coauthors, say two or three. At the other end of the spectrum, we assume unequal credit for all coauthors and calculate the A-indexes using [1]. Table 1 compares these two scenarios for up to six coauthors. By including additional coauthors, credit is transferred from the higher-ranked authors and distributed among the lower-ranked authors. Of the cases considered, the first author receives approximately twice as much credit as any other coauthor, but his/her individual credit dips below 0.5 when there are five or more coauthors. This is a more realistic assignment than metrics that assign nearly full credit to the highest-ranked authors regardless of the total number of coauthors.
Table 1.
A-index for equal/unequal contributions
| No. coauthors | Equal A |  |
 |
 |
 |
 |
 |
| 1 | 1.000 | 1.000 | |||||
| 2 | 0.500 | 0.750 | 0.250 | ||||
| 3 | 0.333 | 0.611 | 0.278 | 0.111 | |||
| 4 | 0.250 | 0.521 | 0.271 | 0.146 | 0.063 | ||
| 5 | 0.200 | 0.457 | 0.257 | 0.157 | 0.090 | 0.040 | |
| 6 | 0.167 | 0.408 | 0.242 | 0.158 | 0.103 | 0.061 | 0.028 |
Assigning unequal contributions to all coauthors is an interesting task, especially when there are many coauthors. Table 2 demonstrates the behavior of the A-index with and without equal contribution groups in the case of this paper. Two coauthors were assigned rank 1 and three were assigned rank 2. For comparison we provide the credit shares from the fractional, the harmonic, and Zhang’s (8) methods. There is a strong similarity between the unequal  (assuming
  ) and the harmonic credit assignment. Zhang’s method also has similar scoring for the coauthors in rank 2 or higher, but it assigns full credit to the first and the corresponding author.
Table 2.
Ranking groups and A-indexes for this publication
| Coauthor | Rank |  |
Unequal 
|
Fractional | Harmonic | Zhang (8) |
| J.S. | 1 | 0.208 | 0.314 | 1.000 | 0.353 | 1.000 |
| G.W. | 1 | 0.208 | 0.203 | 0.500 | 0.177 | 1.000 |
| E.V. | 2 | 0.124 | 0.148 | 0.333 | 0.118 | 0.229 |
| J.Y. | 2 | 0.124 | 0.111 | 0.250 | 0.088 | 0.200 |
| M.W.V. | 2 | 0.124 | 0.083 | 0.200 | 0.071 | 0.171 |
| J.L. | 3 | 0.091 | 0.061 | 0.167 | 0.059 | 0.143 |
| L.P. | 4 | 0.063 | 0.042 | 0.143 | 0.050 | 0.114 |
| L.D. | 5 | 0.039 | 0.026 | 0.125 | 0.044 | 0.086 |
| I.Y. | 6 | 0.019 | 0.012 | 0.111 | 0.039 | 0.057 |
The A-index is a single-paper metric and bounded above by 1 (sole authorship). Hence, the sum of A-indexes for a particular researcher is then a weighted count of publications. We call this the C-index, which is clearly bounded above by the N-index. We also consider a weighted sum of the corresponding JIFs, on the basis of the idea that the JIF is the expected number of citations for a given publication. Weighting the JIF by the corresponding A-index meaningfully describes the expected scientific impact of the researcher in terms of his/her share of expected citations. We call this the productivity index, or P-index. Formally, let a researcher have K publications, with corresponding A-index  , where the kth paper came from a journal with an impact factor
  . Then, we define the researcher’s P-index as
 |
We acknowledge that the JIF can inaccurately measure a specific impact of a paper (17), but we can use the A-index to weight any other scientific impact metric, such as the actual number of citations of the publication. We used the JIF to calculate the P-index for this study because our data are from recent publications, and generally citations take time to accumulate.
Data and Analysis Methods
The primary goal of this analysis was to show that for interdisciplinary researchers, traditional bibliometrics used to measure individual scientific output, like the H- and N-indexes, although informative, may be biased because they assume equal contribution among the coauthors and ignore the number of coauthors. We focused on biomedical engineering (BME) researchers because it is an interdisciplinary field and we anticipated observing a wide range of collaborative tendencies. The analysis compared these two traditional metrics to the C- and P-indexes, demonstrating that accounting for collaboration can change the estimated individual scientific impact. We first describe the sampling procedure and its potential biases and then discuss the analysis methods.
Researchers were randomly selected from 10 BME departments of the top 50 in the 2011 US News rankings of BME departments (18). The 10 departments covered the entire rank range (Table 3). For each department we sampled 50% of their assistant, associate, and full professors as designated on the department’s webpage of core faculty. For each faculty member in the stratified sample, we identified every publication indexed in the Web of Science (19) for 2006–2010, using an advanced search that included both the researcher’s name and the department to ensure correct identification. We calculated the H-index for each researcher on the basis of his/her 2006–2010 publications, as it is intended to be calculated over longer periods of time (15). To calculate the A-index we collected detailed paper information only for papers in 2010. If we could not obtain an electronic copy of a paper, we assumed that the first author was the primary author and the last author was the corresponding author, which is common in the BME field. We searched for a total of 186 researchers; 38 searches returned no 2010 publications indexed in the Web of Science. Analysis included only those researchers with at least one publication; the total number of faculty sampled and those with at least one publication are provided in Table 3. Overall, 39 assistant professors, 41 associate professors, and 68 full professors were included in the analysis.
Table 3.
BME departments sampled and corresponding 2011 US News rankings
| School or university | US News rank | Faculty sampled | Included in analysis |
| Johns Hopkins University | 1 | 19 | 15 |
| Duke University | 4 | 18 | 15 |
| Stanford University | 8 | 15 | 12 |
| Northwestern University | 15 | 24 | 22 |
| Cornell University | 20 | 20 | 18 |
| California Institute of Technology | 23 | 12 | 9 |
| Carnegie Mellon University | 29 | 23 | 19 |
| Texas A&M University | 35 | 19 | 16 |
| Drexel University | 43 | 15 | 11 |
| Virginia Polytechnic Institute and State University | 47 | 21 | 11 |
| Total | 186 | 148 |
The data contained minor bias, primarily due to restricting the search to papers that reference a researcher’s current BME department. However, doing this significantly reduced the possibility of overcounting papers. Clearly, publications from researchers not associated with their current universities were ignored as were publications that did not reference their specific BME departments. For Virginia Polytechnic Institute and State University professors, we searched for “Blacksburg, VA” because of the multiple names associated with the university. Professors from other universities were searched by the name of the school alone. As a reasonable approximation for this study, we assumed an implicit ranking system where authors other than those indicated to be cofirst or corresponding authors were listed by their ranks. For example, suppose there were five coauthors on a paper: A, B, C, D, and E. If A and B were cofirst authors and E was the corresponding author, then A and B were ranked as 1, E was 1, C was 2, and D was 3.
Concerning the generality of conclusions, another potential source of bias is differences in departments. Whereas all of the departments are in top universities, each has its own expectations and tendencies in terms of collaboration and publications. For example, although we sampled BME professors from Virginia Tech, their department is actually named the Virginia Tech–Wake Forest University School of Biomedical Engineering and Sciences. Because their department is so large, we might expect to see more collaboration among these researchers. Of the 21 sampled Virginia Tech professors, only 11 had a 2010 publication, whereas all other sampled universities retained approximately  of their researchers for the analysis. This may have been caused by the more specific search criteria for Virginia Tech professors mentioned previously. To assess the sensitivity of our results to the peculiarities of the 10 departments we randomly sampled, we repeated our analyses 10 times, once with each of the departments’ faculty removed from the sample.
The first stage of the analysis compared the C- and P-indexes to the N- and H-indexes, because the latter metrics are widely used but do not account for collaboration. We paid close attention to the relationship between the C-index and the N-index because any discrepancy between the two metrics is directly attributable to collaboration. Researchers were split into two classes on the basis of the P-index and we compared their different collaborative behaviors, as well as their H-indexes. We used bivariate scatterplots and Kendall’s  correlation coefficients to assess the level of association between the metrics. To assess the sensitivity of the results to the particular researchers in our sample, we repeated the analysis on the basis of random draws with replacement of 50% and 200% of the researchers in the original sample. The two researchers with the highest P-indexes were highlighted. Then, we discussed their different collaborative behaviors. To further understand different situations that may lead to a high P-index, we conducted a simulation study that created 16 different types of virtual researchers based on four categories.
Results and Discussion
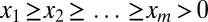
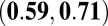
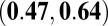
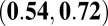
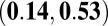
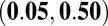
The scatterplot matrix of the four metrics (Fig. 1) shows a fairly positive relationship present in all pairings, with lower values having a stronger linear relationship than higher values. For example, the correlation between the C-index and the N-index appeared stronger for N-index  5 whereas the variability of the C-index was much higher for larger N-index values. Perhaps it is not until some threshold value is reached that the differences in collaboration behaviors take effect. This phenomenon was most easily seen in the P-index scatterplots. Hence, we split researchers into two groups on the basis of their observed P-index values. For the 148 researchers with at least one publication, the median and mean P-indexes were 2.60 and 5.67, respectively. Therefore, the researchers with P-index
  were classified as “normal” researchers; otherwise they were classified as “high-impact” researchers. The cutoff value was a compromise between the median and the mean, as the distribution for the P-index was right skewed and we did not want to classify 50% of the researchers as high impact. Of the 148 researchers, 100 (68%) were normal researchers, and 48 (32%) were high-impact researchers, giving a good size for both groups. A correlation analysis focused on Kendall’s
  correlations because it is a better measure of association for nonlinear data and when many ties are present, which is the case for the N- and H-indexes. Table 4 contains the overall estimated Kendall’s and Pearson’s correlations of the metrics, as well as those for the two performance groups. It also provides
  confidence intervals that were calculated from a bootstrap resampling procedure.
Fig. 1.

Scatterplot matrix of metrics.
Table 4.
Kendall’s  and Pearson’s correlations for metrics (researchers with at least one 2010 publication)
| Researcher category | Index | P-index | C-index | H-index |
| Overall | ||||

|
C-index | 0.70* (0.63, 0.75)† | — | — |
0.64 
|
— | — | ||
| H-index |
0.42

|
0.37
|
— | |
0.65 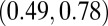
|
0.55 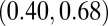
|
— | ||
| N-index |
0.59
|
0.65
|
0.56
|
|
0.65 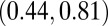
|
0.77 
|
0.79 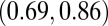
|
||
| Normal researcher | ||||

|
C-index |
0.64
|
— | — |
0.77 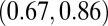
|
— | — | ||
| H-index |
0.29
|
0.23
|
— | |
0.38 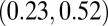
|
0.28 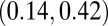
|
— | ||
| N-index |
0.50
|
0.56

|
0.48
|
|
0.61 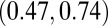
|
0.70 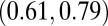
|
0.60 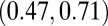
|
||
| High-impact researcher | ||||

|
C-index |
0.30
|
— | — |
0.32 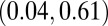
|
— | — | ||
| H-index |
0.34
|
0.26
|
— | |
0.55 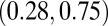
|
0.32 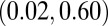
|
— | ||
| N-index |
0.28
|
0.50
|
0.52
|
|
0.46 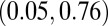
|
0.59 
|
0.77 
|
Values in boldface type indicate Kendall’s  correlations.
Ninety-five percent confidence intervals based on  bootstrap samples.
The overall N- and H-indexes had a moderate Kendall’s  of 0.56, meaning that larger 2010 N-indexes are typically associated with larger 5-y H-indexes. This was expected because researchers who publish frequently have a greater chance of publishing an article with a high number of citations. When we focused only on researchers with an N-index between 3 and 7, we saw a wider range of H-indexes between 1 and 12 with
  , which had a
  confidence interval of
  . Hence, it appears that large N-indexes were associated with large H-indexes, but there was less correlation with the H-index among researchers with a smaller 2010 N-index.
The correlation between C- and N-indexes was relatively strong with a  of 0.65. As seen in Fig. 1 the disparity between the two metrics grew as the N-index increased. This was also expected because the N-index is the upper bound of the C-index, and regardless of a researcher’s A-index for a paper, the C-index will increase when a publication is added. There were clear cases where the N-index misrepresented the scientific output of a researcher because it failed to acknowledge relative contributions. For example, one researcher had 21 publications but a C-index of only 2.06. One should not assess a researcher’s collaborative behavior through the C-index alone, but rather alongside his/her N-index.
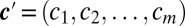
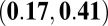
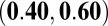
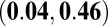
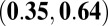
The P-index correlations for all researchers were moderate to high. Kendall’s correlation between the P- and H-indexes was 0.42 but was higher for the C- and N-indexes: 0.70 and 0.59, respectively. The high correlation with the C-index was not surprising because the A-index was used to calculate both metrics, but there are clear cases that do not follow the trend. Differences between the P- and C-indexes at larger values of the P-index were explained by the skewed distribution of the average JIF (Fig. 2). Based on [2], the P-index will be similar to the N-index when JIFs are relatively small (approximately 5). It is when we observe larger JIFs that the P-index begins to differentiate from the other metrics. This further motivated our investigation of the two subgroups of normal and high-impact researchers.
Fig. 2.

Average JIF histogram.
For the two researcher performance groups, we saw some interesting changes in the relationship between metrics. Recall that the two groups were split on the basis of the 2010 P-index, where the high-impact group had a P-index of 5 or higher. Monte Carlo permutation tests based on  permutations were used to assess the significance of the Kendall’s correlation differences (20). These tests required minimal assumptions about the data, and their type I error rates were closer to the significance level than tests based on incorrect assumptions (such as normality or constant variance), which are more likely to falsely reject. However, these tests are known to be less powerful in detecting differences because of the minimal distribution assumptions. Because of the lower power and small amount of data, we chose
  .
.
Table 5 contains the P values for the observed differences in Kendall’s correlations between the normal and high-impact researcher groups. Two significant differences at  were observed between the P- and C-indexes and the P- and N-indexes. Kendall’s correlation for the P- and C-indexes was 0.64 for the normal researcher group vs. 0.30 for the high-impact group. For the P- and N-indexes, Kendall’s correlation was 0.50 for the normal researchers and 0.28 for the high-impact researchers. Note that Eq. 2 allows the P-index to be very sensitive to large JIFs, which tend to be strong indicators of scientific impact. To explain the differences, we investigated the distributions of the average JIFs for researchers in the two groups. Both distributions were right skewed, and the median average JIF for the normal researchers was 3.11 compared with 5.98 for high-impact researchers. Moreover, the standard deviations (SDs) were 1.87 and 5.94 for normal and high-impact researchers, respectively. This suggested that the P-indexes for high-impact researchers varied differently because their JIFs tended to be higher and have more variance, and their P-indexes relied more on the JIF than on the number of publications.
Table 5.
Monte Carlo permutation test P values for correlation differences
| Index | P-index | C-index | H-index |
| C-index |  |
— | — |
| H-index | 0.676 | 0.793 | — |
| N-index | 0.004 | 0.392 | 0.649 |
The correlation between the P- and H-indexes for the two groups, although not significantly different, also deserves discussion. Recall that the P-index considered only 2010 publications, whereas the H-index was calculated from 2006 to 2010. For both groups, the correlation is quite low (0.29 for normal researchers and 0.34 for high-impact researchers), and both estimates have relatively wide  confidence intervals. H-indexes for the normal researchers ranged between 0 and 16 with a median of 5, whereas for the high-impact researchers it ranged between 2 and 29 with a median of 10. This suggests that the researchers with a high H-index can have off years, and those with a high P-index tend to have a high H-index. Recall that the H-index is based on citations, and the P-index is based on the JIF or expected citations. It appears that researchers with a high P-index for a given year are likely to have a higher career H-index. The P-index is useful when comparing young researchers whose publications need time to accumulate citations.
Minimal changes in the correlation analysis were observed after removing specific universities, and all estimates were well within the 95% confidence intervals for all of the data. This was expected because Kendall’s  is nonparametric and fairly robust to outliers. One example of the largest change occurred when Northwestern University was removed. This university had 22 total researchers included in the analysis, 19 of which were classified as normal researchers. After removing these researchers, the overall Kendall’s
  between the P- and H-indexes increased to 0.47, as did the P- and C-index correlation to 0.42. However, the correlations for the normal researcher group hardly changed, even though we removed nearly 20% of them. The most notable change in the analysis occurred when Duke University researchers were removed (10 normal and 5 high-impact researchers). The C- and N-index correlation for the normal research group increased slightly to 0.58 with a 95% confidence interval of
  , and for the high-impact group it decreased to 0.45 with confidence interval
  . The permutation test concluded that these two correlations were significantly different (
 ). This happened mostly due to two high-impact Duke researchers that had very high N- and C-indexes. We also resampled 50% and 200% of the original researchers
  times and found that the mean of these iterations gave nearly identical results to those of the original estimates.
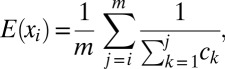
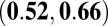
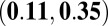
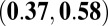
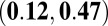
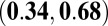
The collaborative tendencies of the two groups of researchers were also investigated by plotting the average A-index vs. the N-index by researcher group (Fig. 3). Average A-index may be interpreted as typical involvement in a publication. An overall decreasing trend was observed, which suggests that researchers with many publications tend to collaborate more and are less involved in their projects. When looking at those researchers with an N-index between 2 and 10, high-impact researchers typically had higher average A-indexes than normal researchers. If high-impact researchers were not involved in many projects, they were more important to the publication than a normal researcher would be. Therefore, their scientific impact should be higher. Note that the P-index will always increase with more publications and more rapidly when papers are published in journals with higher JIFs. This is one of the best features of the P-index: Large values can be achieved by publishing many, moderately important papers or a few impactful papers. Hence, the P-index does a remarkable job of balancing quantity and quality and is forgiving of either “overcollaboration” or infrequent publications as long as the research is published in highly cited journals.
Fig. 3.

Average A-index vs. N-index.
To demonstrate how a high P-index can be achieved in different ways, we looked at the two researchers with the highest P-indexes (Table 6), who were an associate professor and a full professor from two different universities. The largest overall N-index belonged to the associate professor, but the C-index was not large, due to the fact that the associate professor was a corresponding author on 8 of the 21 publications and the majority of the papers had seven or more coauthors. Moreover, the papers had multiple cofirst and/or cocorresponding authors. On the other hand, the full professor had 4 publications with few coauthors and was either a cofirst or the corresponding author on three of them. Clearly, these are two different types of researchers in terms of collaboration preferences, but they had high and nearly identical P-indexes. Accounting for collaboration significantly reduced the JIF sum for the associate professor and more accurately represented the individual scientific impact. The full professor was much more involved in projects and so received the majority share of the JIFs. On the other hand, the N- and H-indexes gave very different, misleading comparisons of these two researchers, whereas the P-index concluded that they had nearly identical scientific impact in 2010. We believe that the P-index gave a fairer and sharper comparison of the two researchers and was able to do so only by taking into account collaboration credit via the A-index.
Table 6.
Metrics for top two researchers
| Bibliometric | Associate professor | Full professor |
| P-index | 48.23 | 48.49 |
| C-index | 2.06 | 1.36 |
| N-index | 21.00 | 4.00 |
| H-index | 29.00 | 12.00 |
| JIF sum | 453.00 | 140.00 |
| Median no. coauthors | 9.00 | 3.50 |
The simulation study generated publication data for 16 different types of virtual researchers based on four different publishing characteristics: number of publications, JIFs, number of coauthors, and rank. Each category had a high and low distribution associated with it. Details of the simulation design are in Formulation and Simulation of Scientific Impact. Not surprisingly, the virtual researchers that published frequently in journals with high JIFs had the highest P-index on average. The virtual researchers that published frequently in low-impact journals, but had few coauthors and were high ranked, had the fourth highest mean P-index. The P-index is easily increased by the JIF, but we see here that a researcher could have high impact as long as he/she can be prolific with a small group of peers.
Conclusion
This paper provides strong evidence that evaluating researchers on the basis of metrics like the total number of publications and the H-index can be misleading and that fairer evaluations of a researcher’s individual scientific impact can be made by taking into account collaborative tendencies. Data collected and analyzed from prestigious BME departments indicate that the P-index may better classify researchers’ scientific output by simultaneously considering both the importance of the paper on its scientific community (via the JIF) and the relative contributions of its coauthors via the A-index. Exemplary cases were identified where neglecting coauthor information inhibited the ability to distinguish one researcher’s achievements from others and gave some researchers undue credit. The strength of the P-index lies in its ability to compare researchers with different collaborative tendencies, using the A-index to balance quantity and quality of research. The P-index would be very useful for young researchers, whose career H-index would be based on a short time frame. Using the A-index to weight other metrics of scientific impact should also be investigated. For example, a weighted H-index seems attractive (8).
We anticipate that the axiomatic approach of credit assignment will become a main tool in development of academic assessment or peer review systems (15). Its most appealing feature is the rigorous foundation including the distribution assumption (Axiom 3) for the credit vector, which gives a fair and balanced estimate for the true collaboration credit. We acknowledge other metrics exist that attempt to measure collaboration credit, but believe that the theoretical justification of the A-index results in a convincing assessment of a researcher’s involvement in a publication. However, a main criticism of all collaboration metrics is the lack of a well-defined system of coauthorship ranking. One must be adopted to maximize the potential of the A- and P-indexes. Such a system would better define expectations of the collaborators and improve awareness of assigned credit, leading to a more efficient collaborative experience.
Supplementary Material
Acknowledgments
We thank Jie Tian and Pengju Yin for technical assistance in calculating the A-index. We also thank Kelly Geyer, Xiaoli Hou, Caleb King, and Stephen Loftus of the Laboratory for Interdisciplinary Statistical Analysis at Virginia Polytechnic Institute and State University for data collection.
Footnotes
The authors declare no conflict of interest.
This article is a PNAS Direct Submission.
This article contains supporting information online at www.pnas.org/lookup/suppl/doi:10.1073/pnas.1220184110/-/DCSupplemental.
References
- 1.Greene M. The demise of the lone author. Nature. 2007;450(7173):1165. doi: 10.1038/4501165a. [DOI] [PubMed] [Google Scholar]
- 2.Hirsch JE. An index to quantify an individual’s scientific research output. Proc Natl Acad Sci USA. 2005;102(46):16569–16572. doi: 10.1073/pnas.0507655102. [DOI] [PMC free article] [PubMed] [Google Scholar]
- 3.Hirsch JE. Does the H index have predictive power? Proc Natl Acad Sci USA. 2007;104(49):19193–19198. doi: 10.1073/pnas.0707962104. [DOI] [PMC free article] [PubMed] [Google Scholar]
- 4.Foulkes W, Neylon N. Redefining authorship. Relative contribution should be given after each author’s name. BMJ. 1996;312(7043):1423. doi: 10.1136/bmj.312.7043.1423e. [DOI] [PMC free article] [PubMed] [Google Scholar]
- 5.Campbell P. Policy on papers’ contributors. Nature. 1999;399(6735):393. doi: 10.1038/20743. [DOI] [PubMed] [Google Scholar]
- 6.Anonymous Who is accountable? Nature. 2007;450(7166):1. doi: 10.1038/450001a. [DOI] [PubMed] [Google Scholar]
- 7.Ball P. A longer paper gathers more citations. Nature. 2008;455(7211):274–275. doi: 10.1038/455274a. [DOI] [PubMed] [Google Scholar]
- 8.Zhang CT. A proposal for calculating weighted citations based on author rank. EMBO Rep. 2009;10(5):416–417. doi: 10.1038/embor.2009.74. [DOI] [PMC free article] [PubMed] [Google Scholar]
- 9.Tscharntke T, Hochberg ME, Rand TA, Resh VH, Krauss J. Author sequence and credit for contributions in multiauthored publications. PLoS Biol. 2007;5(1):e18. doi: 10.1371/journal.pbio.0050018. [DOI] [PMC free article] [PubMed] [Google Scholar]
- 10.Hagen NT. Harmonic allocation of authorship credit: Source-level correction of bibliometric bias assures accurate publication and citation analysis. PLoS ONE. 2008;3(12):e4021. doi: 10.1371/journal.pone.0004021. [DOI] [PMC free article] [PubMed] [Google Scholar]
- 11. Wang G, Yang J (2010) Axiomatic quantification of co-authors? Relative contributions. arXiv:1003.3362v1 [stat.AP]
- 12.Yang J, et al. A bibliometric analysis of academic publication and NIH funding. J Informatrics. 2013;7:318–324. [Google Scholar]
- 13.Ginther DK, et al. 2011. Race disparity in grants: Empirical solutions vital response. Science 334(6058):U154–U899.
- 14.Ginther DK, et al. Race, ethnicity, and NIH research awards. Science. 2011;333(6045):1015–1019. doi: 10.1126/science.1196783. [DOI] [PMC free article] [PubMed] [Google Scholar]
- 15.Bornmann L, Daniel HD. The state of h index research. Is the h index the ideal way to measure research performance? EMBO Rep. 2009;10(1):2–6. doi: 10.1038/embor.2008.233. [DOI] [PMC free article] [PubMed] [Google Scholar]
- 16.Jaynes ET. On the rationale of maximum-entropy methods. Proc IEEE. 1982;70(9):939–952. [Google Scholar]
- 17.Seglan PO. 1997. Why the impact factor of journals should not be used for evaluating research. BMJ 314(7079):498–502.
- 18. University Report (2011) US Biomedical/Bio-Engineering Ranking. Available at http://universityreport.net/us-biomedical-bio-engineering-ranking-2011. Accessed November 19, 2012.
- 19.Jacsó P. The pros and cons of computing the h-index using Web of Science. Online Inf Rev. 2008;32(5):673–688. [Google Scholar]
- 20.Ernst MD. Permutation methods: A basis for exact inference. Stat Sci. 2004;19:676–685. [Google Scholar]
Associated Data
This section collects any data citations, data availability statements, or supplementary materials included in this article.