

Abstract
Androgens regulate both the physiological development of the prostate and the pathology of prostatic diseases. However, the mechanisms by which androgens exert their regulatory activities on these processes are poorly understood. In this study, we have determined that androgens regulate overall cell metabolism and cell growth, in part, by increasing autophagy in prostate cancer cells. Importantly, inhibition of autophagy using either pharmacological or molecular inhibitors significantly abrogated androgen-induced prostate cancer cell growth. Mechanistically, androgen-mediated autophagy appears to promote cell growth by augmenting intracellular lipid accumulation, an effect previously demonstrated to be necessary for prostate cancer cell growth. Further, autophagy and subsequent cell growth is potentiated, in part, by androgen-mediated increases in reactive oxygen species. These findings demonstrate a role for increased fat metabolism and autophagy in prostatic neoplasias and highlight the potential of targeting underexplored metabolic pathways for the development of novel therapeutics.
Both the basic physiology of the prostate and the development of diseases such as benign prostatic hyperplasia and prostate cancer are influenced by androgens (1). Androgens are steroid hormones that function by binding to and activating their target protein, the androgen receptor (AR). Ligand-mediated activation of AR controls the expression of a large number of genes, which together enable the same AR-ligand complex to exert regulatory activities over a wide range of cellular processes (2). Although AR and androgens are involved in the development and functioning of the normal prostate and are causally involved in prostate cancer progression, the pathways responsible for these activities remain to be determined.
Macroautophagy, herein referred to as autophagy, is a cellular process, which occurs in all eukaryotic cells and has been linked to numerous pathologies, including infections, neurodegeneration, cancer, and aging (3, 4). Autophagy is a process that involves the de novo formation of a limiting membrane, called an autophagosome, around cytosolic components destined for degradation. Degradation occurs when the autophagosome fuses with a lysosome to create an autophagolysosome or autolysosome. Subsequently, the contents of the autolysosome are degraded by numerous acidic lysosomal hydrolases. In addition to removing damaged organelles and proteins, this process can also facilitate the cellular remodeling that is necessary for cells to carry out specialized functions (5, 6).
While autophagy is commonly thought of as a catabolic process that is activated either during times of starvation or upon elevation of misfolded proteins, it is clear that autophagy is also required for both normal and, more recently, tumorigenic processes that require anabolic activities (5–9). Initially, autophagy was thought to function solely as a tumor suppressor largely because of data indicating that the genetic deletion of Beclin1, a component of the autophagic machinery, increases the incidence of lung cancers, hepatocellular carcinomas, and lymphomas (10, 11). Further, the commonly mutated tumor suppressors p53 and PTEN have both been demonstrated to activate autophagy (12, 13). Conversely, it has recently been demonstrated using both pharmacological and molecular inhibition that autophagy is required for the growth and viability of multiple types of cancers, including breast, pancreatic, colon, ovarian, cervical, brain, lung, skin, and lymphomas (14–27). For example, chloroquine, an inhibitor of autophagic flux, decreased tumor formation in both xenograft and transgenic mouse models of pancreatic cancer (26). Additionally, genetic deletion of either atg5 or atg7, core components of the autophagic machinery, suppressed the growth of Ras-driven tumors (17). Thus, depending on the circumstances, autophagy may function either as a tumor suppressor or a tumor promoter. As a result, our understanding of whether to target autophagy for therapeutic purposes, and if so how, is limited.
It is currently unclear how exactly autophagy could promote cancer. The prevailing thought is that autophagy induces a dormant state similar to that of a stem cell (7, 8, 28). This state enables a level of independence that makes the cell resistant to outside insults, such as hypoxia or even chemotherapeutic drugs. Alternatively, autophagy may take on a more active role in cell growth. Since its initial discovery in the 1960s, the major focus of studies on autophagy has been on its role in protein and organelle turnover. However, several groups have recently demonstrated a role for autophagy in differentiation and corresponding anabolic processes, such as skeletal muscle growth and lipogenesis (29–35). Interestingly, altered lipid metabolism has been demonstrated by multiple groups to play an important role in prostate cancer (36–40). Fatty acid synthase (FAS), a rate-limiting enzyme in de novo lipogenesis, is frequently overexpressed in prostate cancers (41–44). Correspondingly, pharmacological or molecular inhibition of either FAS or other lipogenic enzymes like acetyl-coenzyme A (CoA) carboxylase (ACC) and ATP citrate lyase (ACL) suppresses both in vitro and in vivo tumor growth (45, 46). Although androgens promote prostate cancer cell growth in part by increasing the expression of several of these lipogenic enzymes (36, 47, 48), it is not known whether androgens may promote the formation of these lipid reservoirs by additional mechanisms that may therefore also be critical for AR-mediated tumorigenesis. The goal of this study was to determine whether autophagy has a role in AR-mediated prostate cancer cell growth and, if so, mechanistically how this occurs. By identifying novel processes that modulate prostate cancer cell growth, we hoped to discover new targets that could be exploited with future therapeutics.
Materials and Methods
Reagents
Fetal bovine serum (FBS), l-glutamine, RPMI 1640 medium, DMEM, and chloromethyl-2′,7′-dichlorodihydrofluorescein diacetate (CM-H2DCFDA) were obtained from Life Technologies (Carlsbad, CA). Charcoal-stripped FBS (CS-FBS) was purchased from HyClone (Logan, UT). Polyclonal antibodies recognizing p27 Kip1, p15 INK4B, long-chain acyl-CoA synthetase, ACL, lipin1, microtubule-associated light chain 3 β I/II (LC3BI/II), FAS, and monoclonal antibodies recognizing cyclin D1, cyclin D3, p21 Waf1/Cip1, CDK4, p18 INK4C, acetyl-CoA synthetase, and ACC were from Cell Signaling (Danvers, MA). Antiglyceraldehyde-3-phosphate dehydrogenase (GAPDH) antibody, N-acetyl cysteine, 4-hydroxy-2,2,6,6-tetramethylpiperidine-N-oxyl (TEMPOL), doxycycline (Dox), chloroquine, 3-methyladenine (3-MA), bafilomycin A1, pepstatin A, and (2S,3S)-trans-epoxysuccinyl-l-leucylamido-3-methylbutane ethyl ester (E-64-d) were from Sigma (St. Louis, MO). Dihydrotestosterone (DHT) and methyltrienolone (R1881) were purchased from Steraloids (Newport, RI) and PerkinElmer (Waltham, MA), respectively.
Cell culture and plasmid transfection
Androgen-sensitive LNCaP, VCaP, CWR22, and 22Rv1 human prostate cancer cell lines were obtained from American Type Culture Collection (Manassas, VA) and maintained as recommended. Androgen-sensitive LAPC4 cells were a gift from Charles L. Sawyers (Memorial Sloan-Kettering Cancer Center, New York, NY) and maintained as previously described (49). All experiments were carried out with cells of passage less than 25. All cells were authenticated by morphological inspection and mycoplasma testing. Their response to androgens was authenticated using growth and reporter gene assays. Unless otherwise noted, for all experiments, cells were steroid starved for 72 h in steroid-reduced medium, that is, phenol red-free medium containing 8% CS-FBS (15% CS-FBS for LAPC4 cells). For transfections, cells were transfected with the mCherry-green fluorescent protein (GFP)-LC3 construct (50) using Lipofectamine 2000 (Life Technologies) according to the manufacturer's instructions.
Cell proliferation assay
Cell proliferation assays were carried out as previously described (49) by measuring the cellular DNA content using a FluoReporter Blue fluorometric double-stranded DNA Quantitation kit (Life Technologies) following the manufacturer's protocol.
Cell viability assay
Cell viability assays were carried out as previously described (51) using a CellTiter-Blue Cell Viability Assay (Promega, Madison, WI) following the manufacturer's protocol.
Small interfering RNA (siRNA) transfection of human prostate cells
Stealth siRNA (Life Technologies) transfections were carried out as previously described (52). The sequences of all siRNAs used in this study are listed in Supplemental Table 1, published on The Endocrine Society's Journals Online web site at http://mend.endojournals.org.
Western blot analysis
Western blottings were conducted as previously described (53). Densitometry was performed in Figure 2 using ImageJ software (National Institutes of Health, Bethesda, MD). Here, LC3BII levels (functional readout of levels of autophagy) were normalized to GAPDH (loading control) and not LC3BI, because the low immunoreactivity of LC3BI can lead to erroneous results. Hence, it is highly recommended that LC3BII levels be normalized only to loading control to compare samples (54, 55).
Fig. 2.

Androgens increase autophagy in an AR-dependent manner in prostate cancer cells. A, LNCaP cells were treated for 3 d with vehicle (ethanol) or 10 nm R1881. Cells were then fixed and examined by TEM. Left, AVs, autophagosomes and autolysosomes. Right, Quantification of the number of AVs in vehicle- and R1881-treated cells. Data are presented as the mean number of AVs/cell (n = 19 cells each). *, Significant changes from vehicle-treated cells. B, LNCaP or VCaP cells stably expressing an eGFP-LC3B fusion were treated for 3 d with vehicle, R1881 (10 nm), or the endogenous androgen DHT (10 nm). Redistribution of eGFP-LC3B (green) was covisualized with a DAPI nuclear stain (blue) using immunofluorescence confocal microscopy. Left, Representative pictures are shown. Scale bar, 20 μm. Right, Average number of punctae/cell (n = 30 cells) was analyzed and plotted. *, Significant changes from vehicle-treated cells. C, Indicated prostate cancer cells were treated for 3 d with vehicle or 10 nm R1881 and then subjected to Western blot analysis to determine LC3BI/II and GAPDH (loading control) levels. Below the images are the average LC3BII densitometry values normalized to GAPDH ± se (n ≥ 3). D, LNCaP cells were treated for 3 d with vehicle (−), 40 μm chloroquine (CQ) (blocks autophagic flux leading to build up of LC3BII), or increasing doses (0.1, 1, and 10 nm) of R1881 or DHT. Cells were then subjected to Western blot and densitometry analysis as in C. E, LNCaP cells were treated for 3 d ± 10 μm Casodex and ±10 nm R1881. Cells were then subjected to Western blot and densitometry analysis as in C.
RNA isolation, cDNA preparation, and quantitative RT-PCR (qPCR)
RNA isolation, cDNA preparation, and qPCR were carried out as previously described using 36B4 as a control (49). The sequences of the primers were as follows: autophagy-related protein 7 (ATG7) forward, 5′-GATCCGGGATTTCTTTCACG-3′ and reverse, 5′-CAGCAATGTAAGACCAGTCAAGT-3′; and FAS forward, 5′-CGCTCTGGTTCATCTGCTCTG-3′ and reverse, 5′-TCATCAAAGGTGCTCTCGTCTG-3′. The sequences of all other qPCR primers used in this study have been previously described (49).
Transmission electron microscopy (TEM) and immunogold TEM
For basic TEM, cells were plated in six-well plates at 500,000 cells/well and treated as described above. Cells were then washed twice in serum-free media and fixed for 3–5 min at room temperature with 4% glutaraldehyde in 0.1 m cacodylate buffer (pH 7.0). Cells were gently scraped and centrifuged at 5000 × g for 3 min in a swinging bucket rotor followed by additional fixing for 1 h. Pellets were then embedded and sectioned by the Duke University Department of Pathology's Electron Microscopy Core. Grids were viewed using a Philips/FEI CM 12 Transmission EM with AMT 2k x 2k digital camera.
For immunogold TEM, cells were plated in 24-well plates at 100,000 cells/well and treated as described above. Preembedding immunogold labeling was performed on samples fixed in 4% paraformaldehyde/0.1% glutaraldehyde after free aldehydes were quenched in 0.1 m sodium borohydride in PBS for 15 min, blocked with 3% BSA, incubated with LC3 antibody (1:100) overnight at 4 C, washed extensively, and incubated with the gold-conjugated secondary antibody (1:100) overnight at 4 C. After further extensive washing, samples were fixed a second time for 10 min in 2% gluteraldehyde, washed, and stained with 1% uranyl acetate for 15 min. Samples were then embedded and sectioned by the MD Anderson Cancer Center High Resolution Electron Microscopy Facility (Houston, TX). All grids were viewed on a JEOL 100CX II TEM at 80 kV.
Creation of stable cell lines using retrovirus
LNCaP and VCaP enhanced GFP (eGFP)-LC3B stable cells were created using a previously described GFP-LC3 retroviral vector (56) and previously described approach (53).
Fluorescence microscopy
Cells were seeded on coverslips coated with poly-L-lysine, cultured and treated with vehicle (ethanol), DHT (10 nm), or R1881 (10 nm) for 72 h. To visualize punctae in mCherry-GFP-LC3 or eGFP-LC3-expressing cells, cultures were fixed in 4% paraformaldehyde, washed with PBS, and then stained with 50 nm LysoTracker or 200 nm 4′,6-diamidino-2-phenylindole (DAPI) as a counter stain and mounted in ProLong antifade (Life Technologies). Lipid droplets were stained using HCS LipidTOX 1:1000 dilution from stock (Life Technologies). Of cautionary note, BODIPY 493/503 stain was initially used to detect intracellular lipids but yielded false positive staining (data not shown). This commonly used fluorescent marker of neutral lipids is highly susceptible to bleed through into the other fluorescent channels, unlike the LipidTOX stain that has a narrow emission spectrum. Therefore, BODIPY 493/503 should be used with caution when performing costains (especially in the green and red spectra). Stable cells were visualized using an Olympus FV-1000 confocal microscope (Olympus, New York, NY) under ×63 objective or a DeltaVision core deconvolution microscope (Olympus IX-71) with a ×60 oil immersion objective lens and analyzed using ImageJ software (National Institutes of Health). The Pearson correlation coefficient for lysosome and autophagosome colocalization was determined using the SoftWorx software (Applied Precision, Issaquah, WA).
For rapid characterization of the tet-inducible ATG7 short hairpin RNA (shRNA) stable cell line or reactive oxygen species (ROS) imaging described below (ROS measurement), fluorescence microscopy was performed on plated and treated cells using a Zeiss Axiovert 40 CFL fluorescence microscope with a ×10 objective (Zeiss, Oberkochen, Germany).
Lipogenesis assay
For lipogenesis assays, cells were plated in CS-FBS-containing media at 20,000 cells/well in poly-L-lysine-coated clear bottom/black walled 96-well plates. Cells were then either transfected with or without indicated siRNAs as described above and then treated for 3 d with vehicle, R1881, or chloroquine. Intracellular triglyceride (TG) levels were then determined using an AdipoRed Nile Red-based fluorometric assay according to the manufacturer's instructions (Lonza, Allendale, NJ). The relative fluorescence intensity was corrected for the background and normalized to cell number using duplicate plates and the fluorescent DNA-binding dye assay described above. For stable LNCaP cells with inducible ATG7-targeting shRNA, cells were plated (10,000 cells/well) and then treated ±800 ng/ml Dox and ±R1881 in 96-well plates containing CS-FBS. Neutral lipid content was then quantitated as described above.
Creation of inducible stable cell lines using lentivirus
Commercially available shRNAs (sequences are listed in Supplemental Table 1) in the pGIPZ backbone were obtained from Thermo Scientific (Lafayette, CO). An shRNA that we determined in preliminary experiments (data not shown) to give the best knockdown of ATG7 was used to produce lentivirus. For inducible RNA interference experiments, shRNAs were subcloned into the pINDUCER11 Dox-inducible lentiviral expression system by XhoI and MluI double digestion and ligation (57). Lentiviruses were generated by cotransfecting the appropriate shRNA constructs along with the packaging plasmids pMDL, pRSV-Rev, and pCMV-VSV-G into 293T cells. Viral supernatants were harvested 48 h after transfection and combined with 8 μg/ml polybrene to increase infection efficiency. Virus was then used to infect target cells, and 96 h later, target cells were GFP sorted using flow cytometry. Induction of shRNA expression was done using 800 ng/ml Dox.
ROS measurement
Intracellular ROS levels were determined using CM-H2DCFDA and subsequent fluorescence-activated cell sorting (FACS) analysis (58) or fluorescence microscopy described above. Briefly, for FACS analysis, treated cells were rinsed in PBS buffer and exposed to 5 μm CM-H2DCFDA in the dark for 30 min at 37 C. Subsequently, the cells were trypsinized and resuspended in PBS buffer. Intracellular fluorescence was then quantified using a BD Aria II flow cytometer (Becton Dickinson, Franklin Lakes, NJ).
To visualize intracellular ROS levels, cells were plated and treated as described above for immunofluorescence microscopy. Cells were then incubated with 2.5 μm CM2-H2DCFDA for 30 min at 37 C and imaged according to previously described methods (59, 60).
Statistical analysis
Two-sample comparisons were performed using Student's t tests. Multiple comparisons were performed using a one-way ANOVA and post hoc Dunnett's test with GraphPad Prism, Version 4 (GraphPad Software, Inc., San Diego, CA). Unless otherwise noted, statistically significant changes were determined at the P < 0.05 level.
Results
Functional autophagy is required for maximal androgen-mediated prostate cancer cell growth
There has been a recent shift in our understanding of the role of autophagy in cancer that suggests that autophagy plays a major role in the progression of many types of cancers (14–27). Given the importance of androgens and AR signaling in both the development of the prostate and the progression of prostate cancer (61), we sought to determine whether autophagy was important for androgen-mediated cell growth in cellular models of androgen-sensitive prostate cancer. Using LNCaP or VCaP human prostate cancer cells, which express endogenous AR, we determined the effects of three different inhibitors of autophagy (3-MA blocks autophagosome formation; chloroquine and bafilomycin A1 block autophagic flux) on androgen-mediated cell growth using inhibitor concentrations that are both recommended and widely used in the field of autophagy (14–19, 26, 34, 56, 62–66). In both cell models, all three inhibitors suppressed androgen-mediated cell growth in a dose-dependent manner (Fig. 1A). Although there were significant effects of the higher concentrations of chloroquine and bafilomycin A1 on basal cell growth, these compounds had a more dramatic effect on androgen-mediated growth, in most instances suppressing growth to vehicle-alone-treated levels. Additional assays using these pharmacological inhibitors suggest that some of the effects on cell growth, particularly at the higher concentrations, are due to changes in cell viability (Supplemental Fig. 1A).
Fig. 1.

Autophagy is required for androgen-mediated prostate cell growth. A, LNCaP or VCaP cells were treated for 7 d with vehicle or the synthetic androgen R1881 in combination with vehicle or increasing concentrations of various inhibitors of autophagy (chloroquine: 1, 10, and 40 μm; 3-MA: 1 and 10 mm; bafilomycin A1: 1, 10, and 100 nm). Cells were then lysed, and the relative number of cells was quantified using a fluorescent DNA-binding dye. Each sample was performed in triplicate, and results from a representative experiment are shown. Results are expressed as mean relative cell number + se (n = 3). *, Significant changes from vehicle (no R1881)-treated cells; #, significant changes from vehicle (no autophagy inhibitor)-treated cells. B, LNCaP cells were transfected with mock, a control siRNA or siRNAs targeting three separate regions of the core autophagy molecule ATG7 and then treated for 7 d ± R1881. Relative cell numbers were then quantitated as in A. Each sample was performed in triplicate, and results from a representative experiment are shown. Results are expressed as mean relative cell number + se (n = 3). *, Significant changes from vehicle (no R1881)-treated cells; #, significant changes from mock-transfected cells. D, Western blot analysis of transfected LNCaP cell lysates to demonstrate ATG7 knockdown blocks autophagy as assessed by the decrease in the levels of LC3BII.
Like most pharmacological modulators, potential off-target effects of the autophagy inhibitors are a concern. Therefore, to complement our pharmacological studies, we also blocked autophagy using molecular techniques. To determine the effects of molecular inhibition on androgen-mediated prostate cell growth, we used siRNAs targeting three separate regions of ATG7, a core component of the autophagic machinery that is required for LC3 lipidation, a hallmark of functional autophagy (67). During autophagy, the cytoplasmically diffuse form of LC3B, LC3BI, is conjugated to a phospholipid to create a modified form, LC3BII, which localizes to autophagosomes and autolysosomes. LC3BII, despite having a phospholipid conjugate, migrates faster on an SDS-PAGE gel and hence can be distinguished from LC3BI using Western blot analysis. Depletion of ATG7 levels (Supplemental Fig. 1B) not only blocked the conversion of LC3BI to LC3BII (Fig. 1B, right) but also inhibited androgen-mediated cell growth approximately 50% (Fig. 1B, left). Importantly, molecular inhibition of autophagy had minimal effect on cell viability (Supplemental Fig. 1C). Collectively, these findings indicate that autophagy is needed for maximal prostate cell growth and, more specifically, for androgen-mediated prostate cancer cell growth.
Androgens increase autophagy
Because both molecular and pharmacological inhibitors suppressed androgen-mediated prostate cancer cell growth, we wanted to know whether androgens could induce autophagy. To assess cellular autophagy, three classical approaches are primarily used: 1) TEM (still often considered the gold standard), 2) LC3B immunofluorescence microscopy to assess LC3B relocalization, and 3) LC3B Western blot analysis to assess LC3BII levels. Therefore, we treated LNCaP cells for 3 d with vehicle or R1881 and assessed the formation of autophagic vesicles (AVs) (autophagosomes + autolysosomes) using TEM followed by blinded scoring (Fig. 2A). Using this relatively low-throughput approach, we determined there to be a roughly 4-fold increase in AV levels after androgen treatment. To further corroborate and expand our findings, we created, using a retroviral approach, both LNCaP and VCaP prostate cancer cells that stably expressed an eGFP-LC3B construct. We then treated these cells for 3 d with vehicle, R1881, or the physiological androgen DHT and quantified GFP-LC3 punctae formation using immunofluorescence microscopy (Fig. 2B). In either LNCaP- or VCaP-GFP-LC3 cells, both the synthetic androgen R1881 or the physiological androgen DHT significantly increased GFP punctae formation, indicating LC3B relocalization and hence autophagosome formation. Interestingly, in our hands, it took at least 2 d to detect androgen-mediated autophagy, indicating an indirect induction of autophagy by androgens (data not shown). Next, we wanted to confirm that androgens exerted a similar effect on autophagy in other androgen-sensitive prostate cancer cell models. Using Western blot analysis to assess the formation of the lipid-modified LC3BII form, it was determined that androgens increased autophagy in LNCaP, VCaP, LAPC4, CWR22, and 22Rv1 cells after R1881 treatment (Fig. 2C). To demonstrate the role of AR, LNCaP cells were treated with increasing concentrations of R1881 or DHT, and it was observed that either androgen increased LC3BII levels in a dose-dependent manner (Fig. 2D). This androgen-mediated effect could be blocked by cotreatment with the antiandrogen Casodex, indicating that LC3B conversion is AR dependent (Fig. 2E).
Androgens increase autophagic flux in prostate cancer cells
Although LC3 lipidation and relocalization is a marker for autophagosome formation, it does not report on the rate of autophagic flux. This is because LC3BII is degraded over time by lysosomal enzymes and hence the accumulation of LC3BII can result from either increased autophagic entry or decreased autophagic flux (i.e. failure of autophagosomes to fuse with lysosomes) (68). Therefore, we took three different approaches to assess the impact of androgens on autophagic flux in prostate cancer cells. First, if functional autophagy is occurring, autophagosomes need to fuse with existing lysosomes to degrade their contents. To test this, we used our LNCaP and VCaP stably expressing eGFP-LC3B cell lines to demonstrate that androgens increased LC3B and lysosome colocalization (Fig. 3A and Supplemental Fig. 2A). A second, newer assay uses a tandem mCherry-GFP fusion protein linked to LC3 (69). This GFP signal is sensitive to the acidic and/or proteolytic environment within the lysosome, unlike mCherry, which is more stable. Thus, punctate colocalization (yellow) of both GFP and mCherry indicates the formation of an early autophagosome that has not yet fused with a lysosome, whereas mCherry (red) punctate staining alone suggests LC3 has been delivered to the lysosomes, marking late autophagy. After transient transfection of the mCherry-GFP-LC3 construct and androgen treatment in either LNCaP or VCaP cells, we imaged cells and quantitated the different LC3 punctate populations (Fig. 3B and Supplemental Fig. 2B). In both cell lines, R1881 or DHT treatment lead to a significant increase in GFP−mCherry+ (red) punctate formation, indicating that androgens promote autophagic flux. Finally, to complement our immunofluorescence studies, we assessed autophagic flux using a third approach that is based on Western blot analysis of LC3BII levels before and after lysosomal inhibition (Fig. 3C and Supplemental Fig. 2C). Here, cells were pretreated with a cocktail of E-64-d and pepstatin A (Fig. 3C), specific inhibitors of lysosomal proteases, or chloroquine (Supplemental Fig. 2C) before androgen treatment. After inhibitor treatment, LC3BII levels accumulated due to lysosomal turnover being blocked. Importantly, androgen treatment further increased LC3BII levels despite impaired lysosomal function, implying that AR-signaling promotes entry into autophagy rather than blocking the autophagic flux.
Fig. 3.

Androgens increase autophagic flux in prostate cancer cells. A, LNCaP (representative pictures shown on left) or VCaP (representative pictures shown in Supplemental Fig. 2A) cells stably expressing an eGFP-LC3B fusion were treated for 3 d with vehicle or 10 nm R1881. Cells were then fixed and stained with LysoTracker to identify acidic organelles. eGFP-LC3B and LysoTracker colocalization was determined using immunofluorescence confocal microscopy. Scale bars, 10 μm. Quantification of colocalization (right) was done using ImageJ software. B, LNCaPs (representative pictures shown in Supplemental Fig. 2B) or VCaPs (representative pictures shown on left) were transfected with an mCherry-GFP-LC3B construct and treated for 3 d with vehicle, DHT (10 nm), or R1881 (10 nm) to assess autophagic flux. Cells were then fixed and visualized using a confocal immunofluorescence microscope. Scale bars, 10 μm. Right, Quantification of average total, GFP+mCherry+ (yellow, early autophagy/autophagosome) and GFP−mCherry+ (red, late autophagy/autolysosomes) punctae/cell ± se for both LNCaP and VCaP cells (n > 10 cells each condition). *, Significant changes (P < 0.05) from vehicle-treated cells. **, Significant changes (P < 0.01) from vehicle-treated cells. C, LNCaP cells were treated for 3 d ± 10 μg/ml each of E-64-d and pepstatin A (specific lysosomal protease inhibitors) and ± 10 nm R1881. Cells were then subjected to Western blot analysis as in Fig. 2.
Autophagy enhances androgen-mediated intracellular lipid accumulation
Although our data here, as well as studies performed by other groups, indicate that autophagy can contribute to cancer cell growth, it is still not fully understood mechanistically how autophagy could augment prostate cancer cell growth. We initially tested whether blocking autophagy could influence the levels of various cell cycle regulatory proteins (Supplemental Fig. 3). In our hands, suppression of autophagy did not consistently alter the levels of cyclin D1, cyclin D3, p21 Waf1/Cip1, p27 Kip1, CDK4, p15 INK4B, or p18 INK4C. Although this is certainly not a comprehensive list of all potential growth regulatory proteins, it suggested that perhaps autophagy was not directly influencing the cell cycle machinery.
Recently, several groups have demonstrated that prostate cancers have elevated levels of intracellular lipids and that blocking the accumulation of these lipids inhibits tumorigenesis (36–40). Interestingly, although autophagy is classically thought of as a catabolic process, it has also become apparent that autophagy plays a role in certain anabolic processes, such as lipogenesis (31–35). Therefore, we tested the hypothesis that androgen-mediated autophagy contributes to prostate cancer cell growth through altering lipid metabolism. Androgen treatment of either LNCaP or VCaP cells leads to a significant AR-dependent increase in intracellular levels of lipids as determined using either TEM or a Nile Red-based neutral lipid assay (Fig. 4A and Supplemental Fig. 4). Further, using immunofluorescence confocal microscopy with a HCS LipidTOX stain highly specific for neutral lipids, we determined that, although there was not a high level of lipid and LC3 punctae colocalization, the androgen-mediated rise in intracellular lipid levels correlated with the appearance of autophagy (Fig. 4B and Supplemental Fig. 5). This is consistent with what has been observed by other laboratories studying the link between autophagy and fat metabolism (35, 65, 70, 71). To get a better idea of the subcellular targets of autophagy, we performed LC3 immunogold TEM with androgen-treated cells (Fig. 4C). After androgen treatment, LC3 immunogold staining could be detected in discrete regions adjacent to lipid droplets (left two pictures), consistent with findings from other laboratories (65), or localized to AVs (far right pictures). In vehicle-treated cells, LC3 staining was difficult to find and did not localize to lipid droplets since vehicle-treated prostate cancer cells do not accumulate lipid droplets (data not shown). Unexpectedly, we did not observe a robust localization of LC3 density in the proximity of fat droplets, a consequence we believe of the ultrathin sections required for TEM or the fixing procedure. Therefore, to complement these qualitative studies, we used the Nile Red-based assay to quantitate total neutral lipid levels after androgen treatment with or without molecular (ATG7 siRNA) or pharmacological (chloroquine) inhibition of autophagy. Both siRNAs targeting ATG7 (Fig. 4D and Supplemental Fig. 6A) or increasing concentrations of chloroquine (Fig. 4E and Supplemental Fig. 6B) significantly decreased neutral lipid levels after androgen treatment.
Fig. 4.

Autophagy promotes androgen-mediated lipid accumulation. A, LNCaP cells were treated for 3 d with vehicle (ethanol) or 10 nm R1881. Cells were then fixed and examined by TEM as in Fig. 2. B, LNCaP cells stably expressing an eGFP-LC3B fusion were treated for 3 d with vehicle, DHT (10 nm), or R1881 (10 nm). Cells were then fixed and costained with LipidTOX (neutral lipid depots) and DAPI (nucleus). eGFP-LC3B, LipidHTX, and DAPI colocalization was visualized using immunofluorescence confocal microscopy. Scale bars, 20 μm; 5 μm for higher resolution images on far right. C, LNCaP or VCaP cells were treated as in A and subjected to immunogold TEM to determine LC3B subcellular localization (yellow arrows). D, LNCaP cells were transfected with siRNAs as in Fig. 1B and treated for 3 d with vehicle or 10 nm R1881. Intracellular TG levels were then determined using a fluorescent Nile Red-based stain (AdipoRed) and normalized to cell numbers that were determined using duplicate plates that were instead subjected to the fluorescent DNA-binding dye described in Fig. 1. Each sample was performed in triplicate, and results from a representative experiment are shown. Results are expressed as TG levels normalized to cell numbers + se (n = 4). *, Significant changes from mock-transfected cells. E, LNCaP cells were treated with vehicle or increasing concentrations of chloroquine (CQ) ± 10 nm R1881 for 3 d. Intracellular TG levels were then determined as described in D. Each sample was performed in triplicate and results from a representative experiment are shown. Results are expressed as TG levels normalized to cell numbers + se (n = 4). *, Significant changes from vehicle (no CQ)-treated cells.
To avoid the potential side effects that can occur with the use of chemical siRNAs, we created an LNCaP stable cell line using the pINDUCER system (57). This platform is advantageous, because it uses a single vector to constitutively express a third-generation reverse Tet transactivator that, upon addition of tetracycline or its derivative Dox, promotes the pol II-driven expression of an shRNA transcript (in our case ATG7-targeting) expressed as a microRNA mimic (Fig. 5A). These microRNA mimics have the advantage of minimizing off-target RNA interference effects compared with their classical shRNA predecessors (72). After the creation and validation of this cell model (Fig. 5, B and C), we confirmed that the inducible knockdown of ATG7 decreased both androgen-mediated lipogenesis (Fig. 5D) and cell growth (Fig. 5E). Collectively, these data indicate that autophagy facilitated the formation of intracellular fat depots. Importantly, this was not the result of shutting down basic cellular processes like transcription, because knockdown of ATG7 had no effect on the expression of classic AR-regulated genes (Supplemental Fig. 7). Further, inhibition of autophagy using either inducible ATG7 shRNA or E-64-d and pepstatin A cotreatment did not prevent the expression of FAS, a bona fide AR-target and the rate-limiting step of de novo lipogenesis (Supplemental Fig. 8, A and B) (42, 43, 48, 73, 74). Additionally, knockdown of ATG7 did not affect the levels of a sampling of other proteins classically involved in lipid metabolism, including ACC, ACL, acetyl-CoA synthetase, acyl-CoA synthetase, and lipin1 (Supplemental Fig. 8C), suggesting that autophagy may not regulate the levels of lipogenic enzymes.
Fig. 5.

Inducible expression of ATG7-targeting shRNA inhibits androgen-mediated lipid accumulation and cell growth. A, Diagram of the pINDUCER11 construct used in this study. B and C, To characterize the LNCaP ATG7 shRNA stable cells, cells were treated for 2 d ± 800 ng/ml Dox and subjected to fluorescence microscopy (B) or Western blot analysis (C). D, TG levels were quantitated as described in Fig. 4 but using LNCaP ATG7 shRNA-inducible stable cells cotreated for 3 d ± Dox and ± R1881. Results are expressed as TG levels normalized to cell numbers + se (n = 2). *, Significant changes from double vehicle-treated cells. E, Stable cells were again cotreated but for 7 d followed by quantification of cell numbers using the assay described in Fig. 1. Results are expressed as mean relative cell number + se (n = 2). **, Significant change (P < 0.01) from R1881 alone-treated cells.
Autophagy promotes androgen-mediated lipid accumulation independent of FAS expression
Because inhibition of autophagy did not alter the levels of FAS or other lipogenic enzymes (Supplemental Fig. 8), we asked the reciprocal question of whether de novo lipogenesis could regulate autophagy. In other words, we wanted to know whether the accumulation of intracellular fat was the cue that stimulated autophagy. To test this, we knocked down FAS levels using three separate siRNAs and then treated cells with or with-out R1881. Consistent with what others have shown (41–43, 47, 74), knockdown of FAS severely impaired AR's ability to increase intracellular fat levels (Fig. 6A) and cell growth (Fig. 6B). Despite the similarities to the knockdown of ATG7, knockdown of FAS did not impact autophagy as assessed by the Western blot analysis of LC3BII levels (Fig. 6C). These findings suggest that autophagy can promote intracellular lipid accumulation by a mechanism that is at least partially independent of FAS activity.
Fig. 6.
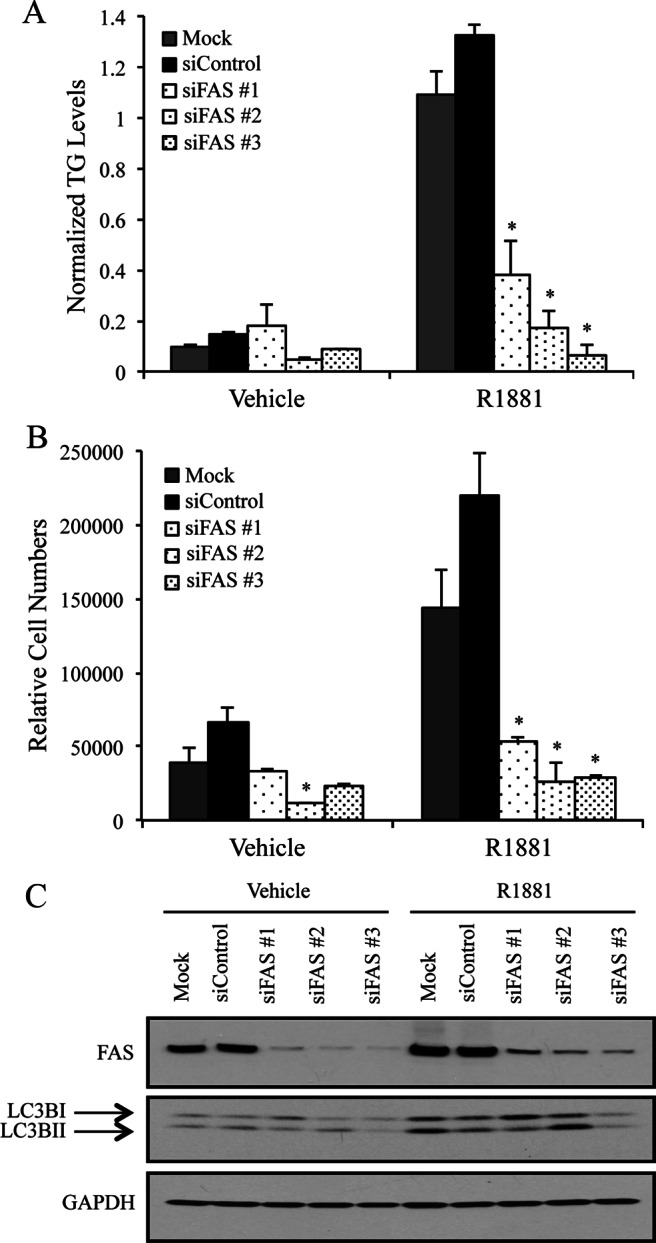
Autophagy-mediated lipid accumulation is downstream of FAS. LNCaP cells were transfected with mock, a negative scramble control (siControl) or three siRNAs targeting separate regions of FAS mRNA. Cells were then treated for 3 d with vehicle or 10 nm R1881. A, Cells were assayed for intracellular TG levels as described in Fig. 4D. Each sample was performed in triplicate, and results from a representative experiment are shown. Results are expressed as TG levels normalized to cell numbers + se (n = 2). *, Significant changes from mock-transfected cells. B, Cells were transfected with mock, a control siRNA, or siRNAs targeting three separate regions of FAS and then treated for 7 d ± R1881. Relative cell numbers were then quantitated as described in Fig. 1. Each sample was performed in triplicate, and results from a representative experiment are shown. Results are expressed as mean relative cell number + se (n = 3). *, Significant changes from mock-transfected cells. C, Lysates from LNCaP cells transfected and treated the same as in A were subjected to Western blot analysis. A representative blot is shown (n = 4).
Androgens promote autophagy, in part, through the production of ROS
Although we established the importance of autophagy for androgen-mediated prostate cancer cell growth, we still did not understand how androgens increased autophagy. Previous work by Scherz-Shouval et al. (75) demonstrated that elevated ROS levels led to increased autophagy. Given that androgens can increase ROS in prostate cancer cells to a level that potentiates cell growth (48, 58, 76, 77), we decided to explore whether androgens could stimulate autophagy by increasing the intracellular levels of ROS. Consistent with what others have shown, CM2-H2DCF-DA and subsequent FACS analysis demonstrated that treatment of either VCaP or LNCaP cells with androgens increased intracellular ROS levels (Supplemental Fig. 9). By adapting the CM2-H2DCF-DA assay, we used basic fluorescence microscopy to more rapidly and easily assess relative ROS levels. Using this approach, we demonstrated that VCaP cells treated for 3 d with R1881 have elevated ROS levels, an effect that could be blocked by the antioxidant TEMPOL (Fig. 7A). Furthermore, treatment of prostate cancer cells with either of the antioxidants TEMPOL (Fig. 7B) or N-acetyl cysteine (Supplemental Fig. 10) was sufficient to block androgen-mediated autophagy. This corresponded with the ability of antioxidants to block androgen-mediated lipid accumulation (Fig. 7C). Importantly, blocking ROS production, although having minimal effect on basal cell growth, inhibited androgen-mediated cell growth (Fig. 7D), consistent with what has been demonstrated before in LNCaP cells (48, 58, 76, 77). Taken together, these data suggest that androgens increase cell growth, in part, by activating a complex metabolic shift that is signaled by the elevation of intracellular ROS levels.
Fig. 7.

Androgens promote autophagy-mediated cell growth, in part, through elevating intracellular ROS levels. A, VCaP cells were cotreated for 3 d ± 1 mm TEMPOL and ± 10 nm R1881. Cells were then assayed for ROS production using CM-H2DCF-DA-based fluorescence microscopy analysis. B, VCaP cells were treated as in A and subjected to Western blot analysis for LC3B and GAPDH (loading control). C, VCaP cells were treated as in A and B. Cells were then assayed for intracellular TG levels as described in Fig. 4D. Each sample was performed in triplicate, and results from a representative experiment are shown. Results are expressed as TG levels normalized to cell numbers + se (n = 2). *, Significant changes from double vehicle-treated cells. D, VCaP cells were again cotreated but for 7 d and then assayed for relative cell numbers as described in Fig. 1. Each sample was performed in triplicate, and results from a representative experiment are shown. Results are expressed as mean relative cell number + se (n = 3). *, Significant changes from double vehicle-treated cells.
Discussion
The work presented here indicates that androgens, via AR, utilize autophagy to promote prostate cancer cell growth. Initially, these data were counterintuitive to us because autophagy is usually considered to be a catabolic process that is activated during times of stress (78). This contrasts with the established roles of androgens as anabolic steroids. Indeed, previous studies have reported that androgens can block autophagy in either LNCaP cells or PC-3 cells transiently transfected with AR (62, 79, 80). However, these studies looked at more rapid androgenic effects under different conditions, during hypoxia or complete serum starvation, conditions where androgens do not optimally promote cell growth. Conversely, our data clearly indicate in multiple cellular models that when androgens promote cell growth, autophagy is activated. Further, autophagy has been recently shown by multiple groups to be required for the progression of various types of cancers (14–27), supporting a progrowth role. It should be also noted that although Bennett et al. (79) reported that androgens could block serum starvation-induced autophagy at up to 24 h, longer treatments (i.e. 72 h) that increased cell survival also increased autophagy. These findings indicate that when the extracellular environment can provide a necessary level of support, androgen-treated cancer cells can utilize autophagy for their benefit. Ultimately, we think that cancer cells, not surprisingly, have the ability to adapt to their environment. In the context of prostatic diseases, androgens activate signaling pathways that facilitate the cell's potential to use diverse nutrients, building blocks, and energy sources for growth and survival. Androgen-mediated autophagy may be one way in which a prostate cell can redirect its efforts away from nonessential processes toward processes it deems more necessary like growth and/or survival.
The delayed induction demonstrated here suggests an indirect mechanism by which AR signaling enhances autophagy. Recent work by Scherz-Shouval et al. (75) showing that elevated ROS levels activate autophagy, combined with the previous work of several groups demonstrating that androgen-mediated ROS generation promotes prostate cancer cell growth (48, 58, 76, 77), provided the rationale for us to test whether androgenic regulation of autophagy and subsequent cell growth required ROS signaling (Fig. 7). The regulation of ROS levels in cells is a double-edged sword. Although too much ROS can trigger apoptosis, moderate levels promote cell signaling activities that are needed for both proliferation and survival (81). In our experiments, elevated ROS levels contributed to the androgen-induced autophagy, intracellular lipid accumulation, and cell growth (Fig. 7), indicating a role for ROS as a signaling molecule.
While ROS were required for the induction of autophagy, we cannot exclude the possibility that other initiating mechanisms exist. There are many modulators of autophagy, some of which are regulated by androgens. For example, we have previously shown that androgens increase AMP-activated protein kinase (AMPK) signaling through the expression of calcium/calmodulin-dependent kinase kinase β (53). Because AMPK is a known positive regulator of autophagy (82), our initial hypothesis was that androgens increased autophagy through the up-regulation of the calcium/calmodulin-dependent kinase kinase β-AMPK cascade. However, preliminary studies using siRNAs targeting AMPK have yielded inconclusive results (data not shown). Veeramani et al. (77) have reported that androgens can increase ROS levels and subsequent prostate cancer cell proliferation through an AR nongenomic mechanism. While androgens may function through membrane signaling, given the delayed onset of autophagy after treatment and the stereotypical AR pharmacology we see (Fig. 2, D and E), it may be premature to say genomic AR signaling does not play any role in the regulation of autophagy. Certainly, as our understanding of the regulation of autophagy advances, it may be worthwhile to reexamine earlier microarray signatures to determine any additional points of AR regulation.
We demonstrate here that androgen-mediated autophagy promotes the accumulation of intracellular fats. Although androgens are known to accumulate intracellular fats through the expression of several enzymes involved in de novo lipogenesis (36, 45–48), it appears that autophagy may function independently of these transcriptional events. Recent work in the field has demonstrated a bona fide role for autophagy in fat depot formation. Adipose-specific atg5 or atg7 knockout mice are lean and resistant to type 2 diabetes (31–34). In these mice, it appears there is a severe defect in normal fat cell differentiation. Further, the MAP1-LC3 conjugation system is required for lipid droplet formation in both hepatocytes and cardiomyocytes (35). It is possible that the membrane-forming capabilities of autophagy are used by the cell to help form the lipid depots. This is supported by the fact that LC3B is typically found in discrete locations on the lipid droplet membranes (Fig. 4C) (35, 65). However, until more dynamic labeling studies can be performed, this process remains an enigma.
One of the other major questions in the field is how does AR-mediated fat accumulation promote cell growth. To date, several explanations have been proposed. However, a dearth of experimental evidence has kept this issue largely unsolved. One theory is that the elevated levels of fat can help control cellular redox levels (42). Others have postulated that the fat droplets may serve as reservoirs that can be tapped into whenever the cell needs lipid building blocks to make new membranes during cell division. Although this is an attractive hypothesis, in prostate cancer, typically only a fraction of the cells are actively proliferating at any one time, indicating that this might be only a part of the answer (41). An alternative hypothesis is that the intracellular lipid accumulation is needed for various aspects of signal transduction. Many secondary messengers, such as prostaglandins and phosphatidylinositols, are derived from neutral lipid scaffolds. Further, many of the posttranslational modifications (e.g. palmitoylation and myristoylation) that are required for signal transduction cascades are lipid based. For example, the phosphoinositol 3-kinase-Akt signaling pathway, which plays a major role in prostate cancers, requires these lipid modifications to properly organize itself at the plasma membrane and thus ensure efficient signaling (83). Additionally, androgens have been demonstrated to potentiate prostate cancer cell proliferation by increasing the expression of squalene synthase, a lipogenic enzyme that contributes to membrane lipid raft formation (84). Another intriguing option is that the fat depots provide precursors for the production of androgens. Several studies have indicated that one of the causes of castrate-resistant prostate cancer is the up-regulation of enzymes involved in local steroid hormone production (85–87). Thus, even though circulating levels of androgens are negligible following hormone therapy, the intratumoral concentration of androgens remains high. While the androgen-mediated lipid droplets are thought to be mainly TGs due to the known AR-regulated lipogenic genes, the neutral lipid stains used here could also be detecting increases in cholesterol levels. Finally, one emerging possibility to explain the role of fat droplets in cell growth is the autophagy-mediated breakdown of fat droplets. This process, termed lipophagy, can yield free fatty acids that enter β-oxidation (65, 66, 70), which is an important energy-producing process in the prostate (88–92). This suggests that lipophagy may provide an alternative fuel source for cells. Although inhibition of autophagy led to an overall decrease in lipid levels, the opposite of what one would expect if high rates of lipophagy were occurring, it is plausible that some of the newly mobilized fats were redirected and used for fatty acid oxidation, an avenue of research we are currently exploring.
The data presented here suggest that AR signaling, via a ROS signal, promotes the autophagy-mediated mobilization of intracellular lipid depots that are then utilized by the cell through various ways to increase cell growth (Fig. 8). This is important because these findings begin to link together multiple aspects of AR-mediated prostate cell biology. Despite the known importance of AR signaling in the prostate, the mechanisms by which AR manifests its biological actions and how these are dysregulated during disease progression are poorly understood. As a result, it has become increasingly important to identify which AR-regulated signaling networks actually drive the disease vs. which ones are benign bystanders. Our understanding of these signaling pathways will ultimately yield new therapeutic targets. Thus, as our work indicates, in addition to exploring the use of antioxidants and inhibitors of fatty acid synthesis, autophagy may offer a new therapeutic target for AR-driven prostatic diseases.
Fig. 8.

Proposed model of how androgen-mediated autophagy promotes prostate cell growth. Androgens, via AR, promote intracellular lipid accumulation through 1) increasing the expression of enzymes involved in de novo lipogenesis (e.g. FAS, ACC, and ACL) and 2) elevating intracellular ROS levels. The increased ROS levels stimulate lipid accumulation through an autophagy-mediated mechanism that is not fully understood but is downstream/independent of FAS. The intracellular fat depots can then ultimately promote prostate cell growth and/or survival through potentially altering multiple aspects of cell biology and metabolism.
Supplementary Material
Acknowledgments
We thank members of the Frigo Laboratory for technical advice, helpful suggestions, and critical comments on this study and manuscript. We especially thank Dr. Ana Maria Cuervo (Albert Einstein College of Medicine, Bronx, New York, NY) for advice on various autophagy approaches. We also thank Dr. Thomas Westbrook (Baylor College of Medicine, Houston, TX) for providing the pINDUCER system plasmids and advice; Dr. Herman Dierick (Baylor College of Medicine) for help with the pGIPZ constructs; Dr. Charles Sawyers (Memorial Sloan-Kettering Cancer Center, New York, NY) for providing the LAPC4 cells; Dr. Brian Altman (University of Pennsylvania, Philadelphia, PA) and Dr. Tso-Pang Yao (Duke University) for providing the GFP-LC3 retroviral construct (Altman) and helpful discussions regarding autophagy; Dr. Fei Su (University of Houston) and the Duke Comprehensive Cancer Center Flow Cytometry Shared Resource for help with cell sorting; both the Duke University Department of Pathology's Electron Microscopy Core and MD Anderson Cancer Center High Resolution Electron Microscopy Facility (Houston, TX) for help with TEM and immunogold TEM, respectively; and Dr. Sean Hartig (Baylor College of Medicine) for imaging advice and, along with Dr. Chin-Yo Lin (University of Houston), critical reading of this manuscript.
This work was supported by National Institutes of Health Grants K01DK084205 and R03DK092434 (to D.E.F.), P30EY007551 (to A.R.B.), and R01CA139818 (to D.P.M.), and by a grant from the Texas Emerging Technology Fund.
Disclosure Summary: The authors have nothing to disclose.
Footnotes
- ACC
- Acetyl-CoA carboxylase
- ACL
- ATP citrate lyase
- AMPK
- AMP-activated protein kinase
- AR
- androgen receptor
- ATG7
- autophagy-related protein 7
- AV
- autophagic vesicle
- CM-H2DCFDA
- chloromethyl-2′,7′-dichlorodihydrofluorescein diacetate
- CoA
- coenzyme A
- CS-FBS
- charcoal-stripped FBS
- DAPI
- 4′,6-diamidino-2-phenylindole
- DHT
- dihydrotestosterone
- Dox
- doxycycline
- E-64-d
- (2S,3S)-trans-epoxysuccinyl-l-leucylamido-3-methylbutane ethyl ester
- eGFP
- enhanced green fluorescent protein
- FACS
- fluorescence-activated cell sorting
- FAS
- fatty acid synthase
- FBS
- fetal bovine serum
- GAPDH
- glyceraldehyde-3-phosphate dehydrogenase
- GFP
- green fluorescent protein
- LC3BI/II
- microtubule-associated light chain 3 β I/II
- 3-MA
- 3-methyladenine
- qPCR
- quantitative RT-PCR
- R1881
- methyltrienolone
- ROS
- reactive oxygen species
- shRNA
- short hairpin RNA
- siRNA
- small interfering RNA
- TEM
- transmission electron microscopy
- TEMPOL
- 4-hydroxy-2,2,6,6-tetramethylpiperidine-N-oxyl
- TG
- triglyceride.
References
- 1. Gao W, Dalton JT. 2007. Expanding the therapeutic use of androgens via selective androgen receptor modulators (SARMs). Drug Discov Today 12:241–248 [DOI] [PMC free article] [PubMed] [Google Scholar]
- 2. Culig Z, Bartsch G. 2006. Androgen axis in prostate cancer. J Cell Biochem 99:373–381 [DOI] [PubMed] [Google Scholar]
- 3. Levine B, Kroemer G. 2008. Autophagy in the pathogenesis of disease. Cell 132:27–42 [DOI] [PMC free article] [PubMed] [Google Scholar]
- 4. Jiang M, Fernandez S, Jerome WG, He Y, Yu X, Cai H, Boone B, Yi Y, Magnuson MA, Roy-Burman P, Matusik RJ, Shappell SB, Hayward SW. 2010. Disruption of PPARγ signaling results in mouse prostatic intraepithelial neoplasia involving active autophagy. Cell Death Differ 17:469–481 [DOI] [PMC free article] [PubMed] [Google Scholar]
- 5. Mizushima N, Levine B. 2010. Autophagy in mammalian development and differentiation. Nat Cell Biol 12:823–830 [DOI] [PMC free article] [PubMed] [Google Scholar]
- 6. Rabinowitz JD, White E. 2010. Autophagy and metabolism. Science 330:1344–1348 [DOI] [PMC free article] [PubMed] [Google Scholar]
- 7. Kondo Y, Kanzawa T, Sawaya R, Kondo S. 2005. The role of autophagy in cancer development and response to therapy. Nat Rev Cancer 5:726–734 [DOI] [PubMed] [Google Scholar]
- 8. Mathew R, Karantza-Wadsworth V, White E. 2007. Role of autophagy in cancer. Nat Rev Cancer 7:961–967 [DOI] [PMC free article] [PubMed] [Google Scholar]
- 9. Hippert MM, O'Toole PS, Thorburn A. 2006. Autophagy in cancer: good, bad, or both? Cancer Res 66:9349–9351 [DOI] [PubMed] [Google Scholar]
- 10. Yue Z, Jin S, Yang C, Levine AJ, Heintz N. 2003. Beclin 1, an autophagy gene essential for early embryonic development, is a haploinsufficient tumor suppressor. Proc Natl Acad Sci USA 100:15077–15082 [DOI] [PMC free article] [PubMed] [Google Scholar]
- 11. Qu X, Yu J, Bhagat G, Furuya N, Hibshoosh H, Troxel A, Rosen J, Eskelinen EL, Mizushima N, Ohsumi Y, Cattoretti G, Levine B. 2003. Promotion of tumorigenesis by heterozygous disruption of the beclin 1 autophagy gene. J Clin Invest 112:1809–1820 [DOI] [PMC free article] [PubMed] [Google Scholar]
- 12. Feng Z, Zhang H, Levine AJ, Jin S. 2005. The coordinate regulation of the p53 and mTOR pathways in cells. Proc Natl Acad Sci USA 102:8204–8209 [DOI] [PMC free article] [PubMed] [Google Scholar]
- 13. Arico S, Petiot A, Bauvy C, Dubbelhuis PF, Meijer AJ, Codogno P, Ogier-Denis E. 2001. The tumor suppressor PTEN positively regulates macroautophagy by inhibiting the phosphatidylinositol 3-kinase/protein kinase B pathway. J Biol Chem 276:35243–35246 [DOI] [PubMed] [Google Scholar]
- 14. Amaravadi RK, Yu D, Lum JJ, Bui T, Christophorou MA, Evan GI, Thomas-Tikhonenko A, Thompson CB. 2007. Autophagy inhibition enhances therapy-induced apoptosis in a Myc-induced model of lymphoma. J Clin Invest 117:326–336 [DOI] [PMC free article] [PubMed] [Google Scholar]
- 15. Bauvy C, Gane P, Arico S, Codogno P, Ogier-Denis E. 2001. Autophagy delays sulindac sulfide-induced apoptosis in the human intestinal colon cancer cell line HT-29. Exp Cell Res 268:139–149 [DOI] [PubMed] [Google Scholar]
- 16. Boya P, González-Polo RA, Casares N, Perfettini JL, Dessen P, Larochette N, Métivier D, Meley D, Souquere S, Yoshimori T, Pierron G, Codogno P, Kroemer G. 2005. Inhibition of macroautophagy triggers apoptosis. Mol Cell Biol 25:1025–1040 [DOI] [PMC free article] [PubMed] [Google Scholar]
- 17. Guo JY, Chen HY, Mathew R, Fan J, Strohecker AM, Karsli-Uzunbas G, Kamphorst JJ, Chen G, Lemons JM, Karantza V, Coller HA, Dipaola RS, Gelinas C, Rabinowitz JD, White E. 2011. Activated Ras requires autophagy to maintain oxidative metabolism and tumorigenesis. Genes Dev 25:460–470 [DOI] [PMC free article] [PubMed] [Google Scholar]
- 18. Kim MJ, Woo SJ, Yoon CH, Lee JS, An S, Choi YH, Hwang SG, Yoon G, Lee SJ. 2011. Involvement of autophagy in oncogenic K-Ras-induced malignant cell transformation. J Biol Chem 286:12924–12932 [DOI] [PMC free article] [PubMed] [Google Scholar]
- 19. Li J, Hou N, Faried A, Tsutsumi S, Takeuchi T, Kuwano H. 2009. Inhibition of autophagy by 3-MA enhances the effect of 5-FU-induced apoptosis in colon cancer cells. Ann Surg Oncol 16:761–771 [DOI] [PubMed] [Google Scholar]
- 20. Liang J, Shao SH, Xu ZX, Hennessy B, Ding Z, Larrea M, Kondo S, Dumont DJ, Gutterman JU, Walker CL, Slingerland JM, Mills GB. 2007. The energy sensing LKB1-AMPK pathway regulates p27(kip1) phosphorylation mediating the decision to enter autophagy or apoptosis. Nat Cell Biol 9:218–224 [DOI] [PubMed] [Google Scholar]
- 21. Lu Z, Luo RZ, Lu Y, Zhang X, Yu Q, Khare S, Kondo S, Kondo Y, Yu Y, Mills GB, Liao WS, Bast RC., Jr 2008. The tumor suppressor gene ARHI regulates autophagy and tumor dormancy in human ovarian cancer cells. J Clin Invest 118:3917–3929 [DOI] [PMC free article] [PubMed] [Google Scholar]
- 22. Lv L, Li D, Zhao D, Lin R, Chu Y, Zhang H, Zha Z, Liu Y, Li Z, Xu Y, Wang G, Huang Y, Xiong Y, Guan KL, Lei QY. 2011. Acetylation targets the M2 isoform of pyruvate kinase for degradation through chaperone-mediated autophagy and promotes tumor growth. Mol Cell 42:719–730 [DOI] [PMC free article] [PubMed] [Google Scholar]
- 23. Pavlides S, Tsirigos A, Migneco G, Whitaker-Menezes D, Chiavarina B, Flomenberg N, Frank PG, Casimiro MC, Wang C, Pestell RG, Martinez-Outschoorn UE, Howell A, Sotgia F, Lisanti MP. 2010. The autophagic tumor stroma model of cancer: role of oxidative stress and ketone production in fueling tumor cell metabolism. Cell Cycle 9:3485–3505 [DOI] [PMC free article] [PubMed] [Google Scholar]
- 24. Sotelo J, Briceño E, López-González MA. 2006. Adding chloroquine to conventional treatment for glioblastoma multiforme: a randomized, double-blind, placebo-controlled trial. Ann Intern Med 144:337–343 [DOI] [PubMed] [Google Scholar]
- 25. Wei H, Wei S, Gan B, Peng X, Zou W, Guan JL. 2011. Suppression of autophagy by FIP200 deletion inhibits mammary tumorigenesis. Genes Dev 25:1510–1527 [DOI] [PMC free article] [PubMed] [Google Scholar]
- 26. Yang S, Wang X, Contino G, Liesa M, Sahin E, Ying H, Bause A, Li Y, Stommel JM, Dell'antonio G, Mautner J, Tonon G, Haigis M, Shirihai OS, Doglioni C, Bardeesy N, Kimmelman AC. 2011. Pancreatic cancers require autophagy for tumor growth. Genes Dev 25:717–729 [DOI] [PMC free article] [PubMed] [Google Scholar]
- 27. Lazova R, Camp RL, Klump V, Siddiqui SF, Amaravadi RK, Pawelek JM. 2012. Punctate LC3B expression is a common feature of solid tumors and associated with proliferation, metastasis, and poor outcome. Clin Cancer Res 18:370–379 [DOI] [PMC free article] [PubMed] [Google Scholar]
- 28. White E, DiPaola RS. 2009. The double-edged sword of autophagy modulation in cancer. Clin Cancer Res 15:5308–5316 [DOI] [PMC free article] [PubMed] [Google Scholar]
- 29. Masiero E, Agatea L, Mammucari C, Blaauw B, Loro E, Komatsu M, Metzger D, Reggiani C, Schiaffino S, Sandri M. 2009. Autophagy is required to maintain muscle mass. Cell Metab 10:507–515 [DOI] [PubMed] [Google Scholar]
- 30. Masiero E, Sandri M. 2010. Autophagy inhibition induces atrophy and myopathy in adult skeletal muscles. Autophagy 6:307–309 [DOI] [PubMed] [Google Scholar]
- 31. Goldman S, Zhang Y, Jin S. 2010. Autophagy and adipogenesis: implications in obesity and type II diabetes. Autophagy 6:179–181 [DOI] [PMC free article] [PubMed] [Google Scholar]
- 32. Zhang Y, Goldman S, Baerga R, Zhao Y, Komatsu M, Jin S. 2009. Adipose-specific deletion of autophagy-related gene 7 (atg7) in mice reveals a role in adipogenesis. Proc Natl Acad Sci USA 106:19860–19865 [DOI] [PMC free article] [PubMed] [Google Scholar]
- 33. Baerga R, Zhang Y, Chen PH, Goldman S, Jin S. 2009. Targeted deletion of autophagy-related 5 (atg5) impairs adipogenesis in a cellular model and in mice. Autophagy 5:1118–1130 [DOI] [PMC free article] [PubMed] [Google Scholar]
- 34. Singh R, Xiang Y, Wang Y, Baikati K, Cuervo AM, Luu YK, Tang Y, Pessin JE, Schwartz GJ, Czaja MJ. 2009. Autophagy regulates adipose mass and differentiation in mice. J Clin Invest 119:3329–3339 [DOI] [PMC free article] [PubMed] [Google Scholar]
- 35. Shibata M, Yoshimura K, Furuya N, Koike M, Ueno T, Komatsu M, Arai H, Tanaka K, Kominami E, Uchiyama Y. 2009. The MAP1-LC3 conjugation system is involved in lipid droplet formation. Biochem Biophys Res Commun 382:419–423 [DOI] [PubMed] [Google Scholar]
- 36. Swinnen JV, Brusselmans K, Verhoeven G. 2006. Increased lipogenesis in cancer cells: new players, novel targets. Curr Opin Clin Nutr Metab Care 9:358–365 [DOI] [PubMed] [Google Scholar]
- 37. Fritz V, Benfodda Z, Rodier G, Henriquet C, Iborra F, Avancès C, Allory Y, de la Taille A, Culine S, Blancou H, Cristol JP, Michel F, Sardet C, Fajas L. 2010. Abrogation of de novo lipogenesis by stearoyl-CoA desaturase 1 inhibition interferes with oncogenic signaling and blocks prostate cancer progression in mice. Mol Cancer Ther 9:1740–1754 [DOI] [PMC free article] [PubMed] [Google Scholar]
- 38. Rysman E, Brusselmans K, Scheys K, Timmermans L, Derua R, Munck S, Van Veldhoven PP, Waltregny D, Daniëls VW, Machiels J, Vanderhoydonc F, Smans K, Waelkens E, Verhoeven G, Swinnen JV. 2010. De novo lipogenesis protects cancer cells from free radicals and chemotherapeutics by promoting membrane lipid saturation. Cancer Res 70:8117–8126 [DOI] [PubMed] [Google Scholar]
- 39. Liu Y, Zuckier LS, Ghesani NV. 2010. Dominant uptake of fatty acid over glucose by prostate cells: a potential new diagnostic and therapeutic approach. Anticancer Res 30:369–374 [PubMed] [Google Scholar]
- 40. Zha S, Ferdinandusse S, Hicks JL, Denis S, Dunn TA, Wanders RJ, Luo J, De Marzo AM, Isaacs WB. 2005. Peroxisomal branched chain fatty acid β-oxidation pathway is upregulated in prostate cancer. Prostate 63:316–323 [DOI] [PubMed] [Google Scholar]
- 41. Flavin R, Zadra G, Loda M. 2011. Metabolic alterations and targeted therapies in prostate cancer. J Pathol 223:283–294 [DOI] [PMC free article] [PubMed] [Google Scholar]
- 42. Baron A, Migita T, Tang D, Loda M. 2004. Fatty acid synthase: a metabolic oncogene in prostate cancer? J Cell Biochem 91:47–53 [DOI] [PubMed] [Google Scholar]
- 43. Migita T, Ruiz S, Fornari A, Fiorentino M, Priolo C, Zadra G, Inazuka F, Grisanzio C, Palescandolo E, Shin E, Fiore C, Xie W, Kung AL, Febbo PG, Subramanian A, Mucci L, Ma J, Signoretti S, Stampfer M, Hahn WC, Finn S, Loda M. 2009. Fatty acid synthase: a metabolic enzyme and candidate oncogene in prostate cancer. J Natl Cancer Inst 101:519–532 [DOI] [PMC free article] [PubMed] [Google Scholar]
- 44. Pflug BR, Pecher SM, Brink AW, Nelson JB, Foster BA. 2003. Increased fatty acid synthase expression and activity during progression of prostate cancer in the TRAMP model. Prostate 57:245–254 [DOI] [PubMed] [Google Scholar]
- 45. Hatzivassiliou G, Zhao F, Bauer DE, Andreadis C, Shaw AN, Dhanak D, Hingorani SR, Tuveson DA, Thompson CB. 2005. ATP citrate lyase inhibition can suppress tumor cell growth. Cancer Cell 8:311–321 [DOI] [PubMed] [Google Scholar]
- 46. Beckers A, Organe S, Timmermans L, Scheys K, Peeters A, Brusselmans K, Verhoeven G, Swinnen JV. 2007. Chemical inhibition of acetyl-CoA carboxylase induces growth arrest and cytotoxicity selectively in cancer cells. Cancer Res 67:8180–8187 [DOI] [PubMed] [Google Scholar]
- 47. Swinnen JV, Heemers H, van de Sande T, de Schrijver E, Brusselmans K, Heyns W, Verhoeven G. 2004. Androgens, lipogenesis and prostate cancer. J Steroid Biochem Mol Biol 92:273–279 [DOI] [PubMed] [Google Scholar]
- 48. Lin H, Lu JP, Laflamme P, Qiao S, Shayegan B, Bryskin I, Monardo L, Wilson BC, Singh G, Pinthus JH. 2010. Inter-related in vitro effects of androgens, fatty acids and oxidative stress in prostate cancer: a mechanistic model supporting prevention strategies. Int J Oncol 37:761–766 [DOI] [PubMed] [Google Scholar]
- 49. Frigo DE, McDonnell DP. 2008. Differential effects of prostate cancer therapeutics on neuroendocrine transdifferentiation. Mol Cancer Ther 7:659–669 [DOI] [PubMed] [Google Scholar]
- 50. Kimura S, Noda T, Yoshimori T. 2007. Dissection of the autophagosome maturation process by a novel reporter protein, tandem fluorescent-tagged LC3. Autophagy 3:452–460 [DOI] [PubMed] [Google Scholar]
- 51. Dwyer MA, Joseph JD, Wade HE, Eaton ML, Kunder RS, Kazmin D, Chang CY, McDonnell DP. 2010. WNT11 expression is induced by estrogen-related receptor α and β-catenin and acts in an autocrine manner to increase cancer cell migration. Cancer Res 70:9298–9308 [DOI] [PMC free article] [PubMed] [Google Scholar]
- 52. Sherk AB, Frigo DE, Schnackenberg CG, Bray JD, Laping NJ, Hammond M, Patterson J, Thompson SK, Kazmin D, Norris JD, McDonnell DP. 2008. Development of a small molecule serum and glucocorticoid-regulated kinase 1 antagonist and its evaluation as a prostate cancer therapeutic. Cancer Res 68:1–9 [DOI] [PMC free article] [PubMed] [Google Scholar]
- 53. Frigo DE, Howe MK, Wittmann BM, Brunner AM, Cushman I, Wang Q, Brown M, Means AR, McDonnell DP. 2011. CaM kinase kinase β-mediated activation of the growth regulatory kinase AMPK is required for androgen-dependent migration of prostate cancer cells. Cancer Res 71:528–537 [DOI] [PMC free article] [PubMed] [Google Scholar]
- 54. Klionsky DJ, Abeliovich H, Agostinis P, Agrawal DK, Aliev G, Askew DS, Baba M, Baehrecke EH, Bahr BA, Ballabio A, Bamber BA, Bassham DC, Bergamini E, Bi X, Biard-Piechaczyk M, Blum JS, Bredesen DE, Brodsky JL, Brumell JH, Brunk UT, Bursch W, Camougrand N, Cebollero E, Cecconi F, Chen Y, et al. 2008. Guidelines for the use and interpretation of assays for monitoring autophagy in higher eukaryotes. Autophagy 4:151–175 [DOI] [PMC free article] [PubMed] [Google Scholar]
- 55. Mizushima N, Yoshimori T. 2007. How to interpret LC3 immunoblotting. Autophagy 3:542–545 [DOI] [PubMed] [Google Scholar]
- 56. Altman BJ, Wofford JA, Zhao Y, Coloff JL, Ferguson EC, Wieman HL, Day AE, Ilkayeva O, Rathmell JC. 2009. Autophagy provides nutrients but can lead to Chop-dependent induction of Bim to sensitize growth factor-deprived cells to apoptosis. Mol Biol Cell 20:1180–1191 [DOI] [PMC free article] [PubMed] [Google Scholar]
- 57. Meerbrey KL, Hu G, Kessler JD, Roarty K, Li MZ, Fang JE, Herschkowitz JI, Burrows AE, Ciccia A, Sun T, Schmitt EM, Bernardi RJ, Fu X, Bland CS, Cooper TA, Schiff R, Rosen JM, Westbrook TF, Elledge SJ. 2011. The pINDUCER lentiviral toolkit for inducible RNA interference in vitro and in vivo. Proc Natl Acad Sci USA 108:3665–3670 [DOI] [PMC free article] [PubMed] [Google Scholar]
- 58. Veeramani S, Yuan TC, Lin FF, Lin MF. 2008. Mitochondrial redox signaling by p66Shc is involved in regulating androgenic growth stimulation of human prostate cancer cells. Oncogene 27:5057–5068 [DOI] [PMC free article] [PubMed] [Google Scholar]
- 59. Kumar B, Koul S, Khandrika L, Meacham RB, Koul HK. 2008. Oxidative stress is inherent in prostate cancer cells and is required for aggressive phenotype. Cancer Res 68:1777–1785 [DOI] [PubMed] [Google Scholar]
- 60. Dolado I, Swat A, Ajenjo N, De Vita G, Cuadrado A, Nebreda AR. 2007. p38α MAP kinase as a sensor of reactive oxygen species in tumorigenesis. Cancer Cell 11:191–205 [DOI] [PubMed] [Google Scholar]
- 61. Knudsen KE, Scher HI. 2009. Starving the addiction: new opportunities for durable suppression of AR signaling in prostate cancer. Clin Cancer Res 15:4792–4798 [DOI] [PMC free article] [PubMed] [Google Scholar]
- 62. Chhipa RR, Wu Y, Ip C. 2011. AMPK-mediated autophagy is a survival mechanism in androgen-dependent prostate cancer cells subjected to androgen deprivation and hypoxia. Cell Signal 23:1466–1472 [DOI] [PMC free article] [PubMed] [Google Scholar]
- 63. Klionsky DJ, Abdalla FC, Abeliovich H, Abraham RT, Acevedo-Arozena A, Adeli K, Agholme L, Agnello M, Agostinis P, Aguirre-Ghiso JA, Ahn HJ, Ait-Mohamed O, Ait-Si-Ali S, Akematsu T, Akira S, Al-Younes HM, Al-Zeer MA, Albert ML, Albin RL, Alegre-Abarrategui J, Aleo MF, Alirezaei M, Almasan A, Almonte-Becerril M, Amano A, et al. 2012. Guidelines for the use and interpretation of assays for monitoring autophagy. Autophagy 8:445–544 [DOI] [PMC free article] [PubMed] [Google Scholar]
- 64. Mizushima N, Yoshimori T, Levine B. 2010. Methods in mammalian autophagy research. Cell 140:313–326 [DOI] [PMC free article] [PubMed] [Google Scholar]
- 65. Singh R, Kaushik S, Wang Y, Xiang Y, Novak I, Komatsu M, Tanaka K, Cuervo AM, Czaja MJ. 2009. Autophagy regulates lipid metabolism. Nature 458:1131–1135 [DOI] [PMC free article] [PubMed] [Google Scholar]
- 66. Sinha RA, You SH, Zhou J, Siddique MM, Bay BH, Zhu X, Privalsky ML, Cheng SY, Stevens RD, Summers SA, Newgard CB, Lazar MA, Yen PM. 2012. Thyroid hormone stimulates hepatic lipid catabolism via activation of autophagy. J Clin Invest 122:2428–2438 [DOI] [PMC free article] [PubMed] [Google Scholar]
- 67. Kabeya Y, Mizushima N, Ueno T, Yamamoto A, Kirisako T, Noda T, Kominami E, Ohsumi Y, Yoshimori T. 2000. LC3, a mammalian homologue of yeast Apg8p, is localized in autophagosome membranes after processing. EMBO J 19:5720–5728 [DOI] [PMC free article] [PubMed] [Google Scholar]
- 68. Tanida I, Minematsu-Ikeguchi N, Ueno T, Kominami E. 2005. Lysosomal turnover, but not a cellular level, of endogenous LC3 is a marker for autophagy. Autophagy 1:84–91 [DOI] [PubMed] [Google Scholar]
- 69. Pankiv S, Clausen TH, Lamark T, Brech A, Bruun JA, Outzen H, Øvervatn A, Bjørkøy G, Johansen T. 2007. p62/SQSTM1 binds directly to Atg8/LC3 to facilitate degradation of ubiquitinated protein aggregates by autophagy. J Biol Chem 282:24131–24145 [DOI] [PubMed] [Google Scholar]
- 70. Heaton NS, Randall G. 2010. Dengue virus-induced autophagy regulates lipid metabolism. Cell Host Microbe 8:422–432 [DOI] [PMC free article] [PubMed] [Google Scholar]
- 71. Le Lay S, Briand N, Blouin CM, Chateau D, Prado C, Lasnier F, Le Liepvre X, Hajduch E, Dugail I. 2010. The lipoatrophic caveolin-1 deficient mouse model reveals autophagy in mature adipocytes. Autophagy 6:754–763 [DOI] [PubMed] [Google Scholar]
- 72. Shin KJ, Wall EA, Zavzavadjian JR, Santat LA, Liu J, Hwang JI, Rebres R, Roach T, Seaman W, Simon MI, Fraser ID. 2006. A single lentiviral vector platform for microRNA-based conditional RNA interference and coordinated transgene expression. Proc Natl Acad Sci USA 103:13759–13764 [DOI] [PMC free article] [PubMed] [Google Scholar]
- 73. Heemers H, Maes B, Foufelle F, Heyns W, Verhoeven G, Swinnen JV. 2001. Androgens stimulate lipogenic gene expression in prostate cancer cells by activation of the sterol regulatory element-binding protein cleavage activating protein/sterol regulatory element-binding protein pathway. Mol Endocrinol 15:1817–1828 [DOI] [PubMed] [Google Scholar]
- 74. Heemers H, Vanderhoydonc F, Roskams T, Shechter I, Heyns W, Verhoeven G, Swinnen JV. 2003. Androgens stimulate coordinated lipogenic gene expression in normal target tissues in vivo. Mol Cell Endocrinol 205:21–31 [DOI] [PubMed] [Google Scholar]
- 75. Scherz-Shouval R, Shvets E, Fass E, Shorer H, Gil L, Elazar Z. 2007. Reactive oxygen species are essential for autophagy and specifically regulate the activity of Atg4. EMBO J 26:1749–1760 [DOI] [PMC free article] [PubMed] [Google Scholar]
- 76. Huang WC, Li X, Liu J, Lin J, Chung LW. 2012. Activation of androgen receptor, lipogenesis, and oxidative stress converged by SREBP-1 is responsible for regulating growth and progression of prostate cancer cells. Mol Cancer Res 10:133–142 [DOI] [PMC free article] [PubMed] [Google Scholar]
- 77. Veeramani S, Chou YW, Lin FC, Muniyan S, Lin FF, Kumar S, Xie Y, Lele SM, Tu Y, Lin MF. 2012. Reactive oxygen species induced by p66Shc longevity protein mediate nongenomic androgen action via tyrosine phosphorylation signaling to enhance tumorigenicity of prostate cancer cells. Free Radic Biol Med 53:95–108 [DOI] [PMC free article] [PubMed] [Google Scholar]
- 78. Mizushima N, Levine B, Cuervo AM, Klionsky DJ. 2008. Autophagy fights disease through cellular self-digestion. Nature 451:1069–1075 [DOI] [PMC free article] [PubMed] [Google Scholar]
- 79. Bennett HL, Fleming JT, O'Prey J, Ryan KM, Leung HY. 2010. Androgens modulate autophagy and cell death via regulation of the endoplasmic reticulum chaperone glucose-regulated protein 78/BiP in prostate cancer cells. Cell Death Dis 1:e72. [DOI] [PMC free article] [PubMed] [Google Scholar]
- 80. Li M, Jiang X, Liu D, Na Y, Gao GF, Xi Z. 2008. Autophagy protects LNCaP cells under androgen deprivation conditions. Autophagy 4:54–60 [DOI] [PubMed] [Google Scholar]
- 81. Ray PD, Huang BW, Tsuji Y. 2012. Reactive oxygen species (ROS) homeostasis and redox regulation in cellular signaling. Cell Signal 24:981–990 [DOI] [PMC free article] [PubMed] [Google Scholar]
- 82. Klionsky DJ, Baehrecke EH, Brumell JH, Chu CT, Codogno P, Cuervo AM, Debnath J, Deretic V, Elazar Z, Eskelinen EL, Finkbeiner S, Fueyo-Margareto J, Gewirtz D, Jäättelä M, Kroemer G, Levine B, Melia TJ, Mizushima N, Rubinsztein DC, Simonsen A, Thorburn A, Thumm M, Tooze SA. 2011. A comprehensive glossary of autophagy-related molecules and processes (2nd edition). Autophagy 7:1273–1294 [DOI] [PMC free article] [PubMed] [Google Scholar]
- 83. Sarker D, Reid AH, Yap TA, de Bono JS. 2009. Targeting the PI3K/AKT pathway for the treatment of prostate cancer. Clin Cancer Res 15:4799–4805 [DOI] [PubMed] [Google Scholar]
- 84. Brusselmans K, Timmermans L, Van de Sande T, Van Veldhoven PP, Guan G, Shechter I, Claessens F, Verhoeven G, Swinnen JV. 2007. Squalene synthase, a determinant of Raft-associated cholesterol and modulator of cancer cell proliferation. J Biol Chem 282:18777–18785 [DOI] [PubMed] [Google Scholar]
- 85. Stanbrough M, Bubley GJ, Ross K, Golub TR, Rubin MA, Penning TM, Febbo PG, Balk SP. 2006. Increased expression of genes converting adrenal androgens to testosterone in androgen-independent prostate cancer. Cancer Res 66:2815–2825 [DOI] [PubMed] [Google Scholar]
- 86. Mostaghel EA, Page ST, Lin DW, Fazli L, Coleman IM, True LD, Knudsen B, Hess DL, Nelson CC, Matsumoto AM, Bremner WJ, Gleave ME, Nelson PS. 2007. Intraprostatic androgens and androgen-regulated gene expression persist after testosterone suppression: therapeutic implications for castration-resistant prostate cancer. Cancer Res 67:5033–5041 [DOI] [PubMed] [Google Scholar]
- 87. Locke JA, Guns ES, Lubik AA, Adomat HH, Hendy SC, Wood CA, Ettinger SL, Gleave ME, Nelson CC. 2008. Androgen levels increase by intratumoral de novo steroidogenesis during progression of castration-resistant prostate cancer. Cancer Res 68:6407–6415 [DOI] [PubMed] [Google Scholar]
- 88. Kotzerke J, Volkmer BG, Neumaier B, Gschwend JE, Hautmann RE, Reske SN. 2002. Carbon-11 acetate positron emission tomography can detect local recurrence of prostate cancer. Eur J Nucl Med Mol Imaging 29:1380–1384 [DOI] [PubMed] [Google Scholar]
- 89. Liu Y. 2006. Fatty acid oxidation is a dominant bioenergetic pathway in prostate cancer. Prostate Cancer Prostatic Dis 9:230–234 [DOI] [PubMed] [Google Scholar]
- 90. Oyama N, Akino H, Kanamaru H, Suzuki Y, Muramoto S, Yonekura Y, Sadato N, Yamamoto K, Okada K. 2002. 11C-acetate PET imaging of prostate cancer. J Nucl Med 43:181–186 [PubMed] [Google Scholar]
- 91. Oyama N, Miller TR, Dehdashti F, Siegel BA, Fischer KC, Michalski JM, Kibel AS, Andriole GL, Picus J, Welch MJ. 2003. 11C-acetate PET imaging of prostate cancer: detection of recurrent disease at PSA relapse. J Nucl Med 44:549–555 [PubMed] [Google Scholar]
- 92. Pinthus JH, Lu JP, Bidaisee LA, Lin H, Bryskine I, Gupta RS, Singh G. 2007. Androgen-dependent regulation of medium and long chain fatty acids uptake in prostate cancer. Prostate 67:1330–1338 [DOI] [PubMed] [Google Scholar]
Associated Data
This section collects any data citations, data availability statements, or supplementary materials included in this article.