

Abstract
Biased G protein-coupled receptor agonists are orthosteric ligands that possess pathway-selective efficacy, activating or inhibiting only a subset of the signaling repertoire of their cognate receptors. In vitro, d-Trp12,Tyr34-bPTH(7–34) [bPTH(7–34)], a biased agonist for the type 1 PTH receptor, antagonizes receptor-G protein coupling but activates arrestin-dependent signaling. In vivo, both bPTH(7–34) and the conventional agonist hPTH(1–34) stimulate anabolic bone formation. To understand how two PTH receptor ligands with markedly different in vitro efficacy could elicit similar in vivo responses, we analyzed transcriptional profiles from calvarial bone of mice treated for 8 wk with vehicle, bPTH(7–34) or hPTH(1–34). Treatment of wild-type mice with bPTH(7–34) primarily affected pathways that promote expansion of the osteoblast pool, notably cell cycle regulation, cell survival, and migration. These responses were absent in β-arrestin2-null mice, identifying them as downstream targets of β-arrestin2-mediated signaling. In contrast, hPTH(1–34) primarily affected pathways classically associated with enhanced bone formation, including collagen synthesis and matrix mineralization. hPTH(1–34) actions were less dependent on β-arrestin2, as might be expected of a ligand capable of G protein activation. In vitro, bPTH(7–34) slowed the rate of preosteoblast proliferation, enhanced osteoblast survival when exposed to an apoptotic stimulus, and stimulated cell migration in wild-type, but not β-arrestin2-null, calvarial osteoblasts. These results suggest that bPTH(7–34) and hPTH(1–34) affect bone mass in vivo through predominantly separate genomic mechanisms created by largely distinct receptor-signaling networks and demonstrate that functional selectivity can be exploited to change the quality of G protein-coupled receptor efficacy.
PTH is an 84-amino acid peptide that serves as the principal regulator of calcium and phosphate homeostasis. It acts via type 1 PTH receptors (PTH1Rs) that are highly expressed in kidney and bone. PTH directly stimulates bone-forming osteoblasts, promoting the deposition of new bone matrix and accelerating the rate of mineralization by increasing both osteoblast number and activity. At the same time, PTH indirectly accelerates bone resorption by stimulating osteoblasts to secrete soluble osteoclast-activating factors, e.g. receptor activator of nuclear factor-κB (NFκB) ligand (RANKL), that promote the recruitment, differentiation, and activity of bone-resorbing osteoclasts. Given that its effects on osteoblast and osteoclast activity are coupled, the net effect of PTH on bone mass, either accrual or resorption, is a function of the magnitude and timing of PTH exposure (1–3). Continuous exposure to PTH, as occurs in the setting of primary hyperparathyroidism, leads to net bone resorption, whereas intermittent exposure produces bone formation in excess of resorption and a net increase in bone mass. This latter phenomenon is exploited clinically in the treatment of osteoporosis using daily injections of the N-terminal fragment of human PTH, hPTH(1–34).
N-terminal PTH analogs, e.g. hPTH(1–34), act as conventional agonists, eliciting the full range of PTH1R signaling. hPTH(1–34) activates the Gs-adenylyl cyclase-protein kinase A (PKA) and Gq/11-phospholipase Cβ-protein kinase C (PKC) pathways and promotes β-arrestin-dependent receptor desensitization and internalization (4, 5). hPTH(1–34) also stimulates the ERK1/2 MAPK cascade by two temporally distinct mechanisms; a G protein-dependent pathway that involves PKA or PKC in a cell type-specific manner, and a G protein-independent arrestin-mediated pathway (6–8). However, the signaling output of the PTH1R is sensitive to changes in ligand structure, and the G protein-dependent and arrestin-dependent actions of PTH are dissociable using PTH analogs that selectively induce Gs-, Gq/11- or arrestin-coupled conformations of the receptor (8–11).
We have previously reported that a truncated N-terminal fragment of bovine PTH (d-Trp12, Tyr34)-bPTH (7–34) [bPTH (7–34)], behaves as an inverse agonist for PTH1R-Gs coupling while activating β-arrestin-dependent signaling pathways (8). When intermittently administered to wild-type mice, bPTH(7–34), like hPTH(1–34), increases osteoblast number and promotes bone formation despite its antagonism of Gs-cAMP signaling (12). Unlike hPTH(1–34), bPTH(7–34) does not increase osteoclast number or indices of bone resorption, suggesting that it may possess a unique mechanism of action. To understand how two ligands with qualitatively different efficacy profiles, acting through the same endogenous receptor, each promote bone formation in vivo, we compared changes in the calvarial bone transcriptome of wild-type and β-arrestin2-null mice with vehicle, bPTH(7–34) or hPTH(1–34), and analyzed the resulting gene expression profiles to identify regulation of functional gene clusters that were common or unique to each ligand. Surprisingly, we find that the arrestin pathway-selective ligand produces a transcriptomic signature with limited overlap with that produced by the conventional agonist, suggesting that the two ligands have markedly different mechanisms of action at the tissue level. These findings suggest that biased agonists can be employed to qualitatively change G protein-coupled receptor (GPCR) signaling in vivo.
Materials and Methods
Animals and drug treatment
The derivation of β-arrestin2-null mice was previously described (13). Mice were backcrossed for greater than nine generations onto a C57BL/6J background. Mice were maintained under standard nonbarrier conditions, fed rodent chow (LabDiet, PMI Nutrition International, St. Louis, MO), and had access to water ad libitum. Human PTH (1–34) (40 μg/kg·d), bovine (d-Trp12, Tyr34)-PTH(7–34) (40 μg/kg·d), or PBS vehicle was administered to 9-wk-old male mice via ip injection, daily for 8 wk. Animal protocols were approved by the institutional animal care and use committee at Duke University School of Medicine and were in accordance with the NIH Guide for the Care and Use of Laboratory Animals.
Calvarial mRNA isolation
Total cellular RNA was isolated from the calvaria of mice treated for 8 wk with vehicle, hPTH(1–34), or bPTH(7–34). RNA was isolated by previously described standard methods (14). Tissue samples were thawed in TRIzol reagent (Invitrogen, Carlsbad, CA) and homogenized. RNA extraction was performed according to the TRIzol manufacturer's protocol. The total RNA was analyzed for concentration (ng/μl) and purity (ratios of 260/280 nm and 260/230 nm) using a NanoDrop 1000 Spectrophotometer (Thermo Scientific, Wilmington, DE). RNA integrity was analyzed using the Experion RNA HighSens Analysis Kit (Bio-Rad Laboratories, Inc., Hercules CA).
RT-PCR analysis of osteoblast-specific mRNA abundance
Abundance of 10 osteoblast-specific marker genes was determined using custom RT-PCR arrays (SABiosciences, Frederick, MD). Total calvarial RNA (1 μg) was used for reverse transcriptase reactions performed with the iScript cDNA Synthesis Kit (Bio-Rad Laboratories) according to manufacturer instructions. Real time quantitative PCR was performed using a Bio-Rad iCycler and the iQ SYBR Green Supermix reaction kit (Bio-Rad Laboratories, Inc., Hercules CA). Fold changes in gene expression relative to vehicle-treated samples were calculated as 2(Housekeeping Ct − Gene Ct) using RT2 Profiler Data Analysis Software (SABiosciences, Frederick, MD) with 18S RNA as the housekeeping gene.
Protein immunoblotting
Calvaria were pulverized on dry ice in a glass Dounce homogenizer and proteins were extracted for 30 min on wet ice in 200 μl of protein extraction buffer [2% sodium dodecyl sulfate; 2 m urea; 10 mm Tris-HCl (pH 6.8); 1 mm phenylmethlysulfonylfluoride]. Homogenates were clarified by microcentrifugation for 10 min at 15,000 rpm, and the buffer composition was adjusted to 10% glycerol, 10 mm dithiothreitol, and 0.0025% bromophenol blue for SDS-PAGE. Samples were resolved on 4–20% Tris-glycine gradient gels and transferred to nitrocellulose using an Invitrogen iBlot apparatus. Test samples were immunoblotted for glyceraldehyde-3-phosphate dehydrogenase (GAPDH; Cell Signaling Technology, Danvers, MA), and extracts were adjusted for equal GAPDH content before determining the abundance of other cellular or matrix proteins relative to GAPDH. Filters were probed with rabbit polyclonal IgG to procollagen 1 type 1a (Pro-COL1A1; Santa Cruz Biotechnology, Inc., Santa Cruz, CA), IGF 1 receptor β subunit (IGF-1Rβ; Santa Cruz Biotechnology, Inc.), cyclin-dependent kinase inhibitor 1A (CDKN1A; Santa Cruz Biotechnology, Inc.), or dentin matrix protein 1 (DMP-1; Abcam, Inc., Cambridge, MA) as appropriate, using horseradish peroxidase-conjugated goat antirabbit IgG (Cell Signaling Technology) as secondary antibody. Immunoblots were developed using SuperSignal West Pico ECL reagent (Thermo Fisher Scientific, Rockford, IL), exposed to x-ray film, and band intensities were quantified using a Kodak Image Station (Eastman-Kodak, Rochester, NY).
Gene array analysis
RNA samples were hybridized to GeneChip Mouse Genome 430 2.0 arrays (Affymetrix, Santa Clara, CA) in the Duke Microarray Facility of the Duke Institute for Genome Sciences and Policy. Three replicates were performed for each condition. Gene expression data are available via the NIH Gene Expression Omnibus [GEO file GSE35181]. Raw hybridization intensity data were log transformed and normalized to yield Z-scores, which in turn were used to calculate a Z-ratio value for each gene with respect to the control gene set. The Z-ratio was calculated as the difference between the observed gene Z-scores for the experimental and the control comparisons divided by the sd associated with the distribution of these differences. A single round of ANOVA was performed to generate a primary list of Z-ratios. Z-ratio values equal to or greater than +1.5 or equal to or less than −1.5 were chosen as cutoff values, defining increased and decreased expression, respectively. This eliminates spurious observations of high fold changes from genes of low intensities comparable with the background. The filtered genes were then tested for P values and Z-ratios. The P values test for repeatability of the intensity of a gene between replicate arrays, whereas the Z-ratios are a measure of fold change between treatments. Individual Z-ratios were divided by the sd of all genes on an array to determine whether a given ratio was statistically significant (P < 0.05) considering the array as a whole. Differentially regulated genes that failed to meet the 0.05 criteria were discarded.
Gene cluster analysis
Genes were clustered using several analytical techniques to avoid individual dataset biases. Complete lists of significantly regulated genes were clustered into significantly populated biological process Gene Ontology (GO) term groups. Significant population of these GO term groups was based upon the following criteria, equal to two or more than two genes per group, P < 0.05 enrichment from the murine background genome set; WebGestalt (http://bioinfo.vanderbilt.edu/webgestalt). A hybrid GO term group population score was then created for each significantly populated group as follows; hybrid score = −log10(p)x GO term enrichment factor (R), where P is the enrichment probability and R is the number of observed genes in that GO term group per expected gene number in that GO term group (15). For signaling pathway analysis, genes were clustered using a similar cutoff criteria for GO term biological process clustering, i.e. equal to or more than two genes per group, P < 0.05 enrichment compared with a standard murine background database collated using primarily Ingenuity Pathway analysis (www.ingenuity.com/). Parametric gene set enrichment analysis uses cellular pathways common to multiple sources; KEGG (Kyoto Encyclopedia of Genes and Genomes; www.genome.jp/kegg), BioCarta (www.biocarta.com/), Molecular Signatures Data Base (www.broadinstitute.org/gsea/msigdb/), and Ingenuity Pathway Analysis (www.ingenuity.com/). A hybrid score system was also used to demonstrate signaling pathway enrichment (−log10(p) × pathway enrichment ratio). The Jackson Laboratory Mouse Genome Informatics (http://www.informatics.jax.org) mammalian phenotype database was employed to obtain data for curated bone-related murine genomic data.
Analysis of transcription factor-binding motifs
A program combining comparative genomics with de novo motif discovery using an eight-species (human, chimp, mouse, rat, dog, chicken, fugu, and zebrafish) genome comparison of 5000-bp sequences upstream of annotated transcription starts of human RefSeq genes was used to derive human conserved promoter regions (16). Identification of overrepresented motifs in upstream of coregulated gene sets was performed using the exhaustive oligomer enumeration technique, as described elsewhere (16). The algorithm is a modification of the Weeder program (17) to cope with the masked bases and gaps in upstream sequences.
Isolation of primary osteoblasts
Primary osteoblasts were isolated from the calvaria of 8-d-old β-arrestin2-null and wild-type C57BL/6 mice with established procedures (18). Calvaria underwent sequential digestion in 0.05% trypsin, 0.1% collagenase at 37 C, and the isolated osteoblasts were cultured in α-MEM supplemented with 10% fetal bovine serum, 100 U/ml penicillin, and 100 μg/ml streptomycin. All experiments were performed on cells at passage 2. Where appropriate, cultures were grown to confluence and differentiated for 10 d in growth medium supplemented with 5 mm β-glycerophosphate and 50 μg/ml l-ascorbic acid.
Luciferase reporter assays
Regulation of cAMP response element-binding protein (CREB)-, nuclear factor of activated T-cells (NFAT)-, Elk-1/serum response factor (SRF)-, and signal transducer and activator of transcription (STAT)1/2-dependent transcription was assayed using lentiviral Cignal Lenti Reporters (SABiosciences). Calvarial osteoblasts were plated in 96-well plates, grown to confluence, and then differentiated for 10 d. Lentiviral transduction was carried out according to the manufacturer's protocol using the Cignal Lenti green fluorescent protein-positive control to optimize transduction conditions. The STAT5A firefly luciferase reporter plasmid, pGL4-LHRE (19) was the generous gift of Dr. C. V. Clevenger (Northwestern University, Evanston, IL). Osteoblasts were cotransfected with GL4-LHRE and the constitutively expressed Renilla luciferase plasmid, pGL4.75 (Promega Corp., Madison, WI) using Lipofectamine transfection reagent (Invitrogen) per the manufacturer's protocol. Forty eight hours after transduction or transfection, osteoblasts were serum deprived for an additional 24 h in differentiation medium supplemented with 0.1% BSA. Stimulations were performed with hPTH(1–34) (0.1 μm) or bPTH(7–34) (1 μm) for 8 h, after which cells were lysed in 40 μl of 1× positive lysis buffer. Firefly and Renilla luciferase activities were determined sequentially in each assay plate using the Dual Luciferase Reporter assay system (Promega Corp) in an LMAX II384 luminometer (Molecular Devices, Sunnyvale, CA). Firefly luciferase activity in each well was normalized to Renilla luciferase activity to correct for transduction/transfection efficiency.
Osteoblast proliferation
Cell proliferation was assessed using the 3-[4,5-dimethylthiazol-2-y]-2,5-diphenyltetrazolium bromide (MTT) proliferation assay (Roche Applied Science, Indianapolis, IN) per the manufacturer's protocol. Calvarial osteoblasts were seeded in 96-well plates (1 × 10³ cells per well) and maintained in growth medium without β-glycerophosphate or l-ascorbic acid for 1–6 d with or without PTH1R agonist. After treatment, 10 μl/well of MTT solution was added, and cells were incubated at 37 C for an additional 3 h to allow the formation of formazan crystals, after which plate absorbance at 570 nm was measured on an 96-well microplate reader (BMG Labtech, Inc., Cary, NC).
Osteoblast apoptosis
Antiapoptotic effects of agonist treatment were determined by challenging cells with an apoptotic stimulus. Primary osteoblasts were seeded in 96-well plates (1 × 10⁴ cells per well) grown for 24 h. The cells were then are rendered quiescent in serum free α-MEM for 8 h before treatment with agonist. Apoptosis was induced 5 min after initial agonist exposure by the addition of etoposide (50 μm). Apoptosis was assayed at 18 and 36 h using the Cell Death Detection ELISA kit (Roche Applied Science) according to the manufacturer's protocol.
Osteoblast migration
Agonist effects on random migration of osteoblasts were determined utilizing a real-time image-based scratch assay. Calvarial osteoblasts were seeded in 12-well cell culture plates (6 × 10⁵ cells per well) to create a confluent monolayer. After incubation for 24 h, the monolayers were uniformly scratched with a p200 micropipettor tip, and cellular debris was removed by washing with growth media. After addition of agonist to appropriate wells, plates were maintained for 18–24 h at 37 C, 5% CO2 in the incubation chamber of a Zeiss Axio Observer Z1 Live Cell Station system (Carl Zeiss MicroImaging, LLC., Thornwood, NY). Serial images of cell migration at three different positions per well were acquired every 30 min. Images were analyzed using MetaMorph Premier 7.6.5 and TScratch software.
Results
Both hPTH(1–34) and bPTH(7–34) stimulate anabolic bone formation when administered to mice
Table 1 summarizes the reported actions of hPTH(1–34) and bPTH(7–34) in vitro and in vivo (8, 12). Short-term stimulation of differentiated primary calvarial osteoblasts from wild-type C57BL/6 or congenic β-arrestin2-null mice with hPTH(1–34) increases cAMP production and phosphatidylinositol hydrolysis, reflecting activation of Gs and Gq/11 signaling, respectively. hPTH(1–34) also activates ERK1/2 in both backgrounds. Whereas ERK1/2 activation in wild-type cells reflects both G protein- and arrestin-dependent components, hPTH(1–34) stimulated ERK1/2 activation in β-arrestin2-null osteoblasts is exclusively G protein mediated (8). In contrast, bPTH(7–34) fails to stimulate cAMP production and phosphatidylinositol hydrolysis in wild-type osteoblasts and lowers basal cAMP levels in the knockouts, identifying it as an inverse agonist for PTH1R-Gs coupling (8, 20). bPTH(7–34) activates ERK1/2 only in wild-type osteoblasts, because without the ability to activate G proteins its actions are dependent on β-arrestin2 (8). This reversal of efficacy, wherein a ligand antagonizes receptor coupling to one set of effectors while promoting activation of another, defines bPTH(7–34) as an arrestin pathway-selective biased agonist.
Table 1.
Physiological Responses to PTH Analogues In Vitro and In Vivo
| Wild Type |
β-arrestin 2 −/− |
|||
|---|---|---|---|---|
| hPTH(1–34) | bPTH(7–34) | hPTH(1–34) | bPTH(7–34) | |
| Calvarial osteoblasts in vitro | ||||
| cAMP | +++ | NS | +++ | − |
| PI hydrolysis | ++ | NS | ++ | NS |
| ERK1/2 phosphorylation | ++ | ++ | ++ | NS |
| Trabecular bone-tibia | ||||
| BV/TV | +++ | +++ | +++ | NS |
| Trabecular thickness | ++ | NS | ++ | NS |
| Trabecular number | NS | ++ | + | NS |
| Cortical bone-femur | ||||
| Periostial circumference | + | NS | NS | − |
| Cortical thickness | ++ | NS | NS | − |
| Histomorphometry | ||||
| Osteoblast number | +++ | +++ | + | NS |
| Osteoid surface | +++ | ++ | ++ | NS |
| Osteoclast number | ++ | NS | + | −− |
| Mineral apposition | ||||
| Mineral apposition rate | ++ | ++ | ++ | NS |
| Bone formation rate | ++ | ++ | ++ | NS |
| Bone turnover markers | ||||
| Serum osteocalcin | ++ | ++ | ++ | NS |
| Urine DPD | ++ | NS | ++ | NS |
| 24 h Urine calcium | ++ | NS | ++ | NS |
+ to +++, Increased relative to vehicle-treated; − to −−, decreased relative to vehicle treated; NS, no significant change relative to vehicle treated (P > 0.05).
Wild-type C57BL/6 mice given daily injections of 40 μg/kg hPTH(1–34) for 8 wk exhibit a net increase in bone mass (1–3, 12). Trabecular bone volume and cortical thickness increase, changes that are accompanied by increases in osteoblast number, osteoid surface, serum osteocalcin level, and mineral apposition rate. Reflective of PTH1R-mediated osteoblast-osteoclast coupling, osteoclast numbers increase, along with urinary deoxypyrodiniline, a marker of accelerated bone resorption. Urine calcium excretion (24 h) also rises, reflecting the net effect of PTH on intestinal calcium absorption and renal tubular calcium resorption. β-Arrestin2-null mice exhibit an impaired anabolic response to hPTH(1–34), with blunted increases in trabecular bone volume and no change in cortical thickness compared with controls. The attenuated response is associated with smaller changes in osteoblast number and osteoid deposition, but preserved or exaggerated increases in osteoclast number and urine deoxypyrodiniline (12, 21, 22). Wild-type mice treated with the same 40 μg/kg·d dose of bPTH(7–34) also show increased bone formation characterized by greater trabecular bone volume and increased osteoblast number, osteoid surface, serum osteocalcin, and mineral apposition rate (12). Although similar to the response to hPTH(1–34), some differences are apparent. bPTH(7–34) primarily increases trabecular number, whiereas hPTH (1–34) has larger effects on trabecular thickness. Unlike hPTH(1–34), bPTH(7–34) does not significantly affect cortical bone. More dramatically, bPTH(7–34) has no significant effect on osteoclast number or bone turnover markers. All responses to bPTH(7–34) are either absent or reversed in β-arrestin2 null mice, consistent with the hypothesis that arrestin signaling in vivo contributes to the anabolic response to PTH and is sufficient to promote osteoblastic bone formation, but not to stimulate osteoclastic bone resorption.
Effect of β-arrestin2 expression on the bone transcriptome during physiological homeostasis
β-Arrestin2-null mice are normocalcemic and have normal skeletal structure (12). Their circulating levels of endogenous PTH are lower, presumably in compensation for impaired desensitization of PTH-stimulated G protein activation (23). Nonetheless, basal rates of bone turnover are higher (12, 24). Osteoid surface and osteocalcin mRNA levels are increased, consistent with an increased rate of bone formation. At the same time bone resorption is accelerated, as evidenced by increased osteoclast surface, marrow osteoclast precursors, and bone turnover markers. To characterize the effects of β-arrestin2 on gene expression in bone under homeostatic conditions, cRNA probes generated from calvarial mRNA of wild-type and β-arrestin2-null mice were hybridized to Affymetrix GeneChip Mouse Genome 430 2.0 arrays in triplicate. Figure 1A depicts a heat map of the differences in the global mRNA expression profile caused by the presence or absence of β-arrestin2.
Fig. 1.
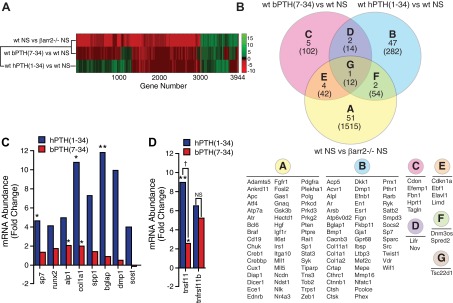
Genomic effects of β-arrestin2 expression and PTH1R ligand treatment. A, Heat map of changes in the global calvarial transcriptome resulting from β-arrestin2 expression and agonist treatment. Gene expression data were obtained from Affymetrix GeneChip Mouse Genome 430 2.0 arrays run in triplicate for each experimental condition. The effect of β-arrestin2 expression under basal conditions was determined by comparing vehicle-treated wild-type and β-arrestin2-null mice (wt NS vs. βarr2−/−NS). For this comparison, β-arrestin2-null animals were considered the control samples, such that the heat map depicts the direction of change occurring when β-arrestin2 is introduced into the null background. Effects of drug treatment were determined by comparing drug-treated with vehicle-treated wild-type mice (wt bPTH(7–34) vs. wt NS; wt hPTH(1–34) vs. wt NS). Differences in the abundance of all transcripts with P ≤ 0.05 and ≥ 1.5 fold change in at least one of the three pair-wise comparisons are depicted. B, Bone-related genes regulated by bPTH(7–34) and hPTH(1–34). The regulated gene sets derived from wild-type animals treated with bPTH(7–34) (pink) or hPTH(1–34) (blue), as well as the list of genes that were differentially expressed between vehicle-treated wild-type and β-arrestin2-null mice (yellow) were used to interrogate the Jackson Laboratories Mouse Genome Informatics Mammalian Phenotypes database (http://www.informatics.jax.org/). The results were used to create a tripartite Venn diagram of genes linked to the presentation of murine phenotypes involving bone structure and metabolism (sectors A-G). The individual gene symbols corresponding to the contents of each sector are listed below. The total number of transcripts in each sector is shown in parentheses. C, Calvarial mRNA from vehicle- and agonist-treated wild-type mice was subjected to quantitative PCR analysis of eight osteoblast-specific transcripts: Osterix (Sp7), Runx2 (Runx2), bone-specific alkaline phosphatase (Alp1), collagen type 1a1 (Col1a1), osteopontin (Spp1), osteocalcin (Bglap), DMP-1 (Dmp1), and sclerostin (Sost). Mean data from three to four mice per treatment condition are shown as the fold change relative to vehicle-treated animals. D, Quantitative PCR analysis of agonist effects on calvarial RANKL (Tnsf11) and osteoprotegerin (Tnfrsf11b) mRNA levels. Mean data from three to four mice per treatment condition are shown as the fold change relative to vehicle-treated animals. **, P < 0.01; *, P < 0.05 greater than vehicle-treated; †, P < 0.05 less than hPTH(1–34) treated; NS, no significant change.
To gain insight into how the cumulative changes in individual mRNA species affects bone metabolism, the set of differentially expressed transcripts was analyzed by parametric gene set enrichment analysis of classical signaling pathways represented in the Broad Institute Molecular Signatures and Ingenuity Pathways Analysis databases. In total, 1646 genes met the criteria for significant change (Z-ratio ≥ +1.5 or ≤ −1.5; P < 0.05), with 478 up-regulated and 1168 down-regulated transcripts. Gene clusters that were significantly different between untreated wild-type and β-arrestin2-null animals included pathways related to signal transduction, growth factor signaling, nuclear receptor signaling and cell cycle control (Supplemental Fig. 1A published on The Endocrine Society's Journals Online website at http://mend.endojournals.org). Notably, arrestins have been reported to positively or negatively regulate many of the pathways where change was observed, including ERK/MAPK signaling (25, 26), stress-activated protein kinase/c-Jun N-terminal kinase signaling (27, 28), p38 MAPK signaling (29), p53 signaling (30), NFκB signaling (31, 32), TGF-β signaling (33), Sonic Hedgehog signaling (34, 35), G protein-coupled receptor signaling (36), cAMP signaling (37), calcium signaling (38), IGF-1 signaling (39, 40), epidermal growth factor (EGF) signaling (41), and androgen signaling (42). Table 2 lists the individual gene symbols and direction of change of transcripts populating selected classical signaling pathway gene clusters that were different between wild-type and β-arrestin2-null mice.
Table 2.
Regulated Canonical Pathway Genes: Wild Type vs. βarr2−/−
| Signal transduction | |
|---|---|
| p53 signaling | AKT2, ATR, BCL2, BCL2L1, CDK4, CDKN1A, CTNNB1, EP300, PIK3CA, GADD45A, GSK3B, HIPK2, KAT2B, MAPK8, MED1, PIK3CG, PIK3R1, PTEN, STAG1 |
| PTEN signaling | AKT2, BCL2, BCL2L1, BCL2L11, CDKN1A, CHUK, CSNK2A2, FOXO1, GSK3B, INSR, MAGI3, MAPK6, PDGFRA, PDPK1, PIK3CA, PIK3CG, PIK3R1, PTEN, RPS6KB1, SHC1 |
| SAPK/JNK Signaling | GADD45A, GNA12, GNA13, GNB1, IRS1, MAP3K1, MAP3K2, MAP3K3, MAP3K5, MAP3K9, MAP3K10, MAP4K2, MAP4K4, MAPK8, PIK3CA, PIK3CG, PIK3R1, SHC1, TRAF1 |
| PI3K/AKT signaling | AKT2, BCL2, BCL2L1, CDKN1A, CHUK, CTNNB1, EIF4E, FOXO1, GSK3B, LIMS1, MAP3K5, MAP3K8, MAPK6, PDPK1, PIK3CA, PIK3CG, PIK3R1, PTEN, RPS6KB1, SHC1, YWHAB, YWHAQ |
| ERK/MAPK signaling | ATF4, ARAF, BRAF, CREB1, EIF4E, ELF1, H3F3A, HSPB1, MAPK6, PAK3, PIK3CA, PIK3CG, PIK3R1, PPP1R12A, PRKACB, PRKCB, PRKCD, PTK2B, PXN, TLN1, RAP1B, SHC1, STAT1, STAT3, YWHAB, YWHAQ |
| NF-κB signaling | AKT2, CHUK, CREBBP, CSNK2A2, EP300, GSK3B, IL1R2, INSR, IRAK4, MALT1, MAP3K3, MAP3K8, MAPK8, MAP4K4, PDGFRA, PIK3CA, PIK3CG, PIK3R1, PRKACB, PRKCB, TRAF1 |
| ATM signaling | ATF4, CCNB1, CDKN1A, CREB1, GADD45A, MAPK8, MDM4, TLK1, TLK2 |
| TGF-β signaling | ACVR1, ACVR1B, CREBBP, EP300, INHBB, MAPK6, MAPK8, SERPINE1, SMAD3, SMAD4, SMAD5, TGFBR1, TGFBR2 |
| GPCR signaling | ADCY7, ADCY9, AKT2, ATF4, BRAF, CAMK2D, CHUK, CREB1, EDNRB, GNAQ, GPR34, MAP3K8, MAPK6, PDE4B, PDE1B, PDE7A, PDPK1, PIK3CA, PIK3CG, PIK3R1, PLCB4, PRKACB, PRKCB, PTK2B, RGS2, RGS4, SHC1, STAT3 |
| BMP signaling | CREB1, CREBBP, MAPK6, MAPK8, PRKACB, SMAD4, SMAD5 |
| Growth factors | |
| IGF-1 signaling | AKT2, CSNK2A2, FOXO1, IGF1, IGF1R, IGFBP3, IGFBP5, IRS1, IRS2, MAPK6, MAPK8, PDPK1, PIK3CA, PIK3CG, PIK3R1, PRKACB, PXN, RPS6KB1, SHC1, YWHAB, YWHAQ |
| VEGF signaling | ACTB, AKT2, BCL2, BCL2L1, EIF2S2, ELAVL1, FIGF, FLT1, FOXO1, HIF1A, MAPK6, PIK3CA, PIK3CG, PIK3R1, PRKCB, PTK2B, PXN, ROCK1, SHC1 |
| Cell cycle control | |
| Cell cycle: G2/M | ATR, EP300, CCNB1, CDKN1A, GADD45A, KAT2B, TOP2A, SKP2, YWHAB |
| Cell cycle: G1/S | ATR, CCND3, CDK4, CDK6, CDKN1A, GSK3B, SKP2, SMAD3, SMAD4 |
Underline indicates up-regulation; no underline indicates down-regulation.
To appreciate how signaling pathway regulation might integrate to create higher order activities, i.e. physiological functions, we employed biological process gene ontology (GObp) analysis. Significantly regulated GObp terms included processes falling into the broad categories of intermediary metabolism, DNA/RNA/protein synthesis and posttranslational modification, cell cycle progression, apoptosis and cell survival, cytoskeletal rearrangement, and vesicle transport (Supplemental Fig. 1B). Of these, arrestins have reported roles in the regulation of protein phosphorylation and ubiquitination (36), apoptosis (43), cellular migration/chemotaxis (44), and vesicle endocytosis/exocytosis (45, 46). Thus, our comparison of gene expression profiles in bone derived from wild-type and β-arrestin2-null mice detected changes in functional gene clusters that were consistent with many previously reported arrestin functions.
bPTH(7–34) and hPTH(1–34) elicit distinct functional genomic signatures in vivo
To compare the mechanism of action of bPTH(7–34) with that of hPTH(1–34), we analyzed changes in the calvarial transcriptome occurring when wild-type animals were treated for 8 wk with 40 μg/kg·d intermittent dosing of each ligand. Figure 1A compares the differential gene expression profiles of bPTH(7–34)- and hPTH(1–34)-treated mice with that of vehicle-treated wild-type and β-arrestin2-null mice. Hierarchical cluster analysis, which quantifies the degree of similarity between gene expression profiles, demonstrated that the changes in gene expression observed when wild-type mice were exposed to bPTH(7–34) more closely resembled the differences between vehicle-treated wild-type and β-arrestin2-null mice than they did the changes observed when wild-type mice were treated with hPTH(1–34). This suggests that administering an arrestin pathway-selective biased agonist to wild-type mice affects global gene expression in much the same way as introducing β-arrestin2 onto a null background.
To examine how PTH1R ligand treatment was affecting expression of genes with known roles in bone metabolism, we narrowed the list of all differentially expressed genes to include only those that are annotated in the Jackson Laboratories Mouse Genome Informatics Mammalian Phenotypes database as linked to phenotypes involving bone structure and metabolism. As shown in Fig. 1B, differences in the expression of 58 bone-annotated genes (Venn diagram sectors A, E, F, G) were observed between wild-type and β-arrestin2-null mice. hPTH(1–34) affected expression of 52 bone-annotated transcripts, among them bone morphogenic protein (BMP)1 (Bmp1), PTH1R (Pthr1), Vitamin D receptor (Vdr), osteocalcin (Bglap1), dentin matrix protein (Dmp1), and several collagen isoforms (Venn diagram sectors B, D, F, G). Only three of these genes overlapped with the vehicle-treated wild-type vs. β-arrestin2-null gene set (Venn diagram sectors F and G), demonstrating that pharmacological manipulation of PTH1R signaling using a conventional agonist superimposes patterns of gene expression that are largely distinct from those affected by β-arrestin2 expression in vivo. bPTH(7–34) affected the expression of only 12 bone-annotated genes (Venn diagram sectors C, D, E, G). Whereas 14% of all hPTH(1–34)-regulated genes (52 of 362) were specifically bone annotated, only 7% of bPTH (7–34)-regulated genes (12 of 170) were so annotated, and we found minimal overlap between the two lists. This suggests that the mechanism whereby bPTH(7–34) increases bone formation is largely different from hPTH(1–34) and not the result of activating classical PTH1R signaling pathways.
Figure 1C compares the effects of hPTH(1–34) and bPTH(7–34) on 10 osteoblast lineage-specific transcripts in calvarial mRNA measured using real-time PCR. Some of the mRNA species selected for analysis; i.e. osterix (Sp7), bone-specific alkaline phosphatase (Alp1), collagen type 1a1 (Col1a1), Bglap1, and Dmp1, were identified as hPTH(1–34)-regulated genes by microarray, whereas others; Runx2, osteopontin (Spp1), sclerostin (Sost), RANKL (Tnsf11), and osteoprotegerin (Tnfrsf11b) were chosen as classical markers of osteoblast differentiation and function. As shown, hPTH(1–34)-treated bone displayed larger changes in the levels of marker genes representing osteoblast progenitors (Runx2, Sp7), immature osteoblasts (Alp1, Spp1, Col1a1), mature osteoblasts (Bglap1), and osteocytes (Dmp-1, Sost), than bPTH (7–34)-treated bone. hPTH(1–34) also produced significantly greater up-regulation of the osteoclast-activating factor, RANKL, than bPTH(7–34) (Fig. 1D). Expression of the negative regulator of osteoclast activation, osteoprotegerin, did not differ between the two treatment groups, consistent with previous findings that bPTH(7–34) did not increase osteoclast activity (12).
To test the effects of arrestin expression and PTH1R ligand treatment at the protein level, immnoblots were performed using calvarial tissue samples. Vehicle-treated wild-type and β-arrestin2-null samples were blotted for two proteins that exhibited significant changes in mRNA abundance depending on β-arrestin2 expression; cyclin-dependent kinase inhibitor 1A (CDKN1A), and IGF I receptor (IGF1R). As shown in Fig. 2A, changes in CDKN1A and IGF1R protein expression followed the observed direction of change in mRNA abundance (down-regulated in β-arrestin2 null; see Table 3). Samples from wild type mice treated with vehicle, hPTH(1–34) or bPTH(7–34) were similarly blotted for proteins the mRNA abundance of which was affected by ligand treatment; COL1A1, DMP1, CDKN1A. As shown in Fig. 2B, changes in the abundance of COL1A1 [up-regulated by both hPTH(1–34) and bPTH(7–34)], DMP1 [up-regulated by hPTH(1–34)], and CDKN1A [down-regulated by bPTH(7–34)], were consistent with the microarray and real-time PCR data (see Fig. 1 and Table 3).
Fig. 2.

Effects of β-arrestin2 expression and PTH1R ligand treatment on protein expression. A, Protein extracts from calvaria of vehicle-treated wild-type and β-arrestin2-null mice were immunoblotted for CDKN1A and IGF1R. B, Calvarial protein extracts from vehicle, hPTH(1–34)-, and bPTH(7–34)-treated wild-type mice were immunoblotted for DMP1, COL1A1, and CDKN1A. In each panel, representative immunoblots (IB) are shown above a plot of the change in protein abundance from three to six separate determinations. For each sample, expression of the proteins of interest normalized to GAPDH, which was used as the loading control. *, P < 0.05 greater or less than control.
Table 3.
Individual Genes Defining Signaling Pathway Regulation by Conventional and Arrestin-Selective PTH1R agonists
| Classical Signaling Pathway | bPTH(7–34) Score | hPTH(1–34) Score | Coregulated Genes |
|---|---|---|---|
| Cell cycle: G2/M DNA damage checkpoint regulation | 32.736 | CCNB1, CDKN1A, YWHAZ, ATM | |
| ATM signaling | 11.8285 | CCNB1, CDKN1A, ATM | |
| Role of CHK proteins in cell cycle checkpoint control | 8.8788 | CDKN1A, ATM | |
| VEGF signaling | 4.6041 | ACTA2, ELAVL1, BCL2 | |
| Cell cycle: G1/S checkpoint regulation | 3.729 | CDKN1A, ATM | |
| Eicosanoid signaling | 2.4205 | YWHAZ, WISP2 | |
| ERK/MAPK signaling | 0.38272 | PAK3, YWHAZ | |
| Calcium signaling | 0.371893 | GRIA1, ACTA2 | |
| Actin cytoskeleton signaling | 0.2532 | PAK3, ACTA2 | |
| FXR/RXR activation | 0.291 | 0.548 | APOC2, LIPC, APOC2 |
| VDR/RXR activation | 2.1675 | 0.7975 | CDKN1A, IGFBP3, COL13A1, VDR |
| PI3K/AKT signaling | 2.4966 | 0.79935 | CDKN1A, YWHAZ, BCL2, RPS6KB1, CTNNB1, BCL2 |
| Integrin signaling | 1.0212 | 1.1316 | PAK3, ITGA9, ACTA2, SRC, ITGA9, ARF4, TSPAN6, TSPAN4 |
| IGF-1 signaling | 4.3758 | 1.70136 | NOV, YWHAZ, IGFBP3, RPS6KB1, NOV, CYR61 |
| p53 signaling | 4.8528 | 1.90405 | CDKN1A, ATM, BCL2, CTNNB1, BCL2, SERPINE2 |
| Ceramide Signaling | 0.39746 | 2.49186 | BCL2, S1PR3, SMPD3, BCL2 |
| PTEN signaling | 4.004 | 3.52806 | CDKN1A, BCL2L11, BCL2, RPS6KB1, MAGI2, BCL2L11, BCL2 |
| Androgen signaling | 0.79547 | SRC, AR, GNAI1 | |
| Glucocorticoid receptor signaling | 1.494 | TGFBR1, AR, HSPA1B, NFATC1, CD163, ESR1, BCL2 | |
| p38 MAPK signaling | 1.64952 | TGFBR1, PLA2G5, MEF2C | |
| RAR activation | 1.74096 | SRC, ALDH1A2, RARB, SMAD6, RBP4 | |
| Ephrin receptor signaling | 2.63648 | SRC, RGS3, SDC2, EFNB1, GNAI1, PDGFD | |
| Tight junction signaling | 4.1358 | CLDN10, TGFBR1, PVRL3, JAM2, MAGI2, CTNNB1 | |
| TGF-β signaling | 4.9755 | TGFBR1, ACVR1, SMAD6, VDR | |
| BMP signaling pathway | 5.8 | MAGED1, SMAD6, BMP8A, BMP1 | |
| Wnt/β-catenin signaling | 29.7343 | SOX17, SRC, CDH2, GJA1, WIF1, TGFBR1, CDH5, RARB, ACVR1, FZD5, DKK1, CTNNB1 |
Genes regulated by bPTH(7–34) are underlined; genes regulated by hPTH(1–34) are not underlined.
Given the divergent effects of hPTH(1–34) and bPTH(7–34) on transcripts classically associated with bone formation, we performed parametric gene set enrichment of classical signaling pathways using the complete ligand-regulated gene sets to identify alternative metabolic pathways associated with the anabolic effects of bPTH(7–34). Within the set of differentially expressed genes derived from the comparison of bPTH(7–34)-treated and vehicle-treated wild-type mice, 192 genes were significantly regulated in response to bPTH(7–34), including 47 up-regulated and 145 down-regulated transcripts. As shown in Fig. 3A (red bars), there was considerable overlap between bPTH(7–34)-regulated signaling pathways populated with these significantly regulated transcripts and those identified in the comparison of vehicle-treated wild-type and β-arrestin2-null mice (Supplemental Fig. 1A), suggesting that bPTH(7–34) might be affecting many of the same processes. Highly significant signaling terms included pathways involved in regulating apoptosis, e.g. ataxia telangectasia mutated signaling and p53 signaling; cell survival, e.g. phosphatase and tensin homolog (PTEN) signaling and phosphatidylinositol 3-kinase (PI3K)/Akt signaling; and cell cycle checkpoint regulation (47).
Fig. 3.
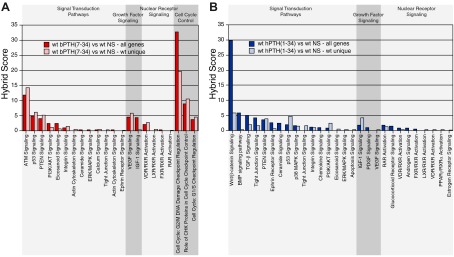
Effect of bPTH(7–34) and hPTH(1–34) treatment on signaling pathway gene clusters in wild-type and β-arrestin2-null mice. A, The gene set consisting of calvarial transcripts with significantly different expression between wild-type mice treated with bPTH(7–34) [wt bPTH(7–34)] and vehicle (wt NS) was analyzed by parametric gene set enrichment analysis. Signaling pathways corresponding to signal transduction, growth factor signaling, nuclear receptor signaling, and cell cycle control are shown (all genes; red bars). To determine which effects required β-arrestin2, the analysis was repeated using the subset of transcripts that were regulated by bPTH(7–34) in wild-type, but not β-arrestin2-null, mice (wt unique; pink bars). B, Identical analysis performed using microarray data from wild-type and β-arrestin2-null mice treated with hPTH(1–34). Gene set enrichment analysis was performed using transcripts that were differentially expressed between hPTH(1–34) and vehicle-treated wild-type mice (all genes; blue bars), or the set of transcripts that were regulated by hPTH(1–34) in wild-type, but not β-arrestin2-null, mice (wt unique; pale blue bars). Hybrid scores (−log10(p) × pathway enrichment ratio) were calculated for each significantly populated pathway and reflect the probability that the observed differences did not occur by chance. All pathways shown exceed a minimal threshold significance of P ≤ 0.05.
Because bPTH(7–34) would be expected to antagonize PTH1R-Gs coupling at the same time it engages arrestin-dependent pathways (12, 20), treatment-related changes in wild-type mice could reflect either inhibition of endogenous Gs-dependent PTH signaling or activation of arrestin signaling. However, in β-arrestin2-null animals, in which arrestin-dependent bPTH(7–34) signaling is absent (12), differences in gene expression should reflect only changes resulting from the inhibition of G protein signaling. To determine which of the observed changes reflected β-arrestin2 signaling, we assessed which responses to bPTH(7–34) occurred only in wild-type animals. To do this, we generated a wild-type unique gene set by subtracting from the parent list of all bPTH(7–34)-regulated genes any gene that was also regulated by bPTH(7–34) in β-arrestin2-null animals. Of the 192 significantly regulated genes, 78% were regulated only in wild-type mice, whereas 22% were affected in both the wild-type and β-arrestin2-null animals. We then repeated the pathways analysis using the wild-type unique gene set. As shown in Fig. 3A (pink bars), there was a high degree of correlation between the pathway-specific gene clusters identified using either the entire bPTH(7–34)-regulated gene set or the wild type-unique set, indicating that nearly all of the bPTH(7–34) effects in wild-type animals required β-arrestin2 expression. Because bPTH(7–34) is itself inhibiting Gs signaling, these responses cannot be attributed to a loss of β-arrestin2-dependent PTH1R desensitization and therefore represent candidate β-arrestin2-regulated signaling pathways in vivo.
These results were compared with identical analyses performed using the hPTH(1–34) regulated gene sets from wild-type and β-arrestin2-null animals. Because hPTH(1–34) is a conventional agonist for the PTH1R, intermittent treatment activates both G protein-dependent and arrestin-dependent signaling (8, 12). Treatment with hPTH(1–34) caused significant changes in 368 genes, with 317 up-regulated and 41 down-regulated transcripts. As shown in Fig. 3B (blue bars), hPTH(1–34) affected pathways associated with embryological skeletal patterning and PTH actions in bone, including Wnt/β-catenin signaling, BMP signaling, TGF-β signaling, PI3K/AKT signaling, and ERK/MAPK signaling (48–50). Interestingly, several of the pathways that were strongly regulated by bPTH(7–34), e.g. cell cycle checkpoint regulation, were not detected using the hPTH(1–34)-regulated gene set. We next compared wild-type and β-arrestin2-null mice to determine how β-arrestin2 expression contributed to the hPTH(1–34) response. Of the 368 significantly regulated transcripts in wild-type mice, only 46% were represented in the wild type-unique gene set, whereas 54% were also regulated by hPTH(1–34) in β-arrestin2-null animals. This suggests that many of the effects of hPTH(1–34) in bone involve G protein-dependent signals that do not require β-arrestin2. As shown in Fig. 3B (pale blue bars) there was much less concordance when the pathway analysis was repeated using the wild type-unique PTH(1–34) gene set. Whereas 91% of the signaling pathways populated after bPTH(7–34) stimulation were shared between the complete (all genes) and the β-arrestin2-specific (wt unique) gene sets, only 67% of the hPTH(1–34)-regulated pathways were shared, suggesting that the signaling actions of bPTH(7–34) are far more focused upon arrestin activity than those of hPTH(1–34). Nonetheless, β-arrestin2 appears to contribute to the hPTH(1–34) response, because some pathways, e.g. PTEN signaling and p53 signaling, were represented as robustly in the wild type-unique gene set. Although these results point to a role for β-arrestin2 in the hPTH(1–34) response, they do not directly implicate β-arrestin2 signaling, because hPTH(1–34), unlike bPTH(7–34), activates G protein-mediated pathways that are normally desensitized by arrestins. Thus, β-arrestin2 could modify the response to hPTH(1–34) either by limiting the magnitude and duration of hPTH(1–34)-mediated G protein signaling or by transmitting arrestin-dependent signals. For example, we have previously observed that reintroduction of β-arrestin2 into β-arrestin1/2 null murine embryo fibroblasts in vitro alters the contribution of transactivated EGF receptors to lysophosphatidic acid-mediated transcription by restoring receptor desensitization and limiting the duration of EGF receptor activation in response to lysophosphatidic acid (51).
We next employed GObp analysis to examine how the ligand-regulated signaling pathways may integrate at a broader, more biologically relevant, level (Supplemental Fig. 2). bPTH(7–34) prominently affected processes related to cell cycle progression, apoptosis/cell survival, and cellular adhesion and migration. In contrast, hPTH(1–34) affected processes associated with bone formation, mineralization and resorption, and pathways related to skeletal patterning and development. As with the signaling pathway analysis, the biological process gene clusters affected in bPTH(7–34)-treated wild-type mice more closely resembled those affected when β-arrestin2 was introduced to the null background (Supplemental Fig. 1B) than those affected by hPTH(1–34) treatment of wild-type mice. These analyses strongly suggest that bPTH(7–34) and PTH(1–34) affect bone mass in vivo through predominantly separate mechanisms created by largely distinct molecular signaling systems.
Figure 4 illustrates the lack of overlap between the genomic signatures of bPTH(7–34) and hPTH(1–34) in wild-type mice. In the canonical signaling-pathways analysis depicted in Fig. 4A, pathways that were significantly regulated in bPTH(7–34)-treated animals are shown in red, whereas those pathways activated by hPTH(1–34) are in blue. Figure 4B depicts the GObp analysis results in identical fashion. bPTH(7–34)-unique responses involved primarily cell cycle and cell survival/apoptosis, whereas hPTH(1–34)-unique responses reflected regulation of gene clusters linked to skeletal morphogenesis, osteoblast differentiation, matrix biosynthesis and mineralization, and bone turnover. Given the distinct efficacy profiles of the two ligands, the differences are not altogether surprising. PTH is known to regulate expression of genes important for the recruitment and activation of osteoclasts, production of growth factors, and degradation of the extracellular matrix. Many of these effects have been linked to activation of PKA. However cAMP-PKA signaling does not appear to account for the ability of PTH to stimulate osteoblast proliferation or to regulate components of the cell cycle (52). Our functional genomic analysis suggests that arrestin-dependent signaling in bone affects cell cycle and survival pathways and that its anabolic effects in vivo are linked to these actions.
Fig. 4.
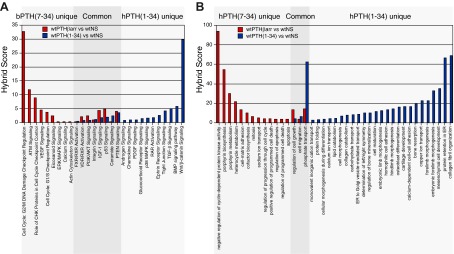
bPTH(7–34) and hPTH(1–34) produce distinct genomic signatures in calvarial bone. A, Comparison of classical signaling pathways determined using the wt bPTH(7–34) vs. wt NS (red bars) and wt hPTH(1–34) vs. wt NS (blue bars) gene sets demonstrating the significant non-overlap of the transcriptional responses elicited by the two ligands. B, Identical comparison of Gene Ontology biological processes determined from the wt bPTH(7–34) vs. wt NS (red bars) and wt hPTH(1–34) vs. wt NS (blue bars) gene sets. In each panel, hybrid scores (−log10(p) × pathway enrichment ratio) reflect the statistical probability that the observed differences did not occur by chance. All signaling pathway and GObp terms shown exceed a minimal threshold significance of P ≤ 0.05.
Comparison of transcription factor DNA-binding motifs in genes regulated by bPTH(7–34) and hPTH(1–34) in vivo
Although parametric gene set enrichment and GObp analysis provide insight into the higher order biological processes that are affected under a given set of conditions, they do not directly provide information about the proximal signaling events that bring about the observed changes in gene expression. Although subject to high false discovery, comparative genomics approaches to identify overrepresented transcription factor-binding motifs in the upstream regions of coregulated genes can generate testable hypotheses about mechanisms of transcriptional regulation (16). Table 3 lists the specific genes within signaling pathway gene clusters that were regulated by bPTH(7–34) and hPTH(1–34). The upstream sequences of these genes were used to identify consensus transcription factor-binding sites associated with each signaling pathway gene cluster. As shown in Fig. 5A, predicted STAT1 and STAT5A transcription factor-binding sites were the most commonly overrepresented promoter elements within signaling pathway gene sets regulated by both bPTH(7–34) and hPTH(1–34) in vivo. Notably, the consensus sequence IY (AWTTTCC), which is annotated as a response element for macrophage inflammatory factor 1α, is highly homologous to consensus STAT promoter elements (53).
Fig. 5.
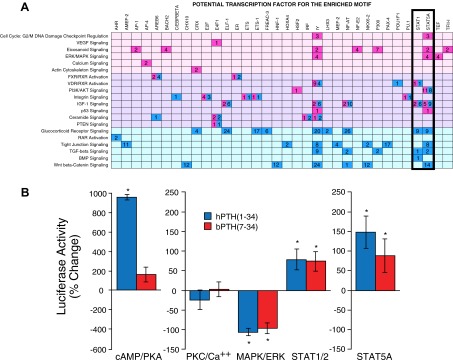
bPTH(7–34) and hPTH(1–34) treatment leads to changes in STAT promoter activity in vivo and in vitro. A, A program combining comparative genomics with de novo motif discovery (16) was used to identify predicted promoter elements that were enriched in the 5000-bp sequences upstream of annotated transcription starts of genes populating the pathway-specific gene sets shown in Table 3. The grid plots potential transcription factors for the enriched motifs as a function of signaling pathway to highlight transcription factor-binding sites that recur across multiple gene clusters. Transcription factors responsive to bPTH(7–34) (red) and hPTH(1–34) (blue) are shown. The number of predicted promoter elements for each transcription factor is shown within each colored square. The background shading denotes pathways regulated by bPTH(7–34) only (pink), hPTH(1–34) only (pale blue), or both agonists (lavender). B, Cultures (10 d of age) of differentiated wild-type calvarial osteoblasts expressing firefly luciferase reporters specific for cAMP/PKA (CREB), PKC/Ca++ (NFAT), ERK1/2 (Elk-1/SRF), STAT1/2 (ISRE), or STAT5A were stimulated for 8 h with vehicle, hPTH(1–34) (0.1 μm), or bPTH(7–34) (1.0 μm), after which luciferase expression was determined. Data from three to six separate experiments per reporter are shown as the mean ± sem of the fold change in luciferase activity relative to vehicle-treated osteoblasts. *, P < 0.05 greater or less than vehicle treated.
In vivo, the effects of bPTH(7–34) and hPTH(1–34) on genes containing STAT transcription factor-binding sites could be either direct, i.e. mediated via the PTH1R on target cells, or indirect, i.e. mediated by cytokines generated in response to PTH1R activation that subsequently function in an autocrine or paracrine manner. Nonetheless, direct regulation of STAT-mediated transcription in vitro by PTH-related peptide in ATDC5 chondrocytes and UMR106 osteosarcoma cells has been reported (54). To test whether bPTH(7–34) and hPTH(1–34) were capable of directly affecting STAT transcription, we employed STAT1/2 and STAT5A (19) promoter-specific luciferase reporters transiently introduced into wild-type calvarial osteoblasts. As controls, we employed reporters for cAMP/PKA signaling (CREB), PKC/Ca++ (NFAT), and ERK1/2 (Elk-1/SRF), signaling pathways known to be regulated by hPTH(1–34) or bPTH(7–34) in primary osteoblasts in vitro (12). As shown in Fig. 5B, 8-h exposure of 10-d-old cultures of differentiating calvarial osteoblasts to hPTH(1–34), but not bPTH(7–34), significantly increased CREB reporter activity. Neither ligand affected the NFAT reporter, and both significantly down-regulated Elk-1 reporter activity. The latter result may not be surprising, because in other cell types ERK1/2 activation via GPCR-arrestin complexes has been reported to enhance cytosolic ERK1/2 activity while retarding its nuclear translocation and Elk-1-dependent transcription (55, 56). Consistent with the in vivo promoter analysis, both hPTH(1–34) and bPTH(7–34) significantly increased STAT1/2 and STAT5A reporter activity in vitro. Given the prominent role of STAT-mediated transcription in the regulation of cell cycle and survival pathways (57, 58), these results suggest that changes in signaling pathway gene clusters that we observed in vivo might arise, in part, from direct effects of PTH1R ligands in cells of the osteoblast lineage.
β-Arrestin2 regulates the proliferation, survival, and migration of primary murine calvarial osteoblasts in vitro
Although cells of the osteoblast lineage would be the major PTH-responsive cell type in calvarial bone, tissue array data can reflect changes in other cell types, e.g. osteoclasts or vascular elements, that may respond indirectly to growth factors or cytokines generated by PTH-responsive cells. Furthermore, functional genomic approaches do not reliably predict the direction of change in regulated pathways. Thus, although genomic approaches suggest that the primary effects of bPTH(7–34) in vivo are on processes related to cell cycle, survival/apoptosis and migration, they do not establish whether these effects occur within osteoblasts or whether the processes are activated or inhibited. However, arrestin-dependent signaling has been implicated in the regulation of these processes in other contexts. For example, expression of β-arrestin2 has been shown to promote migration and invasion of urogenital cancer cells and chemotaxis of breast cancer cells in vitro (59, 60), and to improve cardiomyocyte survival in heart failure (41, 61).
To test whether the observed genomic effects of bPTH(7–34) reflected direct actions within the osteoblast lineage, we performed in vitro assays of cell growth, apoptosis, and migration using primary calvarial osteoblasts isolated from wild-type and β-arrestin2-null mice. Figure 6A depicts effects of β-arrestin2 expression on preosteoblast growth rates. As shown, undifferentiated β-arrestin2-null osteoblasts proliferated faster than wild-type osteoblasts, a finding that coincides with differences in cell cycle-regulatory gene clusters in the genomic comparison of wild-type and β-arrestin2-null calvaria (Supplemental Fig. 1). As shown in Fig. 6B, culture in the presence of either hPTH(1–34) or hPTH(7–34) modestly slowed the rate of proliferation in wild-type osteoblasts. This effect was absent in β-arrestin2-null osteoblasts, the higher growth rate of which was not affected by agonist exposure (Fig. 6C). These data suggest that β-arrestin2 may act as a brake on osteoblast proliferation and that engagement of arrestin signaling pathways by PTH1R facilitates this negative regulatory effect. As shown in Fig. 6D, β-arrestin2-null osteoblasts also exhibited greater apoptosis upon serum withdrawal than wild-type osteoblasts. When challenged with an inhibitor of topoisomerase II (etoposide), an apoptotic stimulus, both hPTH(1–34) and bPTH(7–34) significantly improved the survival of wild-type osteoblasts. As with the effects on growth rate, the antiapoptotic effect was absent in β-arrestin2-null osteoblasts, suggesting that PTH1R-mediated survival pathway regulation in vitro is β-arrestin2 mediated and independent of G protein signaling.
Fig. 6.

Effects of bPTH(7–34) and hPTH(1–34) on the proliferation and survival of wild-type and β-arrestin2-null osteoblasts. A, Growth rate of wild-type (WT) and β-arrestin2-null osteoblasts was determined by MTT assay. ***, P < 0.001; **, P < 0.01; * P < 0.05 greater than wild-type osteoblasts. Data from six separate experiments are shown as mean ± sem of the fold change in cell number. B, Proliferation of wild-type osteoblasts cultured in the presence or absence of hPTH(1–34) (0.1 μm) or bPTH(7–34) (1.0 μm). Data from six separate experiments are shown as mean ± sem of the fold change in cell number. *, P < 0.05 less than vehicle-treated osteoblasts. C, Proliferation of β-arrestin2-null osteoblasts cultured in the presence or absence of hPTH(1–34) (0.1 μm) or bPTH(7–34) (1.0 μm). Data from six separate experiments are shown as mean ± sem of the fold change in cell number. D, Differentiated cultures of wild-type and β-arrestin2-null osteoblasts were subjected to serum withdrawal or exposed to etoposide (50 μm) in the presence or absence of hPTH(1–34) (0.1 μm), or bPTH(7–34) (1.0 μm), and apoptosis was determined after 18 or 36 h. Data from six separate experiments are shown as mean ± sem of the fold change in cell number relative to vehicle treated. ***, P < 0.001 greater than serum withdrawal in wild type; ††, P < 0.05 less than etoposide treated; *, P < 0.05 serum withdrawal effect greater than in wild type; ##, P < 0.01 greater than serum withdrawal in β-arrestin2 null.
Figure 7 depicts the effects of hPTH(1–34) and bPTH(7–34) on random cell migration. As shown, bPTH(7–34) was more effective than serum or hPTH(1–34) at stimulating wild-type osteoblast migration. Consistent with the reported roles of arrestin scaffolds in GPCR-regulated actin cytoskeletal dynamics and chemotaxis (44, 60, 62), bPTH(7–34) had no effect in β-arrestin2-null osteoblasts. Supportive of our functional genomic analysis of calvarial bone, these data suggest that β-arrestin2 plays a regulatory role in the control of preosteoblast proliferation and mediates the effects of conventional and arrestin pathway-selective PTH1R agonists on osteoblast survival and migration.
Fig. 7.

Effects of bPTH(7–34) and hPTH(1–34) on the migration of wild type (WT) and β-arrestin2-null osteoblasts. A, Representative images depicting osteoblast migration in the presence and absence of hPTH(1–34) (0.1 μm) or bPTH(7–34) (1.0 μm). For each condition, the same field is shown at baseline and 20 h after disruption of confluent monolayers of wild-type and β-arrestin2-null osteoblasts. B, Bar graph depicting the effects of PTH(1–34) and PTH-βarr on osteoblast migration. Data from six separate experiments are shown as mean ± sem of the fold increase in migrating cells relative to the start of the assay. ***, P < 0.001; **, P < 0.01; *, P < 0.05 greater than vehicle treated.
Discussion
In this study, we employed both directed and genome-wide bioinformatic approaches to determine the mechanism of action underlying the anabolic effects of bPTH(7–34), a putative arrestin pathway-selective biased agonist of the PTH1R. In contrast to the conventional PTH1R agonist, hPTH(1–34), bPTH(7–34) competitively inhibits PTH1R-Gs and -Gq/11 coupling but stimulates arrestin-dependent signaling (8). Paradoxically, given its antagonism of G protein signaling, bPTH(7–34) stimulates trabecular bone formation when administered to wild-type mice (12). This effect cannot be explained by inhibition of G protein signaling, because hPTH(1–34), which activates G protein signaling, also promotes bone formation. Moreover, the anabolic effects of bPTH(7–34) are lost in β-arrestin2-null mice, where the ligand still antagonizes G protein-dependent signaling but has lost the ability to activate arrestin-dependent pathways. To determine how two PTH1R ligands with such different efficacy profiles both increase bone mass in vivo, we analyzed changes in the calvarial transcriptome that were associated with increased bone formation in wild-type and β-arrestin2-null mice treated with either the conventional or biased ligand.
Our pathway analysis indicates that the bone-forming effects of the two ligands are achieved through substantially different mechanisms of action. hPTH(1–34) treatment changes gene expression in pathways classically associated with skeletal development and enhanced bone remodeling, including Wnt/β-catenin, BMP, TGF-β, PI3K/AKT, and ERK/MAPK (48–50). In contrast, bPTH (7–34) primarily affects signaling pathways associated with cell cycle control, cell survival, apoptosis, and migration, including Akt/PI3K, p53, PTEN, and ataxia telangectasia mutated. These actions appear to arise from arrestin-mediated signaling, in that they are conferred on the null background by β-arrestin2 expression, are regulated in wild-type mice by exposure to bPTH(7–34), and are absent in mice lacking β-arrestin2. The functional genomic analyses are consistent with both histomorphometric analysis of trabecular bone from bPTH(7–34)-treated mice and in vitro assays of biological responses to bPTH(7–34). In vitro, β-arrestin2 expression slows the proliferation of primary calvarial preosteoblasts, but simultaneously decreases osteoblast apoptosis. bPTH(7–34) further slows preosteoblast proliferation, while directly promoting survival and migration in wild-type, but not β-arrestin2-null, osteoblasts. In vivo, bPTH(7–34) treatment increases osteoblast numbers and promotes the formation of new trabeculae (12). Our genomic analysis did not detect significant effects of bPTH(7–34) on gene clusters associated with osteoblast differentiation or accelerated osteoblastic activity, suggesting that arrestin-dependent signaling neither positively nor negatively impacts these processes in vivo. Neither does bPTH(7–34) increase osteoclast number or markers of bone resorption, suggesting that PTH1R regulation of osteoblast-osteoclast coupling is G protein dependent. Collectively, the data suggest that the increased rates of matrix synthesis and mineralization observed with bPTH(7–34) treatment arise from selective expansion of the mature osteoblast pool arising from its antiapoptotic effects, without a parallel increase in osteoclast numbers, rather than from an acceleration of osteoblast synthetic activity. Such a mechanism is independently supported by recent studies in heterozygous hypoxia inducible factor 1α +/− mice, in which enhanced bone regeneration after fracture was attributed to decreased osteoblast and chondrocyte apoptosis (63).
Our analyses also provide insight into the roles of β-arrestin2 in the response to hPTH(1–34). As a conventional agonist, hPTH(1–34) activates both the G protein- and arrestin-dependent functions of the PTH1R (8). Gs-cAMP signaling is known to promote osteoblast differentiation and synthetic activity (52), and our pathway analysis detected changes in gene clusters associated with these functions. In vivo, hPTH(1–34) increases osteoblast number, matrix biosynthesis and mineralization, and trabecular thickness (12). Unlike bPTH(7–34), hPTH(1–34) also increases osteoclast number and accelerates bone resorption. The anabolic response to intermittent hPTH(1–34) thus represents the net effect of stimulating osteoblast activity to a somewhat greater degree than osteoclast activity (1–3). Nonetheless, β-arrestin2 does appear to play an important role in the hPTH(1–34) response. The anabolic effects of PTH(1–34) are blunted in β-arrestin2-null mice (12, 21, 22), and our pathway analysis indicates that several classical pathways associated with its action require β-arrestin2 expression. Consistent with this, the effects of hPTH(1–34) on osteoblast survival and migration in vitro appear to be β-arrestin2 dependent, because they are absent in β-arrestin2-null osteoblasts despite the preservation of PTH1R-mediated G protein activation.
The present study does not address the potential role of β-arrestin1 in PTH-mediated bone remodeling. The PTH1R has been shown to recruit both β-arrestin1 and β-arrestin2 in hPTH1R-expressing transfected HEK293 cells, and in this model selective down-regulation of either isoform blocks bPTH(7–34)-mediated ERK1/2 activation (8). Data from β-arrestin2-null primary osteoblasts also indicate that the absence of β-arrestin2 is sufficient to abolish ERK1/2 activation by bPTH(7–34) (12), indicating that the two isoforms are not redundant, at least with respect to ERK1/2 signaling. Although some data suggest that β-arrestin1 and β-arrestin2 differ in their relative contributions to GPCR desensitization and signaling (36, 64, 65), it is noteworthy that in our analysis 91% of the signaling pathways populated after bPTH(7–34) stimulation of wild-type animals required β-arrestin2 expression. Although this does not exclude an important role for β-arrestin1 in PTH1R signaling, it does support the hypothesis that β-arrestin1 cannot substitute for β-arrestin2 in vivo.
As the first genome-wide characterization of the mechanism of action of a β-arrestin pathway-selective biased agonist, our results raise fundamental questions about the nature of biased agonism in vivo. Conventional receptor theory predicts that GPCRs exist in spontaneous equilibrium between inactive and active states that are preferentially stabilized by ligand binding, leading either to increases or decreases in the efficiency of receptor coupling to its intracellular effectors (65–67). Considerable evidence indicates that GPCRs can exist in more than one active state, each of which permits coupling to a subset of all possible effectors. In this context, a conventional agonist, like hPTH(1–34), stabilizes active conformation(s) of the receptor that elicit the full complement of receptor activity, whereas a biased agonist, like bPTH(7–34), produces or stabilizes receptor conformations that couple it to only a limited number of effectors. The prediction would be that at the level of the receptor, the effects of a biased agonist would comprise a subset of those produced by a full agonist, and this is what is observed when hPTH(1–34) and bPTH(7–34) signaling are compared in vitro (8, 12). Why then do the genomic signatures of the two ligands look different if the biased ligand is merely activating a subset of the same pathways affected by the conventional agonist? There are several possibilities. One is that bPTH(7–34) produces receptor conformations that cannot be duplicated by, or that rarely interact with, the native ligand, thereby coupling the receptor to as yet unknown, but nonnative, signaling processes. An appropriate analogy might be to selective estrogen receptor modulators, in which variations in ligand structure engender receptor conformations that recruit different combinations of estrogen receptor coactivator and corepressor proteins that modify the transcriptional response in a ligand-dependent manner (68). Alternatively, bPTH(7–34) may select conformations that normally represent a minor proportion of the conformational population produced by the conventional agonist, such that differences in the tissue response arise from differences in signal strength or the kinetics of pathway activation and deactivation rather than from qualitatively different signaling events. Finally, differences in the transcriptional output may indicate that bidirectional cross talk between the G protein- and β-arrestin-mediated signaling networks plays a key role. Because exposure to bPTH(7–34) in vivo occurs in the setting of endogenous circulating PTH, bPTH(7–34) may inhibit PTH1R-Gs signaling at the same time it couples the receptor to arrestins, whereas hPTH(1–34) activates both G protein- and arrestin-dependent pathways simultaneously. It is clear that β-arrestins modify G protein signaling by promoting receptor desensitization, and it is possible that activation of β-arrestin signaling without concomitant G protein activation preferentially stimulates downstream pathways that are normally repressed by G protein-mediated signals.
The finding that bPTH(7–34) can uncouple bone formation from bone resorption offers a compelling example of an arrestin pathway-selective GPCR ligand that may possess clinically useful properties distinct from those of a conventional agonist or antagonist. However, the surprising result of our functional analysis, that hPTH(1–34) and bPTH(7–34) possess substantially different mechanisms of action at the genomic level, raises the question of whether it is possible to predict biased agonist effects in vivo. At present, there are no analogous studies using biased ligands for other GPCRs with which to compare. Biased agonist effects may prove to be receptor-, tissue-, or even ligand-specific, reducing biased drug discovery to trial and error. On the other hand, our analysis of bPTH(7–34) effects suggests that its genomic actions are confined to a relatively narrow range of signaling pathways, many of which have already been described in one or more in vitro models (36). This suggests the biologically relevant arrestin signaling repertoire may be fairly conserved. The facts that there are only two nonvisual arrestins, that they are ubiquitously expressed outside the retina, and that they interact with the vast majority of GPCRs would support this view. If our posit is correct, it may indeed be easier to predict, compared with more pluripotent G protein-signaling ligands, the effects of arrestin pathway-selective agonists engaging a given GPCR. Whichever proves to be the case, our current results underscore the uniqueness of biased agonism and demonstrate that the property of functional selectivity can be exploited to change the quality of GPCR efficacy.
Supplementary Material
Acknowledgments
We respectfully acknowledge the contributions of the late Dr. Shaoxi Liao of Duke University, who passed away during the preparation of this manuscript. His experimental work constitutes an integral part of the data presented herein. We also thank Dr. Robert J. Lefkowitz for making β-arrestin2-null mice available for these studies. The contents of this article do not represent the views of the Department of Veterans Affairs or the United States Government.
This work was supported by National Institutes of Health Grants DK64353 (to L.M.L./D.G.-P.), DK55524 (to L.M.L.), HD043446 (to D.G.-P.), the Arthritis Foundation (to D.G.-P.), and the Research Services of the Charleston, South Carolina and Durham, North Carolina Veterans Affairs Medical Centers (to L.M.L., M.G.J., and D.G.-P.). M.G.J. was supported by Nephcure Young Investigator and Department of Veterans Affairs Career Development Awards. This work was supported in part by the National Institute on Aging Intramural Research Program of the NIH (to S.M., B.M., and W.W.).
Disclosure Summary: The authors have nothing to disclose.
Footnotes
- BMP
- Bone morphogenic protein
- CDKN1A
- cyclin-dependent kinase inhibitor 1A
- CREB
- cAMP response element-binding protein
- EGF
- epidermal growth factor
- GAPDH
- glyceraldehyde-3-phosphate dehydrogenase
- GObp
- Gene Ontology-biological processes
- GPCR
- G protein-coupled receptor
- MTT
- 3-[4,5-dimethylthiazol-2-y]-2,5-diphenyltetrazolium bromide
- NFAT
- nuclear factor of activated T-cells
- NF-κB
- nuclear factor-κB
- PI3K
- phosphatidylinositol 3-kinase
- PKA
- protein kinase A
- PKC
- protein kinase C
- bPTH(7–34)
- (d-Trp12, Tyr34)-bPTH(7–34)
- PTEN
- phosphatase and tensin homolog
- PTH1R
- type 1 PTH receptor
- RANKL
- receptor activator of NFκB ligand
- SRF
- serum response factor
- STAT
- signal transducer and activator of transcription.
References
- 1. Hock JM, Gera I. 1992. Effects of continuous and intermittent administration and inhibition of resorption on the anabolic response of bone to parathyroid hormone. J Bone Miner Res 7:65–72 [DOI] [PubMed] [Google Scholar]
- 2. Dobnig H, Turner RT. 1995. Evidence that intermittent treatment with parathyroid hormone increases bone formation in adult rats by activation of bone lining cells. Endocrinology 136:3632–3638 [DOI] [PubMed] [Google Scholar]
- 3. Qin L, Raggatt LJ, Partridge NC. 2004. Parathyroid hormone: a double-edged sword for bone metabolism. Trends Endocrinol Metab 15:60–65 [DOI] [PubMed] [Google Scholar]
- 4. Ferrari SL, Behar V, Chorev M, Rosenblatt M, Bisello A. 1999. Endocytosis of ligand-human parathyroid hormone receptor 1 complexes is protein kinase C-dependent and involves β-arrestin2. Real-time monitoring by fluorescence microscopy. J Biol Chem 274:29968–29975 [DOI] [PubMed] [Google Scholar]
- 5. Vilardaga JP, Krasel C, Chauvin S, Bambino T, Lohse MJ, Nissenson RA. 2002. Internalization determinants of the parathyroid hormone receptor differentially regulate β-arrestin/receptor association. J Biol Chem 277:8121–8129 [DOI] [PubMed] [Google Scholar]
- 6. Verheijen MH, Defize LH. 1997. Parathyroid hormone activates mitogen-activated protein kinase via a cAMP-mediated pathway independent of Ras. J Biol Chem 272:3423–3429 [DOI] [PubMed] [Google Scholar]
- 7. Cole JA. 1999. Parathyroid hormone activates mitogen-activated protein kinase in opossum kidney cells. Endocrinology 140:5771–5779 [DOI] [PubMed] [Google Scholar]
- 8. Gesty-Palmer D, Chen M, Reiter E, Ahn S, Nelson CD, Wang S, Eckhardt AE, Cowan CL, Spurney RF, Luttrell LM, Lefkowitz RJ. 2006. Distinct conformations of the parathyroid hormone receptor mediate G protein and β-arrestin dependent activation of ERK1/2. J Biol Chem 281:10856–10864 [DOI] [PubMed] [Google Scholar]
- 9. Azarani A, Goltzman D, Orlowski J. 1996. Structurally diverse N-terminal peptides of parathyroid hormone (PTH) and PTH-related peptide (PTHrp) inhibit the Na+/H+ exchanger NHE3 isoform by binding to the PTH/PTHrp receptor type I and activating distinct signaling pathways. J Biol Chem 271:14931–14936 [DOI] [PubMed] [Google Scholar]
- 10. Takasu H, Gardella TJ, Luck MD, Potts JT, Jr, Bringhurst FR. 1999. Amino-terminal modifications of human parathyroid hormone (PTH) selectively alter phospholipase C signaling via the type 1 PTH receptor: implications for design of signal-specific PTH ligands. Biochemistry 38:13453–13460 [DOI] [PubMed] [Google Scholar]
- 11. Mohan S, Kutilek S, Zhang C, Shen HG, Kodama Y, Srivastava AK, Wergedal JE, Beamer WG, Baylink DJ. 2000. Comparison of bone formation responses to parathyroid hormone(1–34), (1–31), and (2–34) in mice. Bone 27:471–478 [DOI] [PubMed] [Google Scholar]
- 12. Gesty-Palmer D, Flannery P, Yuan L, Spurney R, Lefkowitz RJ, Luttrell LM. 2009. A β-arrestin biased agonist of the parathyroid hormone receptor (PTH1R) promotes bone formation independent of G protein activation. Sci Transl Med 1:1ra1. [DOI] [PMC free article] [PubMed] [Google Scholar]
- 13. Bohn LM, Lefkowitz RJ, Gainetdinov RR, Peppel K, Caron MG, Lin FT. 1999. Enhanced morphine analgesia in mice lacking β-arrestin 2. Science 286:2495–2498 [DOI] [PubMed] [Google Scholar]
- 14. Wang L, Liu S, Quarles LD, Spurney RF. 2005. Targeted overexpression of G protein-coupled receptor kinase-2 in osteoblasts promotes bone loss. Am J Physiol Endocrinol Metab 288:E826–E834 [DOI] [PubMed] [Google Scholar]
- 15. Martin B, Pearson M, Brenneman R, Golden E, Wood W, Prabhu V, Becker KG, Mattson MP, Maudsley S. 2009. Gonadal transcriptome alterations in response to dietary energy intake: sensing the reproductive environment. PLoS One 4:e4146. [DOI] [PMC free article] [PubMed] [Google Scholar]
- 16. Mao L, Zheng WJ. 2006. Combining comparative genomics with de novo motif discovery to identify human transcription factor DNA-binding motifs. BMC Bioinformatics 7(Suppl 4):S21. [DOI] [PMC free article] [PubMed] [Google Scholar]
- 17. Pavesi G, Mereghetti P, Mauri G, Pesole G. 2004. Weeder Web: discovery of transcription factor binding sites in a set of sequences from co-regulated genes. Nucleic Acids Res 32:W199–W203 [DOI] [PMC free article] [PubMed] [Google Scholar]
- 18. Garner SC, Pi M, Tu Q, Quarles LD. 2001. Rickets in cation-sensing receptor-deficient mice: an unexpected skeletal phenotype. Endocrinology 142:3996–4005 [DOI] [PubMed] [Google Scholar]
- 19. Fang F, Rycyzyn MA, Clevenger CV. 2009. Role of c-Myb during prolactin-induced signal transducer and activator of transcription 5a signaling in breast cancer cells. Endocrinology 150:1597–1606 [DOI] [PMC free article] [PubMed] [Google Scholar]
- 20. Gardella TJ, Luck MD, Jensen GS, Schipani E, Potts JT, Jr, Jüppner H. 1996. Inverse agonism of amino-terminally truncated parathyroid hormone (PTH) and PTH-related peptide (PTHrP) analogs revealed with constitutively active mutant PTH/PTHrP receptors. Endocrinology 137:3936–3941 [DOI] [PubMed] [Google Scholar]
- 21. Ferrari SL, Pierroz DD, Glatt V, Goddard DS, Bianchi EN, Lin FT, Manen D, Bouxsein ML. 2005. Bone response to intermittent parathyroid hormone is altered in mice null for β-arrestin2. Endocrinology 146:1854–1862 [DOI] [PubMed] [Google Scholar]
- 22. Bouxsein ML, Pierroz DD, Glatt V, Goddard DS, Cavat F, Rizzoli R, Ferrari SL. 2005. β-Arrestin2 regulates the differential response of cortical and trabecular bone to intermittent PTH in female mice. J Bone Miner Res 20:635–643 [DOI] [PMC free article] [PubMed] [Google Scholar]
- 23. Pi M, Oakley RH, Gesty-Palmer D, Cruickshank RD, Spurney RF, Luttrell LM, Quarles LD. 2005. β-Arrestin- and G protein receptor kinase-mediated calcium-sensing receptor desensitization. Mol Endocrinol 19:1078–1087 [DOI] [PubMed] [Google Scholar]
- 24. Pierroz DD, Rufo A, Bianchi EN, Glatt V, Capulli M, Rucci N, Cavat F, Rizzoli R, Teti A, Bouxsein ML, Ferrari SL. 2009. β-Arrestin2 regulates RANKL and ephrins gene expression in response to bone remodeling in mice. J Bone Miner Res 24:775–784 [DOI] [PMC free article] [PubMed] [Google Scholar]
- 25. DeFea KA, Vaughn ZD, O'Bryan EM, Nishijima D, Déry O, Bunnett NW. 2000. The proliferative and antiapoptotic effects of substance P are facilitated by formation of a β-arrestin-dependent scaffolding complex. Proc Natl Acad Sci USA 97:11086–11091 [DOI] [PMC free article] [PubMed] [Google Scholar]
- 26. Luttrell LM, Roudabush FL, Choy EW, Miller WE, Field ME, Pierce KL, Lefkowitz RJ. 2001. Activation and targeting of extracellular signal-regulated kinases by β-arrestin scaffolds. Proc Natl Acad Sci USA 98:2449–2454 [DOI] [PMC free article] [PubMed] [Google Scholar]
- 27. McDonald PH, Chow CW, Miller WE, Laporte SA, Field ME, Lin FT, Davis RJ, Lefkowitz RJ. 2000. β-Arrestin 2: a receptor-regulated MAPK scaffold for the activation of JNK3. Science 290:1574–1577 [DOI] [PubMed] [Google Scholar]
- 28. Song X, Gurevich EV, Gurevich VV. 2007. Cone arrestin binding to JNK3 and Mdm2: conformational preference and localization of interaction sites. J Neurochem 103:1053–1062 [DOI] [PMC free article] [PubMed] [Google Scholar]
- 29. Bruchas MR, Macey TA, Lowe JD, Chavkin C. 2006. κ-Opioid receptor activation of p38 MAPK is GRK3- and arrestin-dependent in neurons and astrocytes. J Biol Chem 281:18081–18089 [DOI] [PMC free article] [PubMed] [Google Scholar]
- 30. Wang P, Gao H, Ni Y, Wang B, Wu Y, Ji L, Qin L, Ma L, Pei G. 2003. β-Arrestin 2 functions as a G-protein-coupled receptor-activated regulator of oncoprotein Mdm2. J Biol Chem 278:6363–6370 [DOI] [PubMed] [Google Scholar]
- 31. Gao H, Sun Y, Wu Y, Luan B, Wang Y, Qu B, Pei G. 2004. Identification of β-arrestin2 as a G protein-coupled receptor-stimulated regulator of NF-κB pathways. Mol Cell 14:303–317 [DOI] [PubMed] [Google Scholar]
- 32. Witherow DS, Garrison TR, Miller WE, Lefkowitz RJ. 2004. β-Arrestin inhibits NF-κB activity by means of its interaction with the NF-κB inhibitor IκBα. Proc Natl Acad Sci USA 101:8603–8607 [DOI] [PMC free article] [PubMed] [Google Scholar]
- 33. Mythreye K, Blobe GC. 2009. The type III TGF-β receptor regulates epithelial and cancer cell migration through β-arrestin2-mediated activation of Cdc42. Proc Natl Acad Sci USA 106:8221–8226 [DOI] [PMC free article] [PubMed] [Google Scholar]
- 34. Wilbanks AM, Fralish GB, Kirby ML, Barak LS, Li YX, Caron MG. 2004. β-Arrestin 2 regulates zebrafish development through the hedgehog signaling pathway. Science 306:2264–2267 [DOI] [PubMed] [Google Scholar]
- 35. Yu MC, Su LL, Zou L, Liu Y, Wu N, Kong L, Zhuang ZH, Sun L, Liu HP, Hu JH, Li D, Strominger JL, Zang JW, Pei G, Ge BX. 2008. An essential function for β-arrestin 2 in the inhibitory signaling of natural killer cells. Nat Immunol 9:898–907 [DOI] [PubMed] [Google Scholar]
- 36. Luttrell LM, Gesty-Palmer D. 2010. Beyond desensitization: physiological relevance of arrestin-dependent signaling. Pharm Rev 62:305–330 [DOI] [PMC free article] [PubMed] [Google Scholar]
- 37. Perry SJ, Baillie GS, Kohout TA, McPhee I, Magiera MM, Ang KL, Miller WE, McLean AJ, Conti M, Houslay MD, Lefkowitz RJ. 2002. Targeting of cyclic AMP degradation to β2-adrenergic receptors by β-arrestins. Science 298:834–836 [DOI] [PubMed] [Google Scholar]
- 38. Nelson CD, Perry SJ, Regier DS, Prescott SM, Topham MK, Lefkowitz RJ. 2007. Targeting of diacylglycerol degradation to M1 muscarinic receptors by β-arrestins. Science 315:663–666 [DOI] [PubMed] [Google Scholar]
- 39. Lin FT, Daaka Y, Lefkowitz RJ. 1998. β-Arrestins regulate mitogenic signaling and clathrin-mediated endocytosis of the insulin-like growth factor I receptor. J Biol Chem 273:31640–31643 [DOI] [PubMed] [Google Scholar]
- 40. Dalle S, Ricketts W, Imamura T, Vollenweider P, Olefsky JM. 2001. Insulin and insulin-like growth factor I receptors utilize different G protein signaling components. J Biol Chem 276:15688–15695 [DOI] [PubMed] [Google Scholar]
- 41. Noma T, Lemaire A, Naga Prasad SV, Barki-Harrington L, Tilley DG, Chen J, Le Corvoisier P, Violin JD, Wei H, Lefkowitz RJ, Rockman HA. 2007. β-Arrestin-mediated β1-adrenergic receptor transactivation of the EGFR confers cardioprotection. J Clin Invest 117:2445–2458 [DOI] [PMC free article] [PubMed] [Google Scholar]
- 42. Lakshmikanthan V, Zou L, Kim JI, Michal A, Nie Z, Messias NC, Benovic JL, Daaka Y. 2009. Identification of βarrestin2 as a corepressor of androgen receptor signaling in prostate cancer. Proc Natl Acad Sci USA 106:9379–9384 [DOI] [PMC free article] [PubMed] [Google Scholar]
- 43. Ranganathan R. 2003. Cell biology: a matter of life or death. Science 299:1677–1679 [DOI] [PubMed] [Google Scholar]
- 44. DeFea KA. 2007. Stop that cell! β-Arrestin-dependent chemotaxis: a tale of localized actin assembly and receptor desensitization. Annu Rev Physiol 69:535–560 [DOI] [PubMed] [Google Scholar]
- 45. Nelson CD, Kovacs JJ, Nobles KN, Whalen EJ, Lefkowitz RJ. 2008. β-Arrestin scaffolding of phosphatidylinositol 4-phosphate 5-kinase Iα promotes agonist-stimulated sequestration of the β2-adrenergic receptor. J Biol Chem 283:21093–210101 [DOI] [PMC free article] [PubMed] [Google Scholar]
- 46. Barlic J, Andrews JD, Kelvin AA, Bosinger SE, DeVries ME, Xu L, Dobransky T, Feldman RD, Ferguson SS, Kelvin DJ. 2000. Regulation of tyrosine kinase activation and granule release through β-arrestin by CXCRI. Nat Immunol 1:227–233 [DOI] [PubMed] [Google Scholar]
- 47. Lempiäinen H, Halazonetis TD. 2009. Emerging common themes in regulation of PIKKs and PI3Ks. EMBO J 28:3067–3073 [DOI] [PMC free article] [PubMed] [Google Scholar]
- 48. Deng ZL, Sharff KA, Tang N, Song WX, Luo J, Luo X, Chen J, Bennett E, Reid R, Manning D, Xue A, Montag AG, Luu HH, Haydon RC, He TC. 2008. Regulation of osteogenic differentiation during skeletal development. Front Biosci 13:2001–2021 [DOI] [PubMed] [Google Scholar]
- 49. Lian JB, Stein GS, Javed A, van Wijnen AJ, Stein JL, Montecino M, Hassan MQ, Gaur T, Lengner CJ, Young DW. 2006. Networks and hubs for the transcriptional control of osteoblastogenesis. Rev Endocr Metab Disord 7:1–16 [DOI] [PubMed] [Google Scholar]
- 50. Guo X, Wang XF. 2009. Signaling cross-talk between TGF-β/BMP and other pathways. Cell Res 19:71–88 [DOI] [PMC free article] [PubMed] [Google Scholar]
- 51. Gesty-Palmer D, El Shewy H, Kohout TA, Luttrell LM. 2005. β-Arrestin 2 expression determines the transcriptional response to lysophosphatidic acid stimulation in murine embryo fibroblasts. J Biol Chem 280:32157–32167 [DOI] [PubMed] [Google Scholar]
- 52. Swarthout JT, D'Alonzo RC, Selvamurugan N, Partridge NC. 2002. Parathyroid hormone-dependent signaling pathways regulating genes in bone cells. Gene 282:1–17 [DOI] [PubMed] [Google Scholar]
- 53. Xie X, Lu J, Kulbokas EJ, Golub TR, Mootha V, Lindblad-Toh K, Lander ES, Kellis M. 2005. Systematic discovery of regulatory motifs in human promoters and 3′ UTRs by comparison of several mammals. Nature 434:338–345 [DOI] [PMC free article] [PubMed] [Google Scholar]
- 54. Hoogendam J, Parlevliet E, Miclea R, Löwik CW, Wit JM, Karperien M. 2006. Novel early target genes of parathyroid hormone-related peptide in chondrocytes. Endocrinology 147:3141–3152 [DOI] [PubMed] [Google Scholar]
- 55. Tohgo A, Choy EW, Gesty-Palmer D, Pierce KL, Laporte S, Oakley RH, Caron MG, Lefkowitz RJ, Luttrell LM. 2003. The stability of the G protein-coupled receptor-βarrestin interaction determines the mechanism and functional consequences of ERK activation. J Biol Chem 278:6258–6267 [DOI] [PubMed] [Google Scholar]
- 56. Wei H, Ahn S, Barnes WG, Lefkowitz RJ. 2004. Stable interaction between β-arrestin 2 and angiotensin type 1A receptor is required for β-arrestin 2-mediated activation of extracellular signal-regulated kinases 1 and 2. J Biol Chem 279:48255–48261 [DOI] [PubMed] [Google Scholar]
- 57. Kisseleva T, Bhattacharya S, Braunstein J, Schindler CW. 2002. Signaling through the JAK/STAT pathway, recent advances and future challenges. Gene 285:1–24 [DOI] [PubMed] [Google Scholar]
- 58. Tan SH, Nevalainen MT. 2008. Signal transducer and activator of transcription 5A/B in prostate and breast cancers. Endocr Relat Cancer 15:367–390 [DOI] [PMC free article] [PubMed] [Google Scholar]
- 59. Moussa O, Ashton AW, Fraig M, Garrett-Mayer E, Ghoneim MA, Halushka PV, Watson DK. 2008. Novel role of thromboxane receptors β isoform in bladder cancer pathogenesis. Cancer Res 68:4097–4104 [DOI] [PubMed] [Google Scholar]
- 60. Ge L, Shenoy SK, Lefkowitz RJ, DeFea K. 2004. Constitutive protease-activated receptor-2-mediated migration of MDA MB-231 breast cancer cells requires both β-arrestin-1 and -2. J Biol Chem 279:55419–55424 [DOI] [PubMed] [Google Scholar]
- 61. Kim KS, Abraham D, Williams B, Violin JD, Mao L, Rockman HA. 2012. β-Arrestin-biased AT1R stimulation promotes cell survival during acute cardiac injury. Am J Physiol Heart Circ Physiol 303:H1001–H1010 [DOI] [PMC free article] [PubMed] [Google Scholar]
- 62. Min J, Defea K. 2011. β-Arrestin-dependent actin reorganization: bringing the right players together at the leading edge. Mol Pharmacol 80:760–768 [DOI] [PubMed] [Google Scholar]
- 63. Komatsu DE, Bosch-Marce M, Semenza GL, Hadjiargyrou M. 2007. Enhanced bone regeneration associated with decreased apoptosis in mice with partial HIF-1α deficiency. J Bone Miner Res 22:366–374 [DOI] [PMC free article] [PubMed] [Google Scholar]
- 64. DeWire SM, Ahn S, Lefkowitz RJ, Shenoy SK. 2007. β-Arrestins and cell signaling. Annu Rev Physiol 69:483–510 [DOI] [PubMed] [Google Scholar]
- 65. Maudsley S, Martin B, Luttrell LM. 2005. Perspectives in pharmacology: the origins of diversity and specificity in G protein-coupled receptor signaling. J Pharmacol Exp Therap 314:485–494 [DOI] [PMC free article] [PubMed] [Google Scholar]
- 66. Kenakin T. 2007. Functional selectivity through protean and biased agonism: who steers the ship? Mol Pharmacol 72:1393–1401 [DOI] [PubMed] [Google Scholar]
- 67. Luttrell LM, Kenakin TP. 2011. Refining efficacy: allosterism and bias in G protein-coupled receptor signaling. Methods Mol Biol 756:3–35 [DOI] [PubMed] [Google Scholar]
- 68. Hall JM, McDonnell DP. 2005. Coregulators in nuclear estrogen receptor action: from concept to therapeutic targeting. Mol Interv 5:343–357 [DOI] [PubMed] [Google Scholar]
Associated Data
This section collects any data citations, data availability statements, or supplementary materials included in this article.