

ShortStack is a new stand-alone and single-command tool for discovery of genes/loci that are precursors of small interfering and microRNAs using deeply sequenced small RNA libraries. The analysis can be performed for distant species and allows the quantification of the inferred small RNA genes.
Keywords: microRNA, small RNA, siRNA, software, bioinformatics, next-generation sequencing
Abstract
Small RNA sequencing allows genome-wide discovery, categorization, and quantification of genes producing regulatory small RNAs. Many tools have been described for annotation and quantification of microRNA loci (MIRNAs) from small RNA-seq data. However, in many organisms and tissue types, MIRNA genes comprise only a small fraction of all small RNA-producing genes. ShortStack is a stand-alone application that analyzes reference-aligned small RNA-seq data and performs comprehensive de novo annotation and quantification of the inferred small RNA genes. ShortStack’s output reports multiple parameters of direct relevance to small RNA gene annotation, including RNA size distributions, repetitiveness, strandedness, hairpin-association, MIRNA annotation, and phasing. In this study, ShortStack is demonstrated to perform accurate annotations and useful descriptions of diverse small RNA genes from four plants (Arabidopsis, tomato, rice, and maize) and three animals (Drosophila, mice, and humans). ShortStack efficiently processes very large small RNA-seq data sets using modest computational resources, and its performance compares favorably to previously described tools. Annotation of MIRNA loci by ShortStack is highly specific in both plants and animals. ShortStack is freely available under a GNU General Public License.
INTRODUCTION
Small RNAs are ubiquitous regulatory molecules produced by many thousands of endogenous genes. Small RNA sequencing (small RNA-seq), enabled by modern highly parallel DNA sequencing instruments, is a powerful method for discovery, annotation, and quantification of small RNA-producing genes. Typical small RNA-seq experiments use RNA ligase to attach adapters to the 3′ and 5′ ends of size-fractionated total RNAs, followed by reverse-transcription, PCR amplification, and shotgun sequencing of the resulting cDNA library. Deeply sequenced small RNA libraries allow experimental discovery of expressed small RNAs, as well as quantification based upon read-counts (although the latter can be subject to biases inherent to RNA ligation, adapter sequences and amplification) (Jayaprakash et al. 2011; Sorefan et al. 2012).
Almost all small RNAs derive from post-transcriptional processing of larger RNA precursors. Some small RNA precursors, such as microRNA (MIRNA) hairpins, yield a single functional small RNA species after processing. In principle, small RNA-seq-based quantification of mature miRNAs can, and often does, proceed without the need for alignment to a genomic reference sequence. However, many other types of small RNA genes produce a diverse population of mature small RNAs from a single, often inferred, larger precursor. Examples include the diverse endogenous siRNAs that are the major component of small RNA populations in plants (Matzke et al. 2009), Piwi-associated RNAs (piRNAs) that accumulate in animal germlines and stem cells (Juliano et al. 2011), and the endogenous siRNAs (endo-siRNAs) of Drosophila (Czech et al. 2008; Okamura et al. 2008). For these types of small RNA genes, quantification of each individual mature RNA is not appropriate; it is the total small RNA accumulation from the single underlying precursor that is relevant. Even MIRNA hairpins often produce more than one functional product, including functional miRNA* species (Yang et al. 2011; Zhang et al. 2011), and length variants of canonical miRNAs (Zhang et al. 2010; Cloonan et al. 2011). Therefore, at least an approximate annotation of the underlying small RNA precursor is a prerequisite for accurate quantification and differential expression analysis of most, if not all, small RNA genes.
Unlike protein-coding genes, which have inherent nucleotide patterns that can be discerned computationally by scrutinizing the genome sequence (e.g., open reading frames, splice sites, etc.), most small RNA genes do not have known primary sequence features to allow confident a priori prediction (one exception is highly conserved MIRNA genes). Thus, definition of small RNA genes is largely empirical, based upon the pattern of small RNA alignments to a reference genome. Besides simply defining the minimum extent of the underlying precursor, the patterns of reference-aligned small RNAs also provide key information on the mode of biogenesis. MIRNA loci produce a discrete pattern of alignments to a single genomic strand, with a major species (the mature miRNA) separated by a short distance from a second, minor species (the miRNA* that is excised along with the mature miRNA during its biogenesis). In contrast, endogenous siRNAs derived from long, double-stranded RNA (dsRNA) generate a dispersed pattern of alignments to both genomic strands, while small RNAs produced by fragmentation of a single-stranded precursor will be dispersed along a single genomic strand. Definition and analysis of small RNA alignment clustering patterns with respect to a reference genome, therefore, is a key part of small RNA-seq analysis.
Another key property of small RNA genes is the distribution of small RNA sizes produced by the locus. Small RNA size is often a useful proxy for biological function. For instance, in plants mature miRNAs are usually 21 nt in length, most endogenous siRNAs are 24 nt long, and 22-nt RNAs have unique molecular consequences on their targets (Lu et al. 2006; Kasschau et al. 2007; Chen et al. 2010; Cuperus et al. 2010). In Drosophila, most mature miRNAs are between 21 and 23 nt in length, piRNAs are mostly 26–28 nt in length, and endo-siRNAs are tightly centered on 21 nt in length (Brennecke et al. 2007; Czech et al. 2008; Okamura et al. 2008; Berezikov et al. 2011). Furthermore, small RNAs derived from fragmentation of abundant RNAs in any species (rRNA and tRNA fragments, for instance) often have a wider size distribution, especially in the very small sizes, that exceeds the size range normally associated with small RNA regulatory function. Therefore, careful description of the sizes of small RNAs produced by a small RNA gene can allow inference of biogenesis and function and also allow the segregation of small RNA loci spawned by degradation artifacts.
Much attention has been given to the specific problem of annotating MIRNA genes from small RNA-seq data, and several tools for this purpose have been described to date (for review, see Li et al. 2012). Less attention has been devoted to the broader problem of all-inclusive annotations based on reference-aligned small RNA-seq data. Many groups, including the author’s, have used internally developed methods to broadly annotate non-MIRNA small RNA clusters (for a few examples, see Cho et al. 2008; Mosher et al. 2008; Lee et al. 2012) but have not released general purpose software. The NiBLS method (MacLean et al. 2010) implements a graph-based approach to small RNA cluster discovery but does not provide description of small RNA sizes, accumulation patterns, secondary structures, and other key features of small RNA genes. The Bioconductor package segmentSeq (Hardcastle et al. 2012) uses an empirical Bayesian method to define small RNA loci based on consistent presence between replicate small RNA-seq samples but also lacks detailed annotation based on small RNA sizes, hairpin structure, and accumulation patterns. The UEA sRNA Toolkit (Moxon et al. 2008) is a collection of web-based tools that separately address MIRNA annotation, small RNA locus definition, and miRNA target predictions and also provides visualization tools. The recent release of a downloadable version, the UEA sRNA Workbench (Stocks et al. 2012), eliminates the data transfer issues inherent in analysis of large data sets on a web server. However, the UEA Workbench tools do not address the critical issues of small RNA size distributions and non-MIRNA hairpin loci, and they are not integrated into a single, “one-command” annotation of a small RNA-seq sample.
ShortStack was developed to complement and expand upon the currently available tools for comprehensive small RNA annotation and quantification. In a single command, ShortStack analyzes a reference-aligned small RNA-seq sample by defining de novo small RNA clusters, annotating hairpin-associated loci and MIRNAs, testing for the repeating arrangement of aligned small RNAs (“phasing”), and analyzing loci based on small RNA size composition, strandedness, and repetitiveness. Extensive flexibility in analysis is achieved by many user-adjustable parameters. Detailed analysis of the size distributions of small RNAs within small RNA genes is a key feature of ShortStack. ShortStack’s simple tabular output formats are easily analyzed by downstream processes and can be directly imported to R (R Core Development Team 2010) as well as to commonly used spreadsheet software. Genome browser track output and detailed alignments of MIRNA loci offer publication-ready results after analysis. In this study, ShortStack is described and performance-tested with representative plant and animal small RNA-seq data.
RESULTS AND DISCUSSION
Overview of ShortStack
ShortStack annotates and quantifies reference-aligned small RNA-seq data in six phases (Fig. 1A). It is implemented as a perl script which requires prior installation of three additional programs to run: samtools (Li et al. 2009) and the RNALfold and RNAeval programs (both from the Vienna RNA Package) (Hofacker et al. 2004). Analysis requires input of a sorted, properly formatted, and indexed BAM alignment file along with the corresponding reference genome in FASTA format. Many popular aligners can output in SAM/BAM format, including bowtie (Langmead et al. 2009). A helper program, “Prep_bam.pl,” is included with the ShortStack package and serves to prepare properly formatted and sorted BAM alignments from input SAM or BAM files. Two optional files may also be included (Fig. 1A). The first is a set of inverted repeats, derived from separate analysis using “einverted” from the EMBOSS package (Rice et al. 2000). These help improve the annotation of very large hairpin-associated loci that might otherwise not be annotated as hairpin-associated. The second is a set of genomic loci to flag for overlaps with the discovered small RNA loci. This is helpful to flag small RNA loci with respect to overlap with genomic features of user interest.
FIGURE 1.

Overview of ShortStack. (A) Flow chart describing the inputs and six phases of analysis performed by ShortStack. (B) Illustration of ShortStack’s cluster definition method with a minimum depth of four alignments. Aligned small RNAs in dark shading are tallied within the final cluster.
During Phase 1, small RNA clusters are identified in a simple, two-step process. First, islands of significant alignment coverage are identified (Fig. 1B). Islands are defined as continuous genomic coordinates where the depth of alignment coverage exceeds a user-set minimum threshold (option --mindepth). Second, the initial islands are “padded” both upstream and downstream by a user-set number of nucleotides (option --pad) (Fig. 1B). Regions that overlap after padding are then merged to form clusters. Padding has the effect of smoothing the data when accumulation of small RNAs varies substantially from different regions of the same precursor. This is important because large positional heterogeneities in small RNA accumulation from the same precursor are expected for small RNA genes as the result of differential stabilization of the initial small RNAs based upon Argonaute/Piwi loading preferences and strand selection from initial small RNA duplexes. The optimal amount of padding balances the “lumping” of adjacent islands that actually derived from the same precursor with “splitting” islands that derive from separate precursors. During Phase 2, small RNA accumulation from all clusters is quantified and recorded. ShortStack discriminates the regulatory small RNAs of interest from other small RNAs based on a user-set size range (default: 20–24 nt). Loci where the number of RNAs within the user-set size range meets a minimum threshold (default = 0.8) are annotated as Dicer-derived, and others are annotated as not Dicer-derived. The predominant small RNA size of each cluster is also reported as the DicerCall. Note that the terms, Dicer-derived and DicerCall, are used loosely; the distinction is based upon the sizes of the small RNAs, not necessarily the biogenesis mechanism. The total number of short reads (those smaller than the minimum size range) and long reads (those more than the maximum size range) are reported, as well as the abundance of every small RNA size within the Dicer range.
Phases 3 through 5 analyze putative RNA hairpins and annotate MIRNA loci. Secondary structural analysis is computationally intensive, and therefore, loci unlikely to be hairpin- or MIRNA-associated are excluded from these analyses. Clusters annotated in Phase 2 as non-Dicer-derived are excluded from structural analyses. In addition, highly repetitive clusters are also excluded from all structural analyses. Cluster repetitiveness is quantified by calculating the ratio of repeat-normalized abundance to the total number of mappings at the locus. This ratio, referred to as the uniqueness index, varies between 0 (highly repetitive loci, where most reads have a high number of alternative placements in the genome) and 1 (nonrepetitive loci). By default, the uniqueness index of a cluster must be at least 0.1 to qualify for secondary structural analysis, although this threshold is user-adjustable. The rationale behind this filter is based on plant-derived heterochromatic siRNAs, many of which emanate from highly repetitive loci and are known to be produced from endogenous dsRNA, not hairpins. Finally, loci larger than a maximum size (default: 300 nt; user-adjustable) are not subject to analysis by RNALfold. However, larger hairpins can still be found using einverted-derived hairpins, which are not restricted in size.
Potential small RNA-associated hairpins derived from RNALfold (and einverted if the optional einverted file was provided) are first filtered to retain only those that meet a set of minimal structural criteria. The default settings for these structural criteria were determined by analysis of all annotated MIRNA loci in miRBase (version 19) (Fig. 2). Many features of MIRNA loci differ between plants and animals, including the number of base pairs (Fig. 2A), the length of loops (Fig. 2D), and the number of unpaired mature miRNA bases within the miRNA/miRNA* duplex (Fig. 2E). ShortStack, therefore, has two preset “miRTypes” for the two kingdoms. These default settings increase specificity by excluding structures with unusual characteristics. The animal miRType settings would exclude 15% of all annotated miRBase structures for metazoans and 6% of all known viral miRBase structures (Fig. 2F). Similarly, the default plant miRType settings would exclude 12% of all known miRBase structures from the Viridiplantae (Fig. 2F). This reduced sensitivity is a consequence of the desire to maximize the specificity of MIRNA annotations by ShortStack by excluding structural outliers. Importantly, annotation as a MIRNA locus by ShortStack requires a strict set of structural and expression-based criteria, following the recommendations of Meyers et al. (2008). Annotation of a locus as a MIRNA by ShortStack indicates that the evidence is sufficient to justify annotation without assistance from prior knowledge (such as prior annotation as a MIRNA or conservation in another species). After filtering based on secondary structure, potentially qualifying hairpin structures are then scrutinized relative to their patterns of small RNA accumulation. Hairpins with strong evidence of causality with respect to the observed small RNA pattern are annotated as either hairpin-derived (HP) or MIRNA loci.
FIGURE 2.
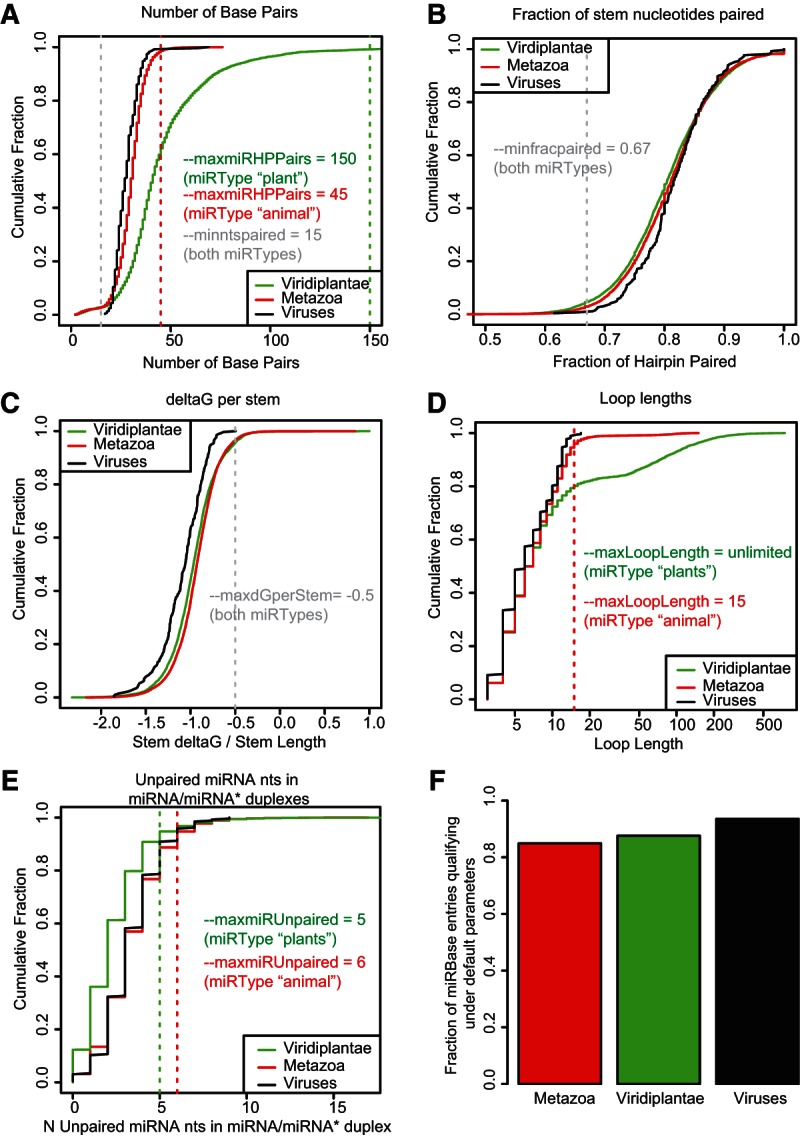
Secondary structural characteristics of known MIRNAs from miRBase (version 19). (A) Cumulative fraction of the number of base pairs in the hairpins of miRBase MIRNAs, separated by kingdom. Dotted lines and text indicate default parameter settings for ShortStack 0.4.1 for the indicated miRtypes. (B) As in A for the fraction of stem nucleotides paired. (C) As in A for the ΔG per stem nt. (D) As in A for loop lengths. (E) As in A for the number of unpaired mature miRNA nt in the miRNA/miRNA* duplex. (F) Fraction of miRBase hairpins for the indicated kingdoms that pass the default ShortStack structural criteria for miRType animal (Metazoa, Viruses) or plant (Viridiplantae).
Several reports are produced during Phase 6, including a summary results file, detailed alignments of all HP and MIRNA clusters, and a .bed formatted file for genome browser display. ShortStack can also be executed in two alternative modes (Fig. 1A). In “nohp” mode, Phases 3 through 5 are skipped, and thus no HP or MIRNA annotations are made. In “count” mode, Phase 1 is skipped, and user-provided clusters are simply quantified instead. Count mode forces nohp mode as well, so no hairpin or MIRNA analyses are performed during a count mode analysis (Fig. 1A).
Performance analysis and comparisons to other methods
Table 1 compares the features of ShortStack to three other previously described programs (NiBLS, segmentSeq, and the UEA sRNA Workbench) that were also designed for de novo discovery of small RNA loci from reference-aligned small RNA-seq data. Of the four, ShortStack combines the most features into a single program. The performance characteristics of ShortStack were compared against the other programs. The same representative small RNA-seq data set from wild-type Arabidopsis leaves (col_leaf) (Table 2) was used for analysis for all four programs (all with default settings). ShortStack had the smallest memory footprint of all of the methods and compared favorably in speed, with only SiLoCo (from the UEA sRNA Workbench) completing faster (Table 3).
TABLE 1.
Comparison of general purpose small RNA gene annotation programs
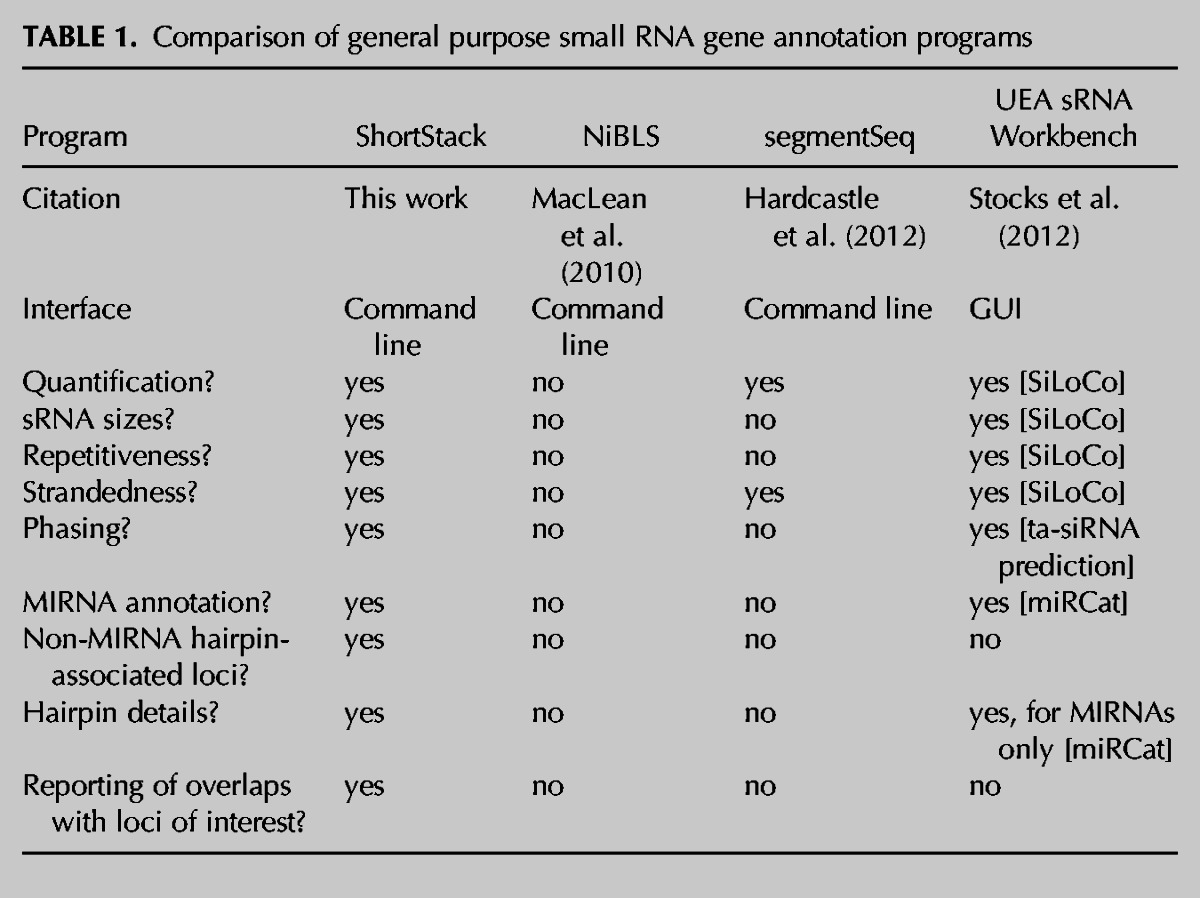
TABLE 2.
Small RNA-seq data sets used in this study
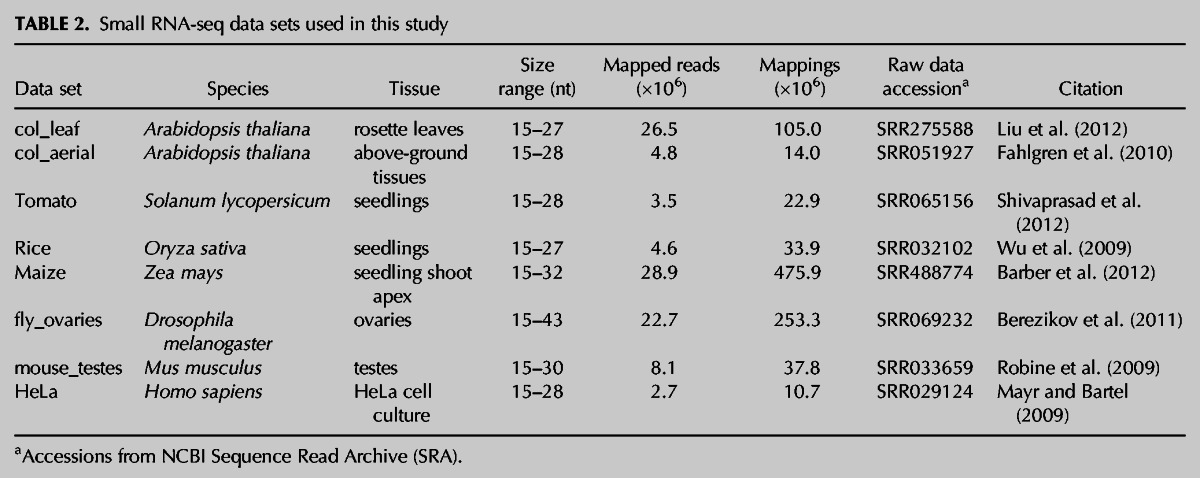
TABLE 3.
Performance characteristics of small RNA clustering programs
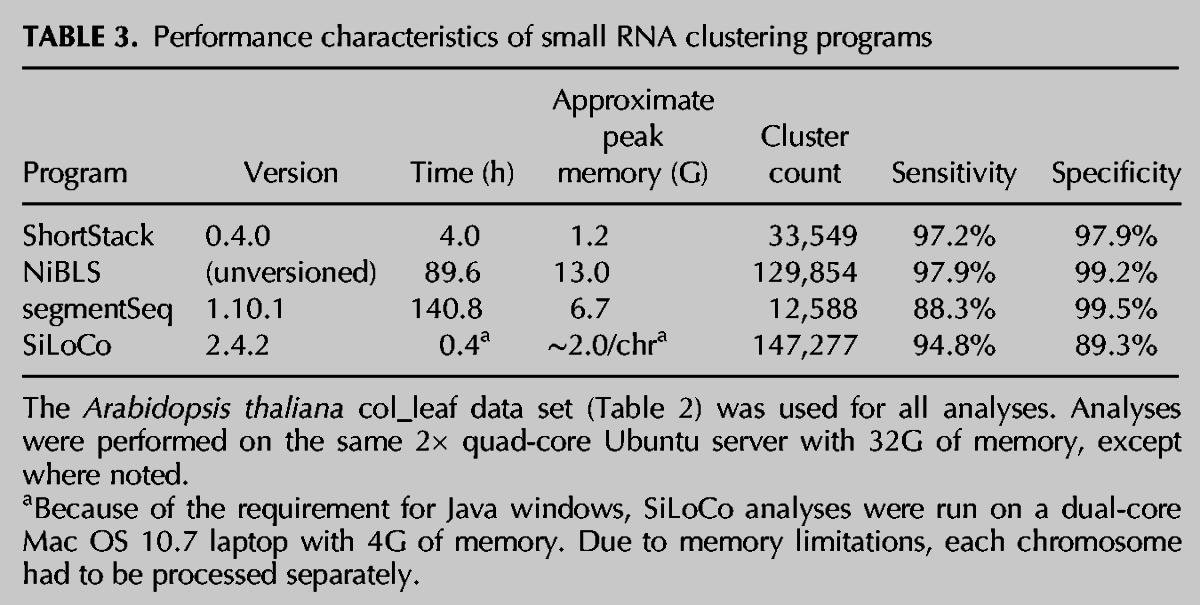
Assessment of the sensitivities and specificities of these methods is complicated by the fact that there is not a gold-standard reference set of all true small RNA loci for Arabidopsis (or any other species). Thus, an alternative approach was taken. All mappings of each small RNA were assumed to be positives such that a perfect classifier would place all mappings within an annotated small RNA locus (true positives). Any mappings not included in a cluster were considered false negatives. Conversely, all genomic regions devoid of any small RNA mappings were assumed to be negatives such that a perfect classifier would not include any such regions in annotated small RNA loci (true negatives). Negative genomic regions were split into 24-nt intervals, representing small RNA nonreads. Any nonreads overlapping annotated small RNA loci were considered false positives. Using these assumptions, sensitivity and specificity were defined in the standard fashion (sensitivity = true positives/[true positives + false negatives]; specificity = true negatives/[true negatives + false positives]). Of the four methods, only one (NiBLS) had both a higher sensitivity and specificity than ShortStack (Table 3). However, NiBLS analysis was >10-fold more computationally intensive both in terms of CPU time and memory usage (Table 3) and does not provide any detailed description of the found loci (Table 1). Overall, ShortStack compares favorably to other methods for de novo discovery of small RNA genes.
The two parameters with the most direct effects upon de novo small RNA gene discovery are --mindepth and --pad (Fig. 1B), which are expected to primarily affect sensitivity and specificity, respectively. The effect of varying both parameters across four orders of magnitude was tested using the col_leaf data set. The resulting receiver operating characteristic (ROC) curves showed the predicted trends, with increasing --mindepth values decreasing the sensitivity, and increasing --pad values increasing the false positive rate (FPR) (Fig. 3A). Importantly, except for extreme values of --pad and/or --mindepth, most parameter combinations tested resulted in both high sensitivity and high specificity, including the default settings. The number of small RNA clusters also varied tremendously with different --mindepth and --pad settings (Fig. 3B). Increasing values of --pad always resulted in fewer clusters. Increasing values of --mindepth mostly resulted in fewer clusters as well. The exceptions to this trend were under low --mindepth, high --pad conditions, where there are likely to be extensive amounts of aggressive merging of frequent, sparsely populated islands of coverage (Fig. 3B).
FIGURE 3.
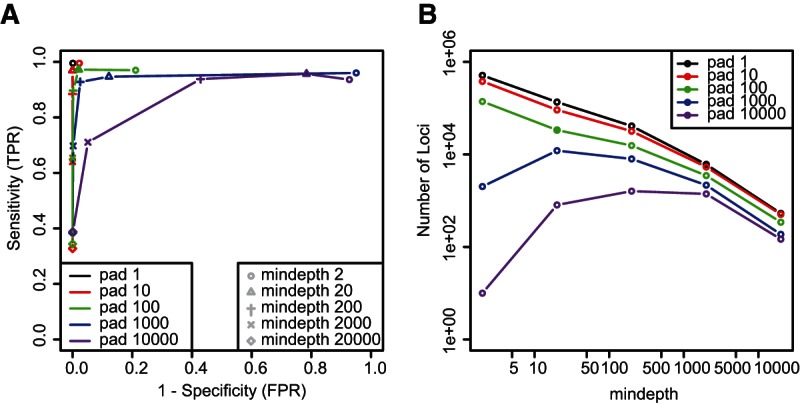
Performance analysis of small RNA clustering by ShortStack. (A) Receiver operating characteristic (ROC) curves based on ShortStack analyses of the col_leaf data set in --nohp mode, using the indicated values of options --pad and --mindepth. (TPR) True positive rate, (FPR) false positive rate. Filled triangle indicates default settings. (B) Number of small RNA loci from the col_leaf data set annotated by ShortStack with the indicated settings of --pad and --mindepth. Filled circle indicates default settings.
Discovery and annotation of small RNA genes in seven species
ShortStack was next used for analysis of small RNA-seq data from seven different species: four plants (Arabidopsis, tomato, rice, and maize) and three animals (Drosophila, mouse, and human) (Table 2). The choice of species was made based upon the presence of complete nuclear genome assemblies, diversity of gross genomic characteristics and sizes, and comparison of plants and animals (which are known to have major differences in endogenous small RNA content). The choice of specific data sets was made based on robust depth of sequencing (all had more than 2 million mapped reads) and the availability of the raw data (to ensure uniform conditions in adapter trimming and read mapping).
Clusters with a DicerCall of 24 were the most frequent gene type in all five plant data sets (Fig. 4A), and in all but one of the plant samples, they also produced the most small RNAs in terms of abundance (Fig. 4B). Regardless of DicerCall, nearly all plant clusters were not annotated as MIRNAs or hairpin-associated RNAs (Fig. 4C). However, the less numerous MIRNAs and hairpin-associated clusters produced a large percentage of the small RNA abundance for loci dominated by 20- to 21-nt RNAs, as well as 22-nt RNAs in rice (Fig. 4D). In addition, loci with a DicerCall of “N” (indicating that the size profile of the small RNAs was inconsistent with Dicer-catalyzed biogenesis) produced a significant amount of small RNAs in all plant samples (Fig. 4B). These likely reflect the inevitable contamination of small RNA-seq data with degraded fragments of other types of RNAs but also may contain novel types of small RNA genes. Altogether, the broad overview of plant small RNA genes provided by ShortStack is consistent with prior knowledge: tens of thousands of nonhairpin-derived 24-nt endogenous siRNAs, likely associated with the plant-specific heterochromatic siRNA pathway (Law and Jacobsen 2010; Wierzbicki 2012), coupled with a much lower number (hundreds) of 20- to 22-nt MIRNAs, several of which are highly abundant (Cuperus et al. 2011).
FIGURE 4.

General features of small RNA-producing genes from seven species. (A) Numbers of ShortStack-annotated small RNA genes by data set and DicerCall. Data sets are described in Table 2. The DicerCall indicates the predominant size of small RNA produced by a gene. DicerCalls of “N” are given to loci where <80% of the mapped small RNAs were outside of the allowable size range. (B) Small RNA abundances by data set and DicerCall. (RPM) Reads per million. (C) Fractions of genes of the indicated DicerCalls annotated as hairpin-associated (HP), MIRNAs, or nonstructured loci (None). (D) Fractions of small RNA abundance values for genes of the indicated DicerCalls derived from HP, MIRNA, or nonstructured loci (None).
Drosophila ovaries are known to produce a complex mixture of small RNAs, including canonical ∼22-nt miRNAs, ∼24- to 27-nt piRNAs, and many 21-nt endogenous siRNAs (Brennecke et al. 2007; Czech et al. 2008). Consistent with expectations, loci dominated by 24- to 26-nt RNAs, as was all those dominated by 21-nt RNAs, were the most frequent and abundant type of loci recovered by ShortStack analysis of the fly_ovary data set (Fig. 4A,B). Very few of the fly_ovary small RNA loci were MIRNAs or hairpin-associated (Fig. 4C), but those that were produced a high proportion of the small RNA abundance from the 21- to 24-nt RNA-dominated loci (Fig. 4D). Mouse testes contain ∼22-nt miRNAs as well as abundant ∼26- to 30-nt piRNAs (Aravin et al. 2006; Gan et al. 2011). However, most of the ShortStack-identified small RNA clusters for the mouse_testes data set had a DicerCall of N (Fig. 4A). This may reflect a large number of loci corresponding to degraded, nonsilencing RNAs in this sample. In terms of small RNA abundance, however, loci with a DicerCall of 30 dominated, with a smaller peak of 21- to 23-nt loci also apparent (Fig. 4B). Like in all of the other species examined, MIRNAs and hairpin-associated loci were rare in the mouse_testes data (Fig. 4C), but the small number of such loci produced a relatively high proportion of the small RNA abundance (Fig. 4D). Finally, the HeLa sample was dominated by clusters with a DicerCall of N (Fig. 4A,B), indicating likely substantial contamination with degraded RNAs. Nonetheless, a very high proportion of small RNA abundance for 20- and 22- to 24-nt clusters was provided by MIRNAs (Fig. 4D). Overall, ShortStack analysis of these eight samples from seven different species has revealed broad patterns of small RNA genes consistent with expectations from prior knowledge.
Specific examples of diverse non-MIRNA genes
In plants, small RNA-directed slicing of target transcripts can lead to production of dsRNA by an endogenous RNA-dependent RNA polymerase which uses the sliced remnant as a substrate (Allen et al. 2005). The uniform starting point of these dsRNAs (defined by the site of precursor slicing) leads to the production of DICER-LIKE 4 (DCL4)-derived siRNAs that are in successive ∼21-nt phases with each other. ShortStack uses a robust modification of the procedure described by Chen et al. (2007) to assess the phasing pattern of small RNA loci. A list of 25 Arabidopsis small RNA loci previously annotated as producing phased siRNAs was curated from the literature (Howell et al. 2007; Chen et al. 2010). Nineteen and 18 of these loci, respectively, produced one or more ShortStack-identified small RNA clusters with DicerCalls of 21 in the col_leaf and col_aerial data sets, respectively. Because a few of these previously annotated loci had two associated ShortStack-identified clusters, the total number of previously known clusters was 20 in both cases. Most of these clusters (13 of 20 and 14 of 20 for the col_leaf and col_aerial data sets, respectively) were found by ShortStack to be significantly phased at a false discovery rate (FDR) of 0.05 (Fig. 5A,B). For tomato, a list of 19 loci previously described as producing phased small RNAs was also curated from Shivaprasad et al. (2012). Eleven ShortStack-identified small RNA clusters with DicerCalls of 21, corresponding to 10 of these loci, were found. Four of the 11 were significantly phased (FDR = 0.05), and another three loci had borderline P-values (Fig. 5C). For both Arabidopsis and tomato, several clusters not overlapping previously described phased loci were also found to be significantly phased (Fig. 5A–C), indicating that ShortStack-based analysis can reveal new phased loci.
FIGURE 5.

ShortStack annotates diverse types of small RNA genes. (A) Cumulative fraction of all col_leaf small RNA genes with a DicerCall of 21 that were subjected to phasing analysis, ranked by adjusted P-value. The ShortStack-generated P-values were adjusted using the Benjamini-Hochberg procedure to control for the false discovery rate (FDR) during multiple testing; the dotted line indicates an FDR of 0.05. Points in red represent ShortStack clusters that overlap a list of Arabidopsis loci previously described to produce phased small RNAs. (B) As in A, for the col_aerial data set. (C) As in A, for the tomato data set, using a list of tomato loci previously described as producing phased small RNAs. (D) Scatterplot of hairpin length as a function of small RNA abundance for all loci annotated as hairpin-associated (HP) from the col_leaf data set. Dotted lines indicate cutoffs for long hairpins (>500 nt) and highly abundant (>100 reads per million). Two known loci, IR71 and IR2039, are labeled. This ShortStack analysis increased the value of option --pad from the default value of 100 to 300. (E) As in D, except for the col_aerial data set. (F) ShortStack-annotated small RNA genes from the fly_ovary analysis that overlap a set of known endo-siRNA loci from Drosophila ovaries, grouped by DicerCall and secondary structure. (G) As in F, except for a set of known Drosophila piRNA loci. (H) As in F, except for the mouse_testes analysis with respect to a set of previously described murine piRNA loci. (I) ShortStack-generated polarity assignments for small RNA genes overlapping previously annotated sets of piRNA loci from Drosophila and mouse. (ds) Double-stranded.
Besides MIRNAs and miRNA-like hairpins, plants can also produce small RNAs from very large hairpins, with stem lengths of >500 nt. The two best-studied examples of these type of loci are the IR71 and IR2039 loci of Arabidopsis (Henderson et al. 2006; Dunoyer et al. 2010). Under the default ShortStack parameters, IR2039, but not IR71, was annotated as a hairpin-derived locus. IR71 was instead annotated as two separate, nonhairpin loci (one for each arm), separated by ∼250 nt in both libraries when analyzed under default settings. This reflected the large loop size (∼250 nt) of the IR71 hairpin. Increasing the --pad smoothing parameter (Fig. 1B) from the default 100 nt to 300 nt allowed the correct annotation of both IR71 and IR2039 as hairpin-associated loci (Fig. 5D,E). This example provides a useful lesson for hairpin discovery using ShortStack: Small RNA-producing hairpins with loops larger than the --pad size will likely be identified instead as two separate, nonhairpin-associated clusters, with one for each hairpin arm. It was also apparent that IR71 and IR2039 are unique outliers: No other Arabidopsis hairpin-associated loci were both highly abundant (>100 reads per million) and had large stems (>500 nt) (Fig. 5D,E). Finally, it was noted that IR2039 was dominated by 24-nt RNAs in the col_leaf data set and by 22-nt RNAs in the col_aerial data set, although in both cases there was a complex mixture of several small RNA sizes, consistent with prior observations (Dunoyer et al. 2010).
Fly ovaries express many 21-nt endo-siRNAs from the overlapping regions of genes found in a tail-to-tail antisense overlapping orientation (Czech et al. 2008). These loci were expected to be annotated as loci with DicerCalls of 21 devoid of hairpin or MIRNA characteristics. Forty-five out of the 50 such ovarian endo-siRNA loci described by Czech et al. (2008) overlapped with one or more ShortStack-annotated small RNA clusters. As expected, nearly all of these clusters had a DicerCall of 21 and no hairpin association (Fig. 5F).
Both Drosophila ovaries and mouse testes produce abundant piRNAs from several broad genomic intervals (Aravin et al. 2006; Brennecke et al. 2007; Czech et al. 2008; Gan et al. 2011). A set of 14 broad genomic regions with significant piRNA accumulation from Drosophila ovaries was curated from (Brennecke et al. 2007). ShortStack analysis found small RNA clusters overlapping each of these 14 loci; in many cases, ShortStack identified multiple discrete regions within individual loci (ranging from one to 55). Consistent with expectations for Drosophila piRNAs, most of these clusters had DicerCalls of between 24 and 26 and were not annotated as hairpin-associated or MIRNAs (Fig. 5G). Aravin et al. (2006) described 42 large genomic regions as murine piRNA clusters based upon analysis of MILI-associated RNAs with respect to the mm6 version of the mouse genome. Forty of these loci remained intact (i.e., not duplicated or truncated) in the current mm10 genome release, and all 40 were covered by one or more ShortStack-annotated locus. Consistent with the longer length of murine piRNAs relative to Drosophila piRNAs, most of these clusters had DicerCalls of 29 or 30 (Fig. 5H). Roughly 60% of the fly_ovary piRNA clusters were annotated as single-stranded (either from the + or − genomic strand), with the other ∼40% producing significant amounts of small RNAs from both strands (Fig. 5I). In contrast, over 90% of the mouse_testes piRNA clusters were single-stranded. This difference is consistent with the prior observations that some piRNA clusters in Drosophila produce piRNAs from both strands (Brennecke et al. 2007), while most piRNA clusters expressed in mouse testes are long regions of single-stranded piRNA accumulation (Aravin et al. 2006). Taken together, these examples show that ShortStack can capture the essential features of very diverse types of small RNA loci from a wide variety of organisms.
ShortStack’s MIRNA annotations are highly specific in both plants and animals
To assess ShortStack’s performance in MIRNA annotation, the results were compared against miRBase (version 19) entries for each of the respective species. To adjust for the fact that not all MIRNAs are expressed in a single given tissue, only the subsets of miRBase loci for which at least one mapped read corresponding to the annotated mature miRNA was present were considered as positives within each data set. ShortStack-annotated MIRNA loci that corresponded with these miRBase mature present loci were considered true positives, while ShortStack-annotated MIRNA loci that were not part of the miRBase mature present set were considered false positives. miRBase mature present loci that were not annotated by ShortStack as MIRNAs were considered false negatives. Sensitivities (true positives/[true positives + false negatives]) of MIRNA annotation by ShortStack ranged from 48% (col_leaf) to 22% (HeLa) (Fig. 6A–I). False positives were low, with only three samples (tomato, rice, and maize) having more than 10 false positives and especially low false positive counts for the animal data sets (Fig. 6A–H,J). There are important caveats associated with this analysis method. False positive MIRNAs may be legitimate MIRNA loci that haven’t previously been annotated in miRBase, while false negatives might represent loci that have been erroneously annotated as MIRNAs (Meng et al. 2012). Thus, the calculated sensitivities for MIRNA annotation are likely to be underestimates, while the numbers of false positives are likely to be overestimates.
FIGURE 6.

ShortStack’s MIRNA annotations are highly specific in both plants and animals. (A–H) Area-proportional elliptical Euler diagrams depicting overlaps between loci annotated as MIRNAs by miRBase (version 19), ShortStack, and miRDeep2 for the indicated data sets. Numbers indicate the MIRNA locus counts for each sector. miRBase loci are restricted to those for which at least one small RNA corresponding to the known mature miRNA was mapped to its corresponding locus in the data set; these are the “miRBase mature present” loci. Diagrams were rendered by eulerAPE (http://www.eulerdiagrams.org/eulerAPE/) version 2.0.3. (I) Sensitivity of MIRNA annotation by ShortStack and miRDeep2 by data set. (J) Numbers of false positive MIRNA annotations by ShortStack and miRDeep2 by data set.
To provide a comparison for ShortStack’s performance in MIRNA annotation, the dedicated MIRNA annotation program miRDeep2 (Friedländer et al. 2012) was also used to analyze all eight data sets. miRDeep2 was selected for this comparison because it has been shown to function efficiently on large data sets and to provide robust results for diverse animal species (Friedländer et al. 2012). However, miRDeep2 does not account for the increased structural diversity seen in plant MIRNAs (Fig. 2), and so, suboptimal performance of miRDeep2 on plant data sets was expected. Unfortunately, attempts to use the plant-specific MIRNA-annotation methods miRDeep-P (Yang and Li 2011), miRCAT (Stocks et al. 2012), and miRDeepFinder (Xie et al. 2012) on the five plant data sets were not successful. miRDeep-P required excessive CPU time, while miRCAT required excessive memory, such that neither method could be completed on the col_leaf data set using available equipment (a 2× quad-core Ubuntu server with 32G memory). Therefore, both methods seem to be limited to data sets smaller than the ones analyzed here, or alternatively, both require high-performance computing. miRDeepFinder requires extensive installations of third-party databases (six) to function and was not pursued. As expected, the sensitivity of miRDeep2 was much higher for the three animal data sets (66%–76%) relative to the five plant data sets (15%–44%) (Fig. 6A–I). However, regardless of kingdom, miRDeep2 always annotated more MIRNAs (Fig. 6A–H), with substantially more false positives than ShortStack (Fig. 6J). Based on this analysis, ShortStack’s annotations of MIRNA loci are highly specific, with very few false positives. By comparison, miRDeep2 appears to be more sensitive for animal MIRNAs but at the cost of increased false positives regardless of kingdom. However, it is important to reiterate that, because of the imperfect nature of existing miRBase annotations, this analysis is underestimating sensitivities and overestimating false positives for both ShortStack and miRDeep2.
Conclusions
Testing with small RNA-seq data from seven species has demonstrated that ShortStack can effectively annotate highly diverse data sets and capture the key information required for up-to-date classification of small RNA-expressing genes, including MIRNA and hairpin-association, strandedness, small RNA size distribution, phasing, repetitiveness, and quantification. The flexibility of ShortStack should enable future experiments to discover novel classes of small RNA genes, as well as provide the basis for comprehensive reference annotations of small RNA-producing genes. In contrast to some tools, such as the UEA sRNA Workbench (Stocks et al. 2012), ShortStack does not provide direct visualization support (although ShortStack does output a browser track and plain-text alignments for hairpin and MIRNA loci). However, ShortStack’s integrated, flexible, one-command approach to small RNA-seq annotation, easily parsed output, demonstrated results in two kingdoms of life, and suitability for analysis of very large small RNA-seq data sets suggest that it may prove to be a broadly useful tool for small RNA researchers.
MATERIALS AND METHODS
Software availability and methods
The general procedure by which ShortStack functions is described in the Results and Discussion section above, Figure 1, and in more detail within the README file distributed with the package. ShortStack is freely available, under a GNU General Public License, at http://axtell-lab-psu.weebly.com/shortstack.html.
Origins, preprocessing, and alignments of small RNA-seq data
Small RNA-seq data origins and accession numbers are in Table 2. The col_leaf raw data were in colorspace and were processed by 3′ adapter trimming using the script “trim_SOLiD_sRNA_cs-fasta.pl,” version 1.0 (http://axtell-lab-psu.weebly.com/tools.html), with options -a CGCCTTGG -e 1 -t N -h N. The resulting trimmed colorspace-fasta file was then mapped against the Arabidopsis genome using bowtie (Langmead et al. 2009) version 0.12.8 with options -C -f -v 1 --best --strata -k 50 --col-keepends -S. The bowtie output was piped through the “Prep_bam.pl” script (part of the ShortStack package; http://axtell-lab-psu.weebly.com/shortstack.html) version 0.1.1 to produce a properly formatted and sorted BAM alignment file. For the other seven data sets, the raw data were in FASTQ format and were first parsed to shorten and simplify the read names (to save space). The reads were then trimmed to remove 3′ adapters using the script “trim_illumina_sRNA_fastq.pl” (http://axtell-lab-psu.weebly.com/tools.html) version 0.3 with the options -a [xxx] -e 1 -q N, where [xxx] represents the eight-base adapter queries specific to each library, which were CTGTAGGC (col_aerial, rice, and fly_ovary), TCGTATGC (tomato, mouse_testes, HeLa), and TGGAATTC (maize). The resulting trimmed FASTA formatted files were then mapped to their respective reference genomes as described above, except that the bowtie parameters were -f -v 1 --best --strata -k 50 -S. The reference genome versions used were TAIR10 (Arabidopsis thaliana; including plastid and mitochondrial genomes), ITAG2-3 (Solanum lycopersicum), Os_v7 (Oryza sativa), ZmB73v2 (Zea mays), dmel_5-45 (Drosophila melanogaster), mm10 (Mus musculus), and hg19 (Homo sapiens). All reference genomes were the unmasked versions. The BAM alignment files used in this study are available at http://axtelldata.bio.psu.edu/data/ShortStack_Paper_Data/.
Analysis details
All analyses were performed on systems that had RNALfold (Hofacker et al. 2004) (from version 1.8.6 of the Vienna RNA Package) and samtools (Li et al. 2009) (version 0.1.18) installed. Analysis of the col_leaf, col_aerial, rice, and maize data sets was performed with ShortStack version 0.4.0, while all other analyses (tomato, fly_ovary, mouse_testes, and HeLa) used version 0.4.1. The only difference between version 0.4.0 and version 0.4.1 is a small bug-fix (discovered when attempting to analyze the tomato data set with version 0.4.0) that prevents rare entry into an infinite loop state when searching for miRNA* sequences; the version difference does not otherwise affect the results.
Most ShortStack runs using plant data sets were run on default settings for all options. The exceptions were the analyses of the col_leaf data related to the ROC curves (Fig. 3), which were run in --nohp mode, and the col_leaf and col_aerial analyses underlying Figure 5D and E, respectively, for which option --pad was increased to 300. All animal data sets were analyzed with the nondefault options --miRType animal --phasesize none. In addition, the --dicermax parameter was increased to 28 and 30 for the fly_ovary and mouse_testes data sets, respectively, to allow recovery of piRNA clusters. The complete ShortStack results for all eight data sets are available at http://axtelldata.bio.psu.edu/data/ShortStack_Paper_Data/.
Ancillary data
All ShortStack analyses made use of a file of inverted repeats (passed as option --inv_file) specific to the respective reference genomes. These files were generated as follows: First, einverted (from the EMBOSS package) (Rice et al. 2000) was used to analyze each reference genome with the options -maxrepeat 10000 -auto. For most genomes, this analysis had to be completed one chromosome at a time to prevent excessive memory consumption. The results were merged into a single file for each genome and then filtered to retain only those entries that had ≥67% of the stem nucleotides paired, ≥15 absolute number of base pairs, and those that had a loop size that did not exceed 50% of the helix length. All ShortStack analyses also used a file containing the coordinates of miRBase (version 19) MIRNA loci, passed as option --flag_file. These files were generated by taking the top-scoring megablast hit for each MIRNA hairpin sequence against the corresponding reference genomes. In some cases, there were duplicate locations for different miRBase entries (in such cases, one was arbitrarily selected), and in other cases, there were no hits at all; thus, the number of entries in each of these lists may differ slightly from the miRBase tallies. The filtered inverted repeat files and coordinate lists of miRBase loci for all seven genomes are available at http://axtelldata.bio.psu.edu/data/ShortStack_Paper_Data/.
A list of Arabidopsis thaliana genes known to produce phased small RNAs was curated from Howell et al. (2007) and Chen et al. (2010) and the coordinates of those genes within the TAIR10 assembly found from the TAIR website. A list of tomato unigenes known to produce phased small RNAs was curated from Shivaprasad et al. (2012) and their coordinates on the ITAG2-3 genome assembly determined based on the best blat hit. The locations of IR71 and IR2039 within the Arabidopsis genome were from Dunoyer et al. (2010). The locations of Drosophila endo-siRNA loci were from Czech et al. (2008) and those of Drosophila piRNA loci were from Brennecke et al. (2007). piRNA loci from mouse testes were based on genomic coordinates from Aravin et al. (2006) and were adjusted to match the mm10 genome assembly. Files containing each of these lists and their respective genomic coordinates are available at http://axtelldata.bio.psu.edu/data/ShortStack_Paper_Data/.
ACKNOWLEDGMENTS
I thank Zhaorong Ma and Saima Shahid for useful discussions and suggestions during ShortStack development and comments on this manuscript. This work was supported by awards from the Searle Scholar’s Program and the Beckman Young Investigator Program to M.J.A.
REFERENCES
- Allen E, Xie Z, Gustafson AM, Carrington JC 2005. microRNA-directed phasing during trans-acting siRNA biogenesis in plants. Cell 121: 207–221 [DOI] [PubMed] [Google Scholar]
- Aravin A, Gaidatzis D, Pfeffer S, Lagos-Quintana M, Landgraf P, Iovino N, Morris P, Brownstein MJ, Kuramochi-Miyagawa S, Nakano T, et al. 2006. A novel class of small RNAs binds to MILI protein in mouse testes. Nature 442: 203–207 [DOI] [PubMed] [Google Scholar]
- Barber WT, Zhang W, Win H, Varala KK, Dorweiler JE, Hudson ME, Moose SP 2012. Repeat associated small RNAs vary among parents and following hybridization in maize. Proc Natl Acad Sci 109: 10444–10449 [DOI] [PMC free article] [PubMed] [Google Scholar]
- Berezikov E, Robine N, Samsonova A, Westholm JO, Naqvi A, Hung J-H, Okamura K, Dai Q, Bortolamiol-Becet D, Martin R, et al. 2011. Deep annotation of Drosophila melanogaster microRNAs yields insights into their processing, modification, and emergence. Genome Res 21: 203–215 [DOI] [PMC free article] [PubMed] [Google Scholar]
- Brennecke J, Aravin AA, Stark A, Dus M, Kellis M, Sachidanandam R, Hannon GJ 2007. Discrete small RNA-generating loci as master regulators of transposon activity in Drosophila. Cell 128: 1089–1103 [DOI] [PubMed] [Google Scholar]
- Chen H-M, Li Y-H, Wu S-H 2007. Bioinformatic prediction and experimental validation of a microRNA-directed tandem trans-acting siRNA cascade in Arabidopsis. Proc Natl Acad Sci 104: 3318–3323 [DOI] [PMC free article] [PubMed] [Google Scholar]
- Chen H-M, Chen L-T, Patel K, Li Y-H, Baulcombe DC, Wu S-H 2010. 22-nucleotide RNAs trigger secondary siRNA biogenesis in plants. Proc Natl Acad Sci 107: 15269–15274 [DOI] [PMC free article] [PubMed] [Google Scholar]
- Cho SH, Addo-Quaye C, Coruh C, Arif MA, Ma Z, Frank W, Axtell MJ 2008. Physcomitrella patens DCL3 is required for 22–24 nt siRNA accumulation, suppression of retrotransposon-derived transcripts, and normal development. PLoS Genet 4: e1000314. [DOI] [PMC free article] [PubMed] [Google Scholar]
- Cloonan N, Wani S, Xu Q, Gu J, Lea K, Heater S, Barbacioru C, Steptoe AL, Martin HC, Nourbakhsh E, et al. 2011. MicroRNAs and their isomiRs function cooperatively to target common biological pathways. Genome Biol 12: R126. [DOI] [PMC free article] [PubMed] [Google Scholar]
- Cuperus JT, Carbonell A, Fahlgren N, Garcia-Ruiz H, Burke RT, Takeda A, Sullivan CM, Gilbert SD, Montgomery TA, Carrington JC 2010. Unique functionality of 22 nt miRNAs in triggering RDR6-dependent siRNA biogenesis from target transcripts in Arabidopsis. Nat Struct Mol Biol 17: 997–1003 [DOI] [PMC free article] [PubMed] [Google Scholar]
- Cuperus JT, Fahlgren N, Carrington JC 2011. Evolution and functional diversification of MIRNA genes. Plant Cell 23: 431–442 [DOI] [PMC free article] [PubMed] [Google Scholar]
- Czech B, Malone CD, Zhou R, Stark A, Schlingeheyde C, Dus M, Perrimon N, Kellis M, Wohlschlegel JA, Sachidanandam R, et al. 2008. An endogenous small interfering RNA pathway in Drosophila. Nature 453: 798–802 [DOI] [PMC free article] [PubMed] [Google Scholar]
- Dunoyer P, Brosnan CA, Schott G, Wang Y, Jay F, Alioua A, Himber C, Voinnet O 2010. An endogenous, systemic RNAi pathway in plants. EMBO J 29: 1699–1712 [DOI] [PMC free article] [PubMed] [Google Scholar] [Retracted]
- Fahlgren N, Jogdeo S, Kasschau KD, Sullivan CM, Chapman EJ, Laubinger S, Smith LM, Dasenko M, Givan SA, Weigel D, et al. 2010. MicroRNA gene evolution in Arabidopsis lyrata and Arabidopsis thaliana. Plant Cell 22: 1074–1089 [DOI] [PMC free article] [PubMed] [Google Scholar]
- Friedländer MR, Mackowiak SD, Li N, Chen W, Rajewsky N 2012. miRDeep2 accurately identifies known and hundreds of novel microRNA genes in seven animal clades. Nucleic Acids Res 40: 37–52 [DOI] [PMC free article] [PubMed] [Google Scholar]
- Gan H, Lin X, Zhang Z, Zhang W, Liao S, Wang L, Han C 2011. piRNA profiling during specific stages of mouse spermatogenesis. RNA 17: 1191–1203 [DOI] [PMC free article] [PubMed] [Google Scholar]
- Hardcastle TJ, Kelly KA, Baulcombe DC 2012. Identifying small interfering RNA loci from high-throughput sequencing data. Bioinformatics 28: 457–463 [DOI] [PubMed] [Google Scholar]
- Henderson IR, Zhang X, Lu C, Johnson L, Meyers BC, Green PJ, Jacobsen SE 2006. Dissecting Arabidopsis thaliana DICER function in small RNA processing, gene silencing and DNA methylation patterning. Nat Genet 38: 721–725 [DOI] [PubMed] [Google Scholar]
- Hofacker IL, Priwitzer B, Stadler PF 2004. Prediction of locally stable RNA secondary structures for genome-wide surveys. Bioinformatics 20: 186–190 [DOI] [PubMed] [Google Scholar]
- Howell MD, Fahlgren N, Chapman EJ, Cumbie JS, Sullivan CM, Givan SA, Kasschau KD, Carrington JC 2007. Genome-wide analysis of the RNA-DEPENDENT RNA POLYMERASE6/DICER-LIKE4 pathway in Arabidopsis reveals dependency on miRNA- and tasiRNA-directed targeting. Plant Cell 19: 926–942 [DOI] [PMC free article] [PubMed] [Google Scholar]
- Jayaprakash AD, Jabado O, Brown BD, Sachidanandam R 2011. Identification and remediation of biases in the activity of RNA ligases in small-RNA deep sequencing. Nucleic Acids Res 39: e141. [DOI] [PMC free article] [PubMed] [Google Scholar]
- Juliano C, Wang J, Lin H 2011. Uniting germline and stem cells: The function of Piwi proteins and the piRNA pathway in diverse organisms. Annu Rev Genet 45: 447–469 [DOI] [PMC free article] [PubMed] [Google Scholar]
- Kasschau KD, Fahlgren N, Chapman EJ, Sullivan CM, Cumbie JS, Givan SA, Carrington JC 2007. Genome-wide profiling and analysis of Arabidopsis siRNAs. PLoS Biol 5: e57. [DOI] [PMC free article] [PubMed] [Google Scholar]
- Langmead B, Trapnell C, Pop M, Salzberg SL 2009. Ultrafast and memory-efficient alignment of short DNA sequences to the human genome. Genome Biol 10: R25. [DOI] [PMC free article] [PubMed] [Google Scholar]
- Law JA, Jacobsen SE 2010. Establishing, maintaining and modifying DNA methylation patterns in plants and animals. Nat Rev Genet 11: 204–220 [DOI] [PMC free article] [PubMed] [Google Scholar]
- Lee T-F, Gurazada SGR, Zhai J, Li S, Simon SA, Matzke MA, Chen X, Meyers BC 2012. RNA polymerase V-dependent small RNAs in Arabidopsis originate from small, intergenic loci including most SINE repeats. Epigenetics 7: 781–795 [DOI] [PMC free article] [PubMed] [Google Scholar]
- Li H, Handsaker B, Wysoker A, Fennell T, Ruan J, Homer N, Marth G, Abecasis G, Durbin R 2009. The Sequence Alignment/Map format and SAMtools. Bioinformatics 25: 2078–2079 [DOI] [PMC free article] [PubMed] [Google Scholar]
- Li Y, Zhang Z, Liu F, Vongsangnak W, Jing Q, Shen B 2012. Performance comparison and evaluation of software tools for microRNA deep-sequencing data analysis. Nucleic Acids Res 40: 4298–4305 [DOI] [PMC free article] [PubMed] [Google Scholar]
- Liu C, Axtell MJ, Fedoroff NV 2012. The helicase and RNaseIIIa domains of Arabidopsis DCL1 modulate catalytic parameters during microRNA biogenesis. Plant Physiol 159: 748–758 [DOI] [PMC free article] [PubMed] [Google Scholar]
- Lu C, Kulkarni K, Souret FF, MuthuValliappan R, Tej SS, Poethig RS, Henderson IR, Jacobsen SE, Wang W, Green PJ, et al. 2006. MicroRNAs and other small RNAs enriched in the Arabidopsis RNA-dependent RNA polymerase-2 mutant. Genome Res 16: 1276–1288 [DOI] [PMC free article] [PubMed] [Google Scholar]
- MacLean D, Moulton V, Studholme DJ 2010. Finding sRNA generative locales from high-throughput sequencing data with NiBLS. BMC Bioinformatics 11: 93. [DOI] [PMC free article] [PubMed] [Google Scholar]
- Matzke M, Kanno T, Daxinger L, Huettel B, Matzke AJ 2009. RNA-mediated chromatin-based silencing in plants. Curr Opin Cell Biol 21: 367–376 [DOI] [PubMed] [Google Scholar]
- Mayr C, Bartel DP 2009. Widespread shortening of 3′UTRs by alternative cleavage and polyadenylation activates oncogenes in cancer cells. Cell 138: 673–684 [DOI] [PMC free article] [PubMed] [Google Scholar]
- Meng Y, Shao C, Wang H, Chen M 2012. Are all the miRBase-registered microRNAs true? A structure- and expression-based re-examination in plants. RNA Biol 9: 249–253 [DOI] [PubMed] [Google Scholar]
- Meyers BC, Axtell MJ, Bartel B, Bartel DP, Baulcombe D, Bowman JL, Cao X, Carrington JC, Chen X, Green PJ, et al. 2008. Criteria for annotation of plant MicroRNAs. Plant Cell 20: 3186–3190 [DOI] [PMC free article] [PubMed] [Google Scholar]
- Mosher RA, Schwach F, Studholme D, Baulcombe DC 2008. PolIVb influences RNA-directed DNA methylation independently of its role in siRNA biogenesis. Proc Natl Acad Sci 105: 3145–3150 [DOI] [PMC free article] [PubMed] [Google Scholar]
- Moxon S, Schwach F, Dalmay T, Maclean D, Studholme DJ, Moulton V 2008. A toolkit for analysing large-scale plant small RNA datasets. Bioinformatics 24: 2252–2253 [DOI] [PubMed] [Google Scholar]
- Okamura K, Chung W-J, Ruby JG, Guo H, Bartel DP, Lai EC 2008. The Drosophila hairpin RNA pathway generates endogenous short interfering RNAs. Nature 453: 803–806 [DOI] [PMC free article] [PubMed] [Google Scholar]
- R Core Development Team 2010. R: A language and environment for statistical computing. R Foundation for Statistical Computing, Vienna, Austria [Google Scholar]
- Rice P, Longden I, Bleasby A 2000. EMBOSS: The European Molecular Biology Open Software Suite. Trends Genet 16: 276–277 [DOI] [PubMed] [Google Scholar]
- Robine N, Lau NC, Balla S, Jin Z, Okamura K, Kuramochi-Miyagawa S, Blower MD, Lai EC 2009. A broadly conserved pathway generates 3′UTR-directed primary piRNAs. Curr Biol 19: 2066–2076 [DOI] [PMC free article] [PubMed] [Google Scholar]
- Shivaprasad PV, Chen H-M, Patel K, Bond DM, Santos BACM, Baulcombe DC 2012. A microRNA superfamily regulates nucleotide binding site-leucine-rich repeats and other mRNAs. Plant Cell 24: 859–874 [DOI] [PMC free article] [PubMed] [Google Scholar]
- Sorefan K, Pais H, Hall AE, Kozomara A, Griffiths-Jones S, Moulton V, Dalmay T 2012. Reducing sequencing bias of small RNAs. Silence 3: 4. [DOI] [PMC free article] [PubMed] [Google Scholar]
- Stocks MB, Moxon S, Mapleson D, Woolfenden HC, Mohorianu I, Folkes L, Schwach F, Dalmay T, Moulton V 2012. The UEA sRNA workbench: A suite of tools for analysing and visualising next generation sequencing microRNA and small RNA datasets. Bioinformatics 28: 2059–2061 [DOI] [PMC free article] [PubMed] [Google Scholar]
- Wierzbicki AT 2012. The role of long non-coding RNA in transcriptional gene silencing. Curr Opin Plant Biol 15: 517–522 [DOI] [PubMed] [Google Scholar]
- Wu L, Zhang Q, Zhou H, Ni F, Wu X, Qi Y 2009. Rice MicroRNA effector complexes and targets. Plant Cell 21: 3421–3435 [DOI] [PMC free article] [PubMed] [Google Scholar]
- Xie F, Xiao P, Chen D, Xu L, Zhang B 2012. miRDeepFinder: A miRNA analysis tool for deep sequencing of plant small RNAs. Plant Mol Biol 80: 75–84 [DOI] [PubMed] [Google Scholar]
- Yang X, Li L 2011. miRDeep-P: A computational tool for analyzing the microRNA transcriptome in plants. Bioinformatics 27: 2614–2615 [DOI] [PubMed] [Google Scholar]
- Yang J-S, Phillips MD, Betel D, Mu P, Ventura A, Siepel AC, Chen KC, Lai EC 2011. Widespread regulatory activity of vertebrate microRNA* species. RNA 17: 312–326 [DOI] [PMC free article] [PubMed] [Google Scholar]
- Zhang W, Gao S, Zhou X, Xia J, Chellappan P, Zhou X, Zhang X, Jin H 2010. Multiple distinct small RNAs originate from the same microRNA precursors. Genome Biol 11: R81. [DOI] [PMC free article] [PubMed] [Google Scholar]
- Zhang X, Zhao H, Gao S, Wang W-C, Katiyar-Agarwal S, Huang H-D, Raikhel N, Jin H 2011. Arabidopsis Argonaute 2 regulates innate immunity via miRNA393*-mediated silencing of a Golgi-localized SNARE gene, MEMB12. Mol Cell 42: 356–366 [DOI] [PMC free article] [PubMed] [Google Scholar]