

The authors had previously reported that miR-1291 positively regulates the expression of Glypican-3 acting through its 3′ UTR. In this paper, they provide a thorough mechanistic analysis of this novel mechanism of positive gene expression regulation by a miRNA. Their main finding is that miR-1291 acts through an indirect mechanism by inhibiting the expression of the endoplasmic resident protein IRE1, although unusually, via interaction with its 5′ UTR, which results in an indirect up-regulation of GPC3 expression.
Keywords: microRNA, post-transcriptional up-regulation, GPC3, ERN1, RIDD, FunREG
Abstract
MicroRNAs (miRNA) are generally described as negative regulators of gene expression. However, some evidence suggests that they may also play positive roles. As such, we reported that miR-1291 leads to a GPC3 mRNA expression increase in hepatoma cells through a 3′ untranslated region (UTR)-dependent mechanism. In the absence of any direct interaction between miR-1291 and GPC3 mRNA, we hypothesized that miR-1291 could act by silencing a negative regulator of GPC3 mRNA expression. Based on in silico predictions and experimental validation, we demonstrate herein that miR-1291 represses the expression of the mRNA encoding the endoplasmic reticulum (ER)-resident stress sensor IRE1α by interacting with a specific site located in the 5′ UTR. Moreover, we show, in vitro and in cultured cells, that IRE1α cleaves GPC3 mRNA at a 3′ UTR consensus site independently of ER stress, thereby prompting GPC3 mRNA degradation. Finally, we show that the expression of a miR-1291-resistant form of IRE1α abrogates the positive effects of miR-1291 on GPC3 mRNA expression. Collectively, our data demonstrate that miR-1291 is a biologically relevant regulator of GPC3 expression in hepatoma cells and acts through silencing of the ER stress sensor IRE1α.
INTRODUCTION
MicroRNAs (miRNAs) are endogenous ∼22-nt noncoding RNAs which regulate gene expression by controlling target mRNA translation and/or degradation (Bartel 2009; Fabian et al. 2010; Huntzinger and Izaurralde 2011). In most cases, miRNAs act as post-transcriptional repressors of gene expression through mechanisms involving sequence-specific mRNA:miRNA recognition and the regulated binding of miRNA-induced silencing complexes (miRISC) on target 3′ untranslated regions (UTRs) (Pillai et al. 2007). In addition, some reports have also demonstrated the existence of miRNA-mediated target induction through molecular processes involving either the direct miRNA:target pairing or an indirect regulation through intermediary factors (Vasudevan 2012). Although the precise mechanisms underlying these phenomena remain elusive, recent evidence has provided some relevant information. For instance, some miRNAs positively regulate gene expression through a direct pairing depending on the cellular context or the site location (e.g., 5′ UTR) (Vasudevan et al. 2007; Orom et al. 2008; Vasudevan 2012). This was well illustrated with miR-10a which binds to ribosomal proteins RPS16, RPS6, and RPL9 encoding mRNA 5′ UTR and consequently enhances their translation (Orom et al. 2008). miRNAs have also been implicated in gene up-regulation by targeting promoter elements. This is the case of miR-744 and miR-1186, which induce the transcription of mouse Cyclin B1 (Huang et al. 2012). Other illustrations of miRNA-dependent gene induction were provided by recent discoveries showing that some miRNAs attenuate nonsense-mediated mRNA decay (NMD) (Bruno et al. 2011) and AU-rich-mediated decay (AMD) (Ma et al. 2010).
In a previous study, we showed that three miRNAs promote Glypican-3 (GPC3) expression in hepatoma cells by a mechanism dependent on the GPC3 3′ UTR (Maurel et al. 2013). GPC3 belongs to the heparan sulfate proteoglycan family and regulates the signaling pathways mediated by WNTs, Hedgehogs, fibroblast growth factors, and bone morphogenetic proteins (Fransson 2003; Filmus et al. 2008). GPC3 is a glycosylphosphatidylinositol (GPI) membrane-anchored protein that uses the secretory pathway to reach the plasma membrane. GPC3 is a gene involved in various human diseases including type 1 Simpson-Golabi-Behmel syndrome and Wilms tumors. Moreover, GPC3 is overexpressed in hepatocellular carcinoma (HCC) and hepatoblastoma (Jakubovic and Jothy 2007), in which its expression correlates with tumor aggressiveness and poor prognosis (Shirakawa et al. 2009). To characterize the miRNAs regulating GPC3 expression in HCC-derived cells, we screened a library of 876 human mature miRNA mimics using the GPC3 3′ UTR as a bait (Maurel et al. 2013). miR-129-1-3p, miR-1291, and miR-1303 promote the up-regulation of GPC3 mRNA expression through uncharacterized mechanisms all depending on the GPC3 3′ UTR. Interestingly, miR-1291 is more particularly up-regulated in HCC subgroups that express high levels of GPC3 (Maurel et al. 2013).
In the present study, we investigated the molecular mechanisms by which miR-1291 may induce GPC3 mRNA expression in hepatoma cells. To this end, an integrated approach combining in silico analyses, in vitro, and cell-based validations was undertaken. We demonstrate that miR-1291 represses the expression of the endoplasmic reticulum (ER)-resident endoribonuclease IRE1α, which itself promotes GPC3 mRNA decay. The latter regulation occurs through a mechanism which could be related to the regulated IRE1α-dependent decay (RIDD) of mRNA (Hollien et al. 2009), therefore adding to the repertoire of miRNA-mediated decay mechanisms of repressive protein-associated machineries.
RESULTS
miR-1291 targets an intermediate factor that regulates GPC3 mRNA expression
At first, to characterize the mechanisms involved in a miR-1291-mediated GPC3 mRNA expression increase, we used our previously described FunREG fluorescence reporter system in HCC-derived HuH7 cells (Laloo et al. 2009; Maurel et al. 2013). The average number of lentiviral transgene copies per cell [transgene copy number (TCN)] was measured by quantitative PCR in HuH7 cells expressing the eGFP-GPC3 3′ UTR transgene. Then, the cells were transfected with a mature miR-1291 mimic or a control RNA. Three days later, eGFP protein (P) and mRNA (M) expression levels were determined using FACS and RT-qPCR, respectively. Finally P/TCN, M/TCN, and P/M ratios, which, respectively, correspond to the global post-transcriptional regulation, the mRNA stability, and the translation efficiency, were calculated (Laloo et al. 2009, 2010). As previously reported (Maurel et al. 2013), FunREG ratios (Fig. 1) indicated that miR-1291 enhanced eGFP-GPC3 3′ UTR expression by ∼50%. This effect exclusively resulted from an increased mRNA stability, as the translation efficiency remained unchanged (Fig. 1). Because miR-1291 had no effect on expression of an eGFP transgene bearing a control 3′ UTR in HuH7 cells (Maurel et al. 2013), we concluded that miR-1291 stabilizes GPC3 mRNA through a mechanism involving the 3′ UTR.
FIGURE 1.

miR-1291 specifically enhances GPC3 mRNA stability through its 3′ UTR. Top panel: Schematic representation of the eGFP-GPC3 3′ UTR transgene used in this study. Bottom panel: eGFP-GPC3 3′ UTR-expressing HuH7 cells were transfected with a control RNA or miR-1291. Three days later, the transgene copy number (TCN) and the expression of eGFP protein (P) and mRNA (M) were measured. Finally, the FunREG ratios were calculated as described in Materials and Methods. (P/TCN) global post-transcriptional regulation, (M/TCN) mRNA stability, (P/M) translation efficiency. (ANOVA: P < 0.0001; n = 5.) (**) P < 0.01.
In the absence of any direct interaction between miR-1291 and GPC3 mRNA, we hypothesized that miR-1291 could act on GPC3 expression by silencing a negative regulator. Bioinformatic analysis of the 83 miR-1291 targets, predicted using miRWalk (Dweep et al. 2011) and annotated as post-transcriptional regulators using Gene Ontology (Supplemental Fig. S1), revealed only seven candidate genes whose expression products were membrane-bound and only one of them which presented an endoribonuclease activity. A functional clustering analysis of those seven candidates that integrated the Gene Ontology biological process (Supplemental Fig. S1A), specific molecular properties, including the presence of a transmembrane domain or specific RNase activity (Supplemental Fig. S1B), and the Gene Ontology cellular compartment (Supplemental Fig. S1C), which all were parsed through a scoring analysis (Troyanskaya et al. 2003), revealed that ERN1 branched out from the other candidates and presented the highest overall scores (Fig. 2A). ERN1 displayed an endogenous RNase activity and represented the best candidate that could directly regulate GPC3 mRNA stability. ERN1, also known as inositol-requiring enzyme 1 α (IRE1α) is an endoplasmic reticulum-resident transmembrane protein and a site-specific endoribonuclease activated upon accumulation of misfolded protein in this cellular compartment (ER stress). It is a major sensor of the unfolded protein response (UPR), an adaptive mechanism activated upon ER stress (Calfon et al. 2002; Schroder and Kaufman 2005). The cytoplasmic endoribonuclease domain of IRE1α was first described to cleave XBP1 mRNA in metazoans, yielding to its splicing and the production of an active transcription factor in response to ER stress (Walter and Ron 2011). In addition, Hollien and colleagues showed that, upon ER stress, IRE1α also induces the decay of mRNAs encoding membrane and secreted proteins in fly and mammalian cells through the RIDD pathway (Hollien and Weissman 2006; Hollien et al. 2009; Gaddam et al. 2013). GPC3 corresponds to the latter criteria as this GPI-membrane-anchored protein uses the secretory pathway to reach its final destination, i.e., the plasma membrane. Interestingly, three sites homologous to the 5′-CUGCAG-3′ IRE1α consensus cleavage site previously defined by Oikawa and colleagues (Oikawa et al. 2010) are present in GPC3 mRNA, including one in the 3′ UTR (Fig. 2B). Moreover, overexpression of IRE1α in HuH7 cells significantly decreased eGFP-GPC3 3′ UTR-mRNA stability (Fig. 2C), and this recombinant mRNA was found associated to the ER cytosolic surface (Supplemental Fig. S2), as previously observed for other cytosolic protein-encoding mRNAs (Lerner et al. 2003; Pyhtila et al. 2008). These observations led us to hypothesize that miR-1291 might target IRE1α expression, thereby attenuating its IRE1α endoribonuclease activity toward GPC3 mRNA.
FIGURE 2.
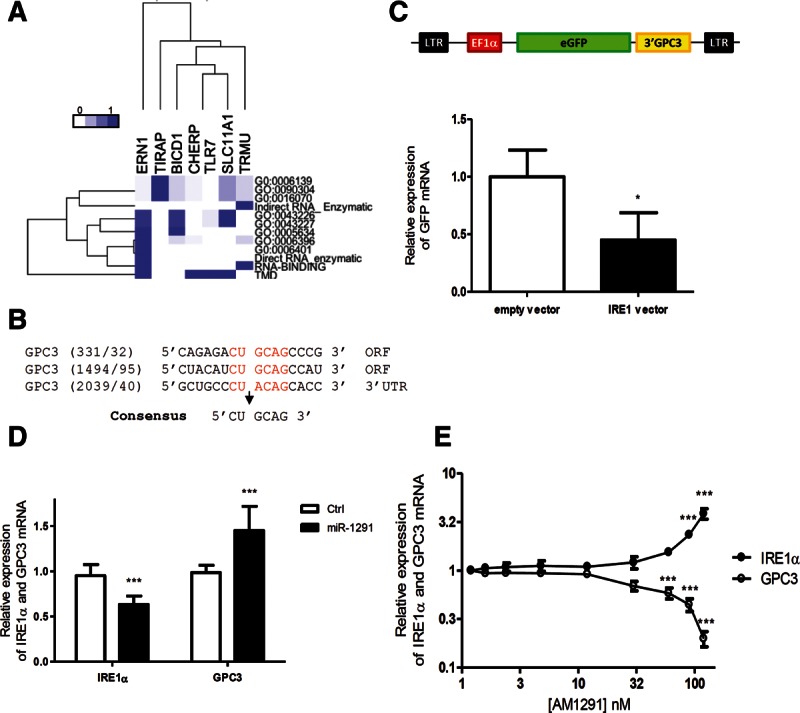
miR-1291 targets an intermediate factor that regulates GPC3 mRNA expression. (A) Selection of miR-1291-predicted targets involved in mRNA destabilization. Using miRWalk, 2782 gene candidates were predicted as miR-1291 targets (P < 0.01). Among them, 83 are described as post-transcriptional regulators. A hierarchical clustering was performed for seven candidate genes that were identified as relevant to a membranous compartment, namely ERN1, TIRAP, BICD1, CHERP, TLR7, SLC11A1, and TRMU. Scale bar is indicated. (B) Identification of three sites homologous to the 5′-CUGCAG-3′ IRE1α consensus cleavage site in GPC3 mRNA (red). (C) IRE1α inhibits eGFP-GPC3 3′ UTR mRNA stability. EGFP-GPC3 3′ UTR-expressing HuH7 cells were transfected with an empty vector or IRE1α vector. Three days later, the expression of eGFP mRNA was measured (ANOVA: P < 0.0001; n = 3). (*) P < 0.1. (D) Whereas miR-1291 increases GPC3 expression, it decreases that of IRE1α. HuH7 cells were transfected with a control miRNA and miR-1291. The relative expression of IRE1α and GPC3 mRNA was measured using RT-qPCR (ANOVA: P < 0.0001; n = 10). (***) P < 0.001. (E) HuH7 cells were transfected with increasing concentrations of anti-miR-1291 (AM1291). The relative expression of IRE1α and GPC3 mRNA was measured using RT-qPCR (ANOVA: P < 0.0001; n = 3). (***) P < 0.001.
Based on the above data, we tested the impact of miR-1291 on IRE1α and GPC3 mRNA expression in HuH7 cells. Overexpression of miR-1291 led to down-regulation of IRE1α mRNA expression by ∼40% (Fig. 2D). The amplitude of this effect was consistent with that observed for most other functional miRNAs (Avraham and Yarden 2012) and was accompanied by the simultaneous increase in GPC3 mRNA (Fig. 2D). Transfection of HuH7 cells with increasing amounts of a miR-1291 inhibitor (AM1291) led to an increase in endogenous IRE1α mRNA expression and to a decrease of endogenous GPC3 mRNA expression at concentrations above 90 nM (Fig. 2E). At lower concentrations (i.e., 12 to 30 nM) (Fig. 2E; Supplemental Fig. S3A), AM1291 efficiently depleted miR-1291 in HuH7 cells (Supplemental Fig. S3A). However, because the expression of miR-1291 in HuH7 cells is about 500 times higher than that of its IRE1α mRNA target (Supplemental Fig. S3B), these concentrations were most likely too low to impact the regulatory effects of miR-1291 on the expression of IRE1α and GPC3 mRNAs. Collectively, these results indicate that miR-1291 regulates IRE1α expression and support the first part of our hypothesis.
IRE1α is a direct target of miR-1291
miRWalk (Dweep et al. 2011) predicted that IRE1α mRNA contains a site pairing with miR-1291 in its 5′ UTR, a miRNA:mRNA interaction that was further supported using RNAhybrid (Fig. 3A; Rehmsmeier et al. 2004). Using eGFP-expressing HuH7 cells bearing the IRE1α 5′ UTR (Fig. 3B), we found that miR-1291 decreased eGFP expression by ∼50%, whereas AM1291 induced it (Fig. 3C). Moreover, deletion of the sequence complementary to the miR-1291 seed within the IRE1α 5′ UTR abolished the observed miR-1291-mediated regulation (Fig. 3C). Using FunREG, we further demonstrated that miR-1291 post-transcriptionally controlled IRE1α expression by destabilizing its mRNA with no effect on translation (Fig. 3D). These data confirmed that miR-1291 regulates IRE1α expression by targeting its 5′ UTR and induces IRE1α mRNA degradation through a classical miRNA-seed recognition process.
FIGURE 3.

miR-1291 targets and destabilizes IRE1α mRNA through its 5′ UTR. (A) IRE1α 5′ UTR contains a potential miR-1291 binding site. Schematic representation of miR-1291/IRE1α 5′ UTR interaction using RNAhybrid. (B) Top panel: Schematic representation of IRE1α 5′ UTR-eGFP transgene. Bottom panel: Schematic representation of miR-1291 pairing with IRE1α 5′ UTR in its wild-type or mutated form. (C) HuH7 cells expressing the indicated transgenes were transfected with the indicated small RNAs. Three days later, eGFP protein expression was measured (ANOVA: P < 0.0001; n = 3). (***) P < 0.001. (D) HuH7 cells expressing the WT-IRE1α 5′ UTR-eGFP transgene were transfected with a control RNA or miR-1291. After 3 d, FunREG ratios were calculated as described in Figure 1 (ANOVA: P < 0.0001; n = 4). (***) P < 0.001. (E) Overexpression of IRE1α lacking its mRNA 5′ UTR counteracts the miR-1291-mediated increase in GPC3 mRNA. HuH7 cells were transfected with the indicated plasmid and small RNA. Then, GPC3 mRNA expression was measured using RT-qPCR (ANOVA: P < 0.0001; n = 5). (*) P < 0.05, (**) P < 0.01, (***) P < 0.001.
Our initial hypothesis raised the possibility that miR-1291 positively controls GPC3 by repressing the expression of a negative regulator of GPC3 mRNA stability. Our results pointed toward IRE1α as being this protein. In this context, it would be predicted that the expression of a miR-1291-resistant form of IRE1α mRNA (i.e., devoid of its 5′ UTR) would prevent miR-1291-mediated GPC3 mRNA up-regulation. As anticipated, overexpression of an IRE1α transgene lacking its 5′ UTR in HuH7 cells (Supplemental Fig. S4A) inhibited miR-1291-mediated up-regulation of GPC3 mRNA expression and led to a decrease in GPC3 mRNA expression, thereby confirming the functional relationship among those three genes (Fig. 3E).
IRE1α regulates GPC3 mRNA expression and stability
To further investigate the relationship between IRE1α and GPC3, IRE1α expression was silenced in HuH7 cells, and the cells were then exposed or not exposed to ER stress. Both dithiothreitol (DTT), which reduces disulfide bonds, and tunicamycin (Tun), an N-linked glycosylation inhibitor, were used to induce ER stress and to activate IRE1α (Schroder and Kaufman 2005). Both drugs induced XBP1 mRNA splicing, and these effects were attenuated in IRE1α-silenced cells, thus confirming the activation of the IRE1α/XBP1 signaling axis upon ER stress in our experimental system (Fig. 4A). Under the same experimental conditions, miR-1291 expression remained stable (Supplemental Fig. S5). Interestingly, GPC3 expression increased at both mRNA (Fig. 4B) and protein (Fig. 4C) levels upon attenuation of IRE1α expression, and this occurred independently of ER stress. HuH7 cells were then transfected with miR-1291 to evaluate the effects of miR-1291 toward the IRE1α arm of the UPR. At first, the impact of miR-1291 was evaluated on the expression of HERPUD, GRP94, and CHOP mRNAs, genes whose transcription is, respectively, increased downstream from the ATF6 and PERK arms of the UPR upon ER stress (Schroder and Kaufman 2005). In parallel, we monitored IRE1α-mediated XBP1 mRNA splicing and the RIDD activity under the same conditions. As shown in Figure 5, miR-1291 had no influence on the signaling of the ATF6 (Fig. 5A) and PERK (Fig. 5B) arms of the UPR. Indeed, HERPUD, GRP94, and CHOP mRNA expression was not affected by a variation of miR-1291 expression under basal or ER stress conditions. In contrast, miR-1291 specifically affected IRE1α endoribonuclease activity as shown by the attenuation of XBP1 mRNA splicing upon ER stress and by the inhibition of the RIDD activity as assessed with the expression of the well-characterized RIDD substrates PDGFRB, COL6A1, and SCARA3 mRNAs (Fig. 5C). Using actinomycin D to inhibit transcription, we further demonstrated that IRE1α silencing led to GPC3 mRNA stabilization (Fig. 6A). To test whether GPC3 mRNA is a genuine stress-independent target of IRE1α, we measured the amount of GPC3 mRNA in control or stressed cells in the presence or absence of actinomycin D. GPC3 mRNA expression was similar in control and stressed cells in the presence of actinomycin D, thereby suggesting an absence of a transcriptional compensatory mechanism that could increase GPC3 mRNA levels upon ER stress (Fig. 6B). Therefore, in our conditions, GPC3 mRNA appears not to be a target of stress-activated IRE1α. Interestingly, the analysis of SCARA3 mRNA revealed that, although the cleavage of this RIDD substrate was enhanced upon ER stress, it was also observed under basal conditions (Fig. 5C). For the other RIDD substrates tested, PDGFRB and COL6A1 mRNAs were selectively cleaved upon ER stress (Fig. 5C). These data demonstrate that IRE1α controls GPC3 mRNA stability independently of ER stress and that miR-1291 selectively targets the IRE1α arm of the UPR.
FIGURE 4.

IRE1α-silencing increases GPC3 mRNA independently of ER stress. (A) IRE1α mediates XBP1 mRNA splicing upon ER stress. ER stress-induced splicing of XBP1 mRNA yields a transcript with a 26-nt deletion in comparison to the unspliced transcript. HuH7 cells transfected with the indicated siRNAs were exposed to dithiothreitol (DTT) for 6 h or to tunicamycin (Tun) for 24 h. Then, XBP1 mRNA splicing was monitored by RT-PCR. (B,C) IRE1α-silencing increases GPC3 expression. HuH7 cells were transfected with the indicated small RNA and then treated or not treated with DTT or Tun. Three days later, mRNA and protein expression (ANOVA: P < 0.0001; n = 8) was measured by qPCR (B) and Western blotting (C). GPC3 and nonglycosylated GPC3 (ngGPC3) proteins were as shown. (***) P < 0.001.
FIGURE 5.

miR-1291 specifically alters IRE1α signaling independently of ER stress. (A,B) Overexpression of miR-1291 did not affect ATF6 and PERK signaling upon Tun treatment. HuH7 cells transfected with the indicated small RNA were exposed to Tun (24 h). (A) The relative expression of HERPUD and GRP94 mRNAs was measured using RT-qPCR (ANOVA: P < 0.0001; n = 5). (*) P < 0.05. (B) CHOP mRNA expression was measured (ANOVA: P < 0.0001; n = 5). (***) P < 0.001. (C) miR-1291 selectively affects IRE1α signaling. Top panel: HuH7 cells transfected with the indicated small RNA were exposed to DTT (6 h). Then, XBP1 mRNA splicing was monitored. The results are representative of five independent experiments. Bottom panel: HuH7 cells transfected with the indicated small RNA were exposed to Tun (24 h). Then, the relative expression of PDGFR, COL1, and SCARA3 mRNAs was measured (ANOVA: P < 0.0001; n = 5). (**) P < 0.01, (***) P < 0.001.
FIGURE 6.

IRE1α-silencing leads to GPC3 mRNA stabilization. (A) HuH7 cells were transfected with the indicated small RNA. Three days later, GPC3 and ALB mRNA were measured at different times following transcription inhibition using actinomycin D (ANOVA: P < 0.0001; n = 3). (*) P < 0.05, (**) P < 0.01. (B) HuH7 cells were exposed or not exposed to Tun (24 h). Then, GPC3 expression was measured following transcription inhibition using actinomycin D or not (ANOVA: P < 0.0001; n = 5).
IRE1α cleaves GPC3 through a canonical site located in its 3′ UTR
As mentioned above, GPC3 mRNA sequence contains three sites homologous to the 5′-CUGCAG-3′ IRE1α consensus cleavage site and similar to those found in XBP1 mRNA (Oikawa et al. 2010). In addition, these three sites form P-loop structures, thereby yielding potential cleavage sites for IRE1α (Fig. 7A; Oikawa et al. 2010). To test whether IRE1α cleaves GPC3 mRNA and to identify these sites, total RNA from HuH7 cells was subjected to an in vitro IRE1α-mediated cleavage assay (Bouchecareilh et al. 2010). RT-PCR was then carried out using primers flanking the three predicted consensus sites. Interestingly, only one site among the three predicted appeared sensitive to IRE1α endoribonuclease activity in vitro (Fig. 7B). Indeed, the amount of RT-PCR product corresponding to the site located at nucleotides 2039/40 in the GPC3 mRNA 3′ UTR decreased by ∼60%, whereas the amount of the four other GPC3 fragments, as well as the control GAPDH mRNA, did not change. This suggests that GPC3 mRNA contains only one functional in vitro IRE1α-mediated cleavage site located in its 3′ UTR. To further demonstrate the relevance of this cleavage site, in vitro transcribed GPC3 mRNA and its mutant counterpart deleted for the 2039/40 site were subjected to IRE1α-mediated cleavage. In a model where IRE1α would cleave GPC3 mRNA at the 2039/40 site (Fig. 7C), two RNA cleavage products of 1700 nt and 300 nt, respectively, would be produced. As anticipated, cleavage of wild-type GPC3 mRNA generated two RNA fragments of the expected size (Fig. 7D, left). In contrast, deletion of the 2039/40 site in GPC3 mRNA abrogated IRE1α-mediated cleavage (Fig. 7D, right). These results demonstrated that, in vitro, IRE1α cleaves GPC3 in its 3′ UTR at position 2039/40.
FIGURE 7.

IRE1α cleaves GPC3 mRNA in vitro at a canonical site located in its 3′ UTR. (A) Three potential IRE1α-mediated cleavage sites were identified in GPC3 mRNA. Top: Sequence alignment of IRE1α cleavage sites in XBP1 and GPC3 mRNAs. Bottom: Two-dimensional M-fold RNA modeling of potential IRE1α cleavage sites in GPC3 mRNA. (B) IRE1α cleaves GPC3 mRNA within its 3′ UTR in vitro. Total RNA extracted from HuH7 cells was incubated with heat-inactivated or not GST-IRE1αcyto. IRE1α-mediated cleavage of GPC3 mRNA was monitored by PCR at the indicated site. (C,D) IRE1α directly targets the 2039/40 cleavage site in the GPC3 3′ UTR. (C) Expected GPC3 mRNA products following IRE1α-mediated cleavage at the 2039/40 site. (D) In vitro-transcribed wild-type and IRE1α-site-deleted GPC3 RNAs were incubated or not with heat-inactivated or not GST-IRE1αcyto in the presence or absence of RNase H. Resulting reaction products were resolved on denaturing agarose gels.
To test the physiological relevance of this observation, we evaluated the capacity of IRE1α to cleave GPC3 mRNA in cultured cells. Using targeted RT-qPCR (Iqbal et al. 2008), the amount of each GPC3 mRNA fragment was measured in HuH7 cells upon siRNA-mediated silencing of 5′–3′ exonucleases XRN1/2 or RNA helicase SKI2, the latter mediating the 3′–5′ degradation of mRNA through the cytoplasmic exosome (Fig. 8A). Compared to the control and as expected, SKI2 silencing led to the accumulation of the GPC3 mRNA fragment upstream of IRE1α cleavage (Fragment 1) with no effect on the amount of the downstream fragment (Fragment 2) (Fig. 8B). In contrast, the silencing of XRN1 or XRN2 led to an increase in Fragment 2, with no effect on the amount of Fragment 1 (Fig. 8B). Therefore, the in vitro cleavage site present in GPC3 mRNA also exists in cells. This result was further reinforced as IRE1α silencing led to an increase of all fragments in all conditions, due to the absence of GPC3 mRNA cleavage (Fig. 8B). To further assess whether miR-1291 up-regulates GPC3 mRNA through the repression of IRE1α expression and the subsequent decrease in RNase activity, HuH7 cells were transfected with miR-1291 in the presence or absence of siSKI2. IRE1α mRNA, GPC3 mRNA Fragment 1, and the amplicon framing the IRE1α cleavage site were then quantified (Fig. 8C,D; Supplemental Fig. S4B). As expected, miR-1291 down-regulated IRE1α mRNA expression (Supplemental Fig. S4B) and subsequently up-regulated GPC3 mRNA (Fig. 8C,D). SKI2 silencing further increased the amount of Fragment 1 (Fig. 8C) but had no impact on IRE1α mRNA expression (Supplemental Fig. S4B). Quantification of the amplicon framing the cleavage site revealed that cleavage was reduced upon transfection with miR-1291 both in the presence or absence of SKI2 and that SKI2 silencing alone did not impact on GPC3 mRNA cleavage (Fig. 8D). Hence, our results demonstrated that miR-1291 targets IRE1α through its 5′ UTR, thereby attenuating IRE1α-mediated decay of GPC3 mRNA and consequently leading to increased GPC3 expression in hepatoma cells.
FIGURE 8.

IRE1α cleaves GPC3 mRNA in cultured cells. (A) Schematic representation of the expected GPC3 mRNA products following IRE1α-mediated cleavage and their subsequent regulation by the exonucleases XRN1 and XRN2, or the RNA helicase SKI2. (B) HuH7 cells were transfected with the indicated small RNAs. Three days later, the presence of the GPC3 mRNA Fragment 1 and 2 was monitored using RT-qPCR (ANOVA: P < 0.0001; n = 6). (*) P < 0.05, (**) P < 0.01, (***) P < 0.001. (C,D) HuH7 cells were transfected with the indicated small RNAs. Three days later, GPC3 fragment 1 (C) and the GPC3 amplicon framing the IRE1α cleavage site (D) were monitored using RT-qPCR (ANOVA: P < 0.0001; n = 3). (*) P < 0.05, (**) P < 0.01.
DISCUSSION
In this work, we characterized the molecular mechanism by which miR-1291 post-transcriptionally controls the GPC3 mRNA expression increase (Fig. 9). Using an integrated approach combining both in silico analyses and in vitro/cell-based validation, we report that miR-1291 binds to the IRE1α 5′ UTR, thus destabilizing its mRNA and leading to its degradation. We also demonstrate the presence of a functional IRE1α cleavage site in the GPC3 mRNA 3′ UTR, thereby indicating that GPC3 mRNA is a genuine RIDD substrate. Collectively, our data show that miR-1291 up-regulates GPC3 mRNA expression by down-regulating IRE1α mRNA expression. Therefore, our results point toward a novel miRNA-dependent gene expression control mechanism through IRE1α silencing and RIDD attenuation.
FIGURE 9.

miR-1291 up-regulates GPC3 through inhibition of IRE1α expression. Schematic representation of miR-1291-mediated GPC3 up-regulation through inhibition of IRE1α expression. The gray frame indicates the original observation that miR-1291 up-regulates GPC3 mRNA expression through its 3′ UTR (Maurel et al. 2013). The green dashed arrow indicates a positive and indirect regulation of GPC3 mRNA expression. Red signs indicate negative and direct regulations.
miRNAs generally act as negative regulators of gene expression (Bartel 2009). However, some were also shown to act positively (Vasudevan 2012). Using a functional miRNA screening, we recently identified three miRNAs enhancing GPC3 expression through a 3′ UTR-dependent mechanism including miR-1291 (Maurel et al. 2013). Little is known about the functional properties of miR-1291 in cells. miRNA loci are located in different regions of the genome. Half are intragenic and encoded by protein-coding genes or noncoding RNA genes. This is the case with miR-1291, which is localized in the SNORA34 gene (Scott et al. 2009; Brameier et al. 2011). miR-1291 expression is down-regulated in renal cell carcinoma (Hidaka et al. 2012) and in the peripheral blood of acute myocardial infarction patients (Meder et al. 2011). However, no functional or pathophysiological roles have been associated with these observations. As there is no predicted miR-1291 binding site on GPC3 mRNA, we hypothesized that miR-1291 could enhance GPC3 expression by an indirect mechanism involving an intermediate regulatory factor recognizing GPC3 mRNA 3′ UTR. Such a mechanism has, for instance, been illustrated with the targeting of genes involved in NMD (Bruno et al. 2011) or in the CCR4-NOT complex (Behm-Ansmant et al. 2006).
As one miRNA can target hundreds of different mRNAs, it is likely that many negative regulatory intermediates might be the target of miR-1291 to control GPC3 expression. To restrict the number of candidates obtained in silico to an experimentally testable set, we focused on regulatory factors involved in RNA catabolism and likely acting on a sequence-specific site recognition basis. In silico data pointed toward IRE1α as a potential candidate, as this gene fulfilled the above-mentioned criteria (Fig. 2A; Supplemental Fig. S1). The experimental validation revealed that IRE1α was a direct target of miR-1291 (Fig. 3). Remarkably, miR-1291 specifically paired with a site located in the IRE1α 5′ UTR (Fig. 3). miRNA:5′ UTR target interactions are currently poorly described, likely due to the fact that most of the current bioinformatics tools generate predictions on 3′ UTR sequence and not on the full mRNA sequence, which, therefore, may introduce a prediction bias. In contrast to most available tools, miRWalk produces information on miRNA-targets interactions gathered on the complete mRNA sequence as well as on the gene promoter (Dweep et al. 2011). Finally, the identification of human miR-1291 orthologs in other mammalian species using miRBase (Griffiths-Jones et al. 2008; Kozomara and Griffiths-Jones 2011), together with the conservation of their binding sites in IRE1α 5′ UTRs and the conserved IRE1α target site in the 3′ UTR of GPC3 mRNA in several species, suggests the existence of a general regulatory mechanism in mammals (Supplemental Fig. S6).
In the past two years, several studies have identified miRNAs whose expression is regulated upon ER stress. Each one of the UPR sensors relays information on the protein folding status from the ER lumen to the nucleus, thereby controlling gene expression. The PERK branch was described to control the expression of miR-708 (Behrman et al. 2011), miR-106b-25 (Gupta et al. 2012), miR-30c-2* (Byrd et al. 2012), and miR-211 (Chitnis et al. 2012). In the same way, ATF6 signaling down-regulates the expression of miR-455 (Belmont et al. 2012), and IRE1α signaling increases that of miR-346 (Bartoszewski et al. 2011). Recently, miR-122, the most abundant miRNA in the liver, whose expression is repressed in HCC, was found to inhibit CDK4, which interacts and induces accumulation of PSMD10, a proteasome component and an enhancer of the UPR (Yang et al. 2011). Herein, we describe for the first time a miRNA acting as an upstream inhibitor of the UPR pathway by directly targeting IRE1α expression. Intriguingly, this regulation did not depend on ER stress. As the same IRE1α-dependent cleavage under unstressed conditions was also observed for SCARA3 mRNA (this study) and SPARC mRNA (Dejeans et al. 2012), one might suggest potential roles for UPR signaling components in nonstressed conditions as also recently described for IRE1 and PERK (Tam et al. 2012).
Fine-tuning of the UPR plays a fundamental role in cancer cell fate decisions by determining adaptation and survival to ER stress and eliminating irreversibly damaged cells (Moenner et al. 2007; Tabas and Ron 2011; Woehlbier and Hetz 2011). In this context, IRE1α has evolved a dual function to preserve ER homeostasis (Han et al. 2009). First, the IRE1α/XBP1 axis is thought to favor tumor cell adaptation to stress by increasing the ability of these cells to synthesize and fold large amounts of transmembrane and secreted proteins. Second, prolonged activation of the RIDD pathway might decrease tumor growth in a cell-specific manner by degrading mRNAs encoding pro-oncogenic proteins, including PDGFR and SPARC (Hollien and Weissman 2006; Dejeans et al. 2012). In the present study, we identify GPC3 mRNA as a novel RIDD substrate and demonstrate its cleavage by IRE1α endoribonuclease at a consensus site located in GPC3 mRNA 3′ UTR (Figs. 7, 8). GPC3 is known to promote HCC cell growth by stimulating the WNT/β-catenin pathway (Capurro et al. 2005). Consequently, our results suggest that miR-1291 could act as an oncomiR by attenuating IRE1α expression and RIDD, thereby leading to GPC3 overexpression in liver tumors. This hypothesis should, however, be considered carefully as, in the meantime, miR-1291-mediated attenuation of IRE1α expression would also reduce XBP1 mRNA splicing. The integrated signaling outcomes resulting from this initial event would, therefore, determine the oncogenic potential of miR-1291. Finally, although it is currently believed that IRE1α activation plays an instrumental role in tumor progression (Auf et al. 2010; Dejeans et al. 2012), somatic driver mutations in the IRE1α gene were identified in cancers (Greenman et al. 2007) and recently associated with a loss-of-signaling function of this molecule (Xue et al. 2011), thereby also associating IRE1α inactivation with cell transformation. This might be consistent with the hypothesis of a pro-oncogenic miR-1291-mediated attenuation of IRE1α signaling.
In conclusion, we report a novel mechanism of miRNA-mediated positive regulation of gene expression originating from the silencing of the endoribonuclease IRE1α (Fig. 9). The physiological and pathophysiological consequences of such a mechanism still remain to be fully investigated, especially in liver cancers in which GPC3 overexpression plays a master regulatory role. However, one can easily anticipate a significant contribution of IRE1α down-regulation to cancer development through the overexpression of cancer-associated downstream gene targets.
MATERIALS AND METHODS
Plasmids and cloning
The pL-eGFP-GPC3 3′ UTR lentiviral and pED-IRE1α plasmids were as described previously (Nguyen et al. 2004; Maurel et al. 2013). The pEF-hGPC3 plasmid was kindly provided by S. Mizushima and S. Nagata (Osaka Bioscience Institute, Japan) (Mizushima and Nagata 1990). The pcDNA3.1-ΔCUACAG-hGPC3 was obtained as follows: A mutant GPC3 gene devoid of the IRE1α cleavage site was synthesized (Eurofins MWG Operon), digested by NotI, and cloned into the pcDNA3.1 vector (Invitrogen). The pL-wt-IRE1α 5′-UTR-eGFP and pL-mut-IRE1α-5′-UTR-eGFP plasmids were constructed as follows: IRE1α 5′ UTR was amplified using 5′-CACGGATCCTGCCTAGTCAGTTCTGCGTC as the forward primer and either 5′-CACGGATCCGGCGAGGACTCGGCCCT or 5′-CACGGATCCGGCGAGGACTCCGGCGTGGCTCCGGGGG as the reverse primer, respectively. Each PCR product was digested by BamHI and sub-cloned into the pL-eGFP plasmid (Maurel et al. 2013). Sequence was verified by DNA sequencing.
Cell culture
HuH7 cells were grown in DMEM (Invitrogen) containing 10% fetal bovine serum (FBS) and penicillin/streptomycin (1000 units/mL). Enhanced green fluorescent protein (eGFP)-expressing HuH7 cells were established using lentiviral transduction (multiplicity of infection = 3) as previously described (Laloo et al. 2009; Jalvy-Delvaille et al. 2012). Tunicamycin (Tun; 10 µg/mL) was from Calbiochem (EMD Biosciences Inc.). Dithiothreitol (DTT; 2 mM) and actinomycin D (5 µg/mL) were obtained from Sigma.
Small RNA transfection
Small inhibitory RNAs (siRNAs) (Supplemental Table S1) were designed using Greg Hannon’s web tool (http://hannonlab.cshl.edu/). The negative control RNA, mature miRNA mimics, and hairpin miRNA inhibitors were from Qiagen. Unless otherwise stated, small RNAs were transfected into the target cells at 12 nM by reverse-transfection using Lipofectamine RNAi Max (Invitrogen) following the manufacturer’s instructions.
RNA isolation, reverse transcription, and qPCR analyses
Total RNA was prepared using the TRI Reagent (Sigma) following the manufacturer’s instructions. Mature miRNA expression was quantified using the TaqMan microRNA Reverse Transcription Kit and TaqMan microRNA assays (Applied Biosystems). Messenger RNA expression was quantified using the SYBR Green Supermix (Quanta Biosciences). Quantitative PCR reactions were performed using the Step One Plus Quantitative PCR System (Applied Biosystems). For each data point, experiments were performed in triplicate. In all cases, each sample was normalized toward the expression of the 18S ribosomal RNA. Absolute quantification was performed using a standard curve-based approach. A standard curve was obtained using serial dilutions of plasmid or miRNA of known concentrations on a 10-fold basis. The copy number was calculated as follows: X g/mol/Avogadro’s number = X g/molecule. Standard curves were obtained by plotting the crossing threshold (Ct) against the log number of molecules. The equation drawn from the graph was used to calculate the precise number of target molecules tested in the same reaction plate as the standard as well as in the sample. PCR products were resolved on 1% agarose TBE 0.5× electrophoresis gels or 4% for the XBP1 splicing experiments. Primers used are as described in Supplemental Table S2. For ER-associated RNA enrichment, an immunoisolation approach was undertaken as previously described (Nguyen et al. 2004). Briefly, HuH7 cells were homogenized using a Teflon potter in the presence of RNAsin, and homogenates were clarified by centrifugation at 1500g for 10 min. Clarified homogenates were incubated in the presence of anti-calnexin antibodies for 2 h, and then magnetic beads were added for an additional 20 min at 4°C. Beads were collected using a magnet and washed extensively. Purified ER membranes were then treated with Trizol, RNA extracted, and reverse-transcribed.
Antibodies and Western blot analyses
Antibody against GPC3 was from Biomosaics (Burlington). Anti-IRE1α and anti-GAPDH were from Santa-Cruz Biotechnology. Protein extraction and Western blotting were performed as previously described (Jalvy-Delvaille et al. 2012). Signals were normalized to the amount of the housekeeping protein GAPDH.
FunREG analyses
FunREG analyses were performed 3 d after cell transfection as previously described (Laloo et al. 2009; Maurel et al. 2013). Cells were washed with PBS, detached with trypsin/EDTA, collected, and analyzed by FACS using the BD LSRFortessa cell analyzer and the BD FACSDiva software (BD Biosciences). In parallel, genomic DNA and total RNA were extracted by TRI Reagent (see above) from each cell population. Quantitative RT-PCR was performed as described above. The transgene copy number was measured by quantitative PCR using genomic DNA as described previously (Laloo et al. 2009; Jalvy-Delvaille et al. 2012).
Bioinformatic analyses
In silico analyses were performed using miRWalk (Dweep et al. 2011). This program identifies the longest consecutive complementarity between miRNA and gene sequences, produces information about miRNA:target interactions on the complete gene sequence (promoter, 5′ UTR, coding sequence, and 3′ UTR) of all known genes and compares the candidate miRNA binding sites with those established by eight miRNA-target prediction programs (i.e., DIANA-microT, miRanda, miRDB, PicTar, PITA, RNA22, RNAhybrid, and TargetScan/TargetScanS). Finally, miRWalk incorporates all the predicted miRNA binding sites produced by the miRWalk algorithm and the eight other programs into a relational database. The secondary structure of the GPC3 mRNA:miR-1291 interaction was predicted using M-FOLD (Zuker et al. 1999). Functional classification was achieved by g:profiler (Reimand et al. 2007). Generated data were also manually sorted and integrated to generate quantitative and qualitative information on the Gene Ontology (cellular compartment and biological process components). Moreover, an additional piece of information concerning candidate miR-1291 targets was retrieved from databases (GeneCard, NCBI, miRBase, miRDB, HNGC) and from the literature to constitute a binary (No = 0; Yes = 1) annotation file. A scoring system was established based on the methodology previously described for integration of heterogeneous data for gene function prediction (Troyanskaya et al. 2003). All these data were then clustered and represented using the CLUSTER and TREEVIEW programs (Hoon et al. 2004; Saldanha 2004). All the clusters were built using Euclidian distances. Trees were generated using average linkage.
RNA cleavage assay
Ten µg of total RNA extracted from HuH7 were incubated at 37°C with the cytoplasmic domain of human IRE1α (5 µg) fused to GST (GST-IRE1αcyto) for 4 h in a buffer containing 25 mM Tris-HCl (pH 7.5), 0.5 mM MgCl2, and 1 mM ATP, as previously described (Bouchecareilh et al. 2010, 2011). Heat-denatured GST-IRE1αcyto was used as a control. RNA fragments were detected by RT-PCR using specific primers (Supplemental Table S2). The pcDNA3.1-ΔCUACAG-hGPC3 and pEF-hGPC3 plasmids were used as templates for in vitro RNA transcription using the T7 polymerase (Promega). In vitro transcribed RNA was incubated at 37°C with 5 µg of GST-IRE1αcyto and 1 mM ATP for 4 h. Reaction products were then denatured for 10 min at 65°C in an RNA sample buffer (56% formamide, 37% formaldehyde, 7% MOPS). Fragments resulting from the enzymatic reaction were resolved on 1% formaldehyde agarose gels and visualized by UV transillumination.
Statistical analyses
Statistical analyses were performed using GraphPad Prism 5.0 software. Data are presented as the mean of the indicated number of independent experiments ± standard deviation (SD). When the experiment contained three groups of values or more, regular one-way analysis of variance (ANOVA) was used for the comparison of multiple means. Means were considered significantly different when P < 0.05. The ANOVA test was followed by a Bonferroni’s multiple-comparison post-test, and selected pairs of data were compared. Significant variations are indicated with asterisks.
SUPPLEMENTAL MATERIAL
Supplemental material is available for this article.
Supplementary Material
ACKNOWLEDGMENTS
This work was funded in part by grants from L’Institut National du Cancer (INCa; project INCa_5828) and La Ligue Nationale contre le Cancer (LNCC) to C.F.G. and INSERM, INCa (INCa_5869; INCa_2012_117), LNCC to E.C. E.C. was supported by an Interface contract INSERM-CHU de Bordeaux. M.M. was a recipient of a Ph.D. scholarship from the French Research Ministry. N.D. was funded by post-doctoral fellowships from LNCC and Fondation de France.
REFERENCES
- Auf G, Jabouille A, Guerit S, Pineau R, Delugin M, Bouchecareilh M, Magnin N, Favereaux A, Maitre M, Gaiser T, et al. 2010. Inositol-requiring enzyme 1α is a key regulator of angiogenesis and invasion in malignant glioma. Proc Natl Acad Sci 107: 15553–15558 [DOI] [PMC free article] [PubMed] [Google Scholar]
- Avraham R, Yarden Y 2012. Regulation of signalling by microRNAs. Biochem Soc Trans 40: 26–30 [DOI] [PMC free article] [PubMed] [Google Scholar]
- Bartel DP 2009. MicroRNAs: Target recognition and regulatory functions. Cell 136: 215–233 [DOI] [PMC free article] [PubMed] [Google Scholar]
- Bartoszewski R, Brewer JW, Rab A, Crossman DK, Bartoszewska S, Kapoor N, Fuller C, Collawn JF, Bebok Z 2011. The unfolded protein response (UPR)-activated transcription factor X-box-binding protein 1 (XBP1) induces microRNA-346 expression that targets the human antigen peptide transporter 1 (TAP1) mRNA and governs immune regulatory genes. J Biol Chem 286: 41862–41870 [DOI] [PMC free article] [PubMed] [Google Scholar]
- Behm-Ansmant I, Rehwinkel J, Doerks T, Stark A, Bork P, Izaurralde E 2006. mRNA degradation by miRNAs and GW182 requires both CCR4:NOT deadenylase and DCP1:DCP2 decapping complexes. Genes Dev 20: 1885–1898 [DOI] [PMC free article] [PubMed] [Google Scholar]
- Behrman S, Acosta-Alvear D, Walter P 2011. A CHOP-regulated microRNA controls rhodopsin expression. J Cell Biol 192: 919–927 [DOI] [PMC free article] [PubMed] [Google Scholar]
- Belmont PJ, Chen WJ, Thuerauf DJ, Glembotski CC 2012. Regulation of microRNA expression in the heart by the ATF6 branch of the ER stress response. J Mol Cell Cardiol 52: 1176–1182 [DOI] [PMC free article] [PubMed] [Google Scholar]
- Bouchecareilh M, Caruso ME, Roby P, Parent S, Rouleau N, Taouji S, Pluquet O, Bosse R, Moenner M, Chevet E 2010. AlphaScreen-based characterization of the bifunctional kinase/RNase IRE1α: A novel and atypical drug target. J Biomol Screen 15: 406–417 [DOI] [PubMed] [Google Scholar]
- Bouchecareilh M, Higa A, Fribourg S, Moenner M, Chevet E 2011. Peptides derived from the bifunctional kinase/RNase enzyme IRE1α modulate IRE1α activity and protect cells from endoplasmic reticulum stress. FASEB J 25: 3115–3129 [DOI] [PubMed] [Google Scholar]
- Brameier M, Herwig A, Reinhardt R, Walter L, Gruber J 2011. Human box C/D snoRNAs with miRNA like functions: Expanding the range of regulatory RNAs. Nucleic Acids Res 39: 675–686 [DOI] [PMC free article] [PubMed] [Google Scholar]
- Bruno IG, Karam R, Huang L, Bhardwaj A, Lou CH, Shum EY, Song HW, Corbett MA, Gifford WD, Gecz J, et al. 2011. Identification of a microRNA that activates gene expression by repressing nonsense-mediated RNA decay. Mol Cell 42: 500–510 [DOI] [PMC free article] [PubMed] [Google Scholar]
- Byrd AE, Aragon IV, Brewer JW 2012. MicroRNA-30c-2* limits expression of proadaptive factor XBP1 in the unfolded protein response. J Cell Biol 196: 689–698 [DOI] [PMC free article] [PubMed] [Google Scholar]
- Calfon M, Zeng H, Urano F, Till JH, Hubbard SR, Harding HP, Clark SG, Ron D 2002. IRE1 couples endoplasmic reticulum load to secretory capacity by processing the XBP-1 mRNA. Nature 415: 92–96 [DOI] [PubMed] [Google Scholar]
- Capurro MI, Xiang YY, Lobe C, Filmus J 2005. Glypican-3 promotes the growth of hepatocellular carcinoma by stimulating canonical Wnt signaling. Cancer Res 65: 6245–6254 [DOI] [PubMed] [Google Scholar]
- Chitnis NS, Pytel D, Bobrovnikova-Marjon E, Pant D, Zheng H, Maas NL, Frederick B, Kushner JA, Chodosh LA, Koumenis C, et al. 2012. miR-211 is a prosurvival microRNA that regulates chop expression in a PERK-dependent manner. Mol Cell 48: 353–364 [DOI] [PMC free article] [PubMed] [Google Scholar]
- Dejeans N, Pluquet O, Lhomond S, Grise F, Bouchecareilh M, Juin A, Meynard-Cadars M, Bidaud-Meynard A, Gentil C, Moreau V, et al. 2012. Autocrine control of glioma cells adhesion/migration through Inositol Requiring enzyme 1α (IRE1α)-mediated cleavage of Secreted Protein Acidic Rich in Cysteine (SPARC) mRNA. J Cell Sci 125: 4278–4287 [DOI] [PubMed] [Google Scholar]
- Dweep H, Sticht C, Pandey P, Gretz N 2011. miRWalk–database: Prediction of possible miRNA binding sites by “walking” the genes of three genomes. J Biomed Inform 44: 839–847 [DOI] [PubMed] [Google Scholar]
- Fabian MR, Sonenberg N, Filipowicz W 2010. Regulation of mRNA translation and stability by microRNAs. Annu Rev Biochem 79: 351–379 [DOI] [PubMed] [Google Scholar]
- Filmus J, Capurro M, Rast J 2008. Glypicans. Genome Biol 9: 224. [DOI] [PMC free article] [PubMed] [Google Scholar]
- Fransson LA 2003. Glypicans. Int J Biochem Cell Biol 35: 125–129 [DOI] [PubMed] [Google Scholar]
- Gaddam D, Stevens N, Hollien J 2013. Comparison of mRNA localization and regulation during endoplasmic reticulum stress in Drosophila cells. Mol Biol Cell 24: 14–20 [DOI] [PMC free article] [PubMed] [Google Scholar]
- Greenman C, Stephens P, Smith R, Dalgliesh GL, Hunter C, Bignell G, Davies H, Teague J, Butler A, Stevens C, et al. 2007. Patterns of somatic mutation in human cancer genomes. Nature 446: 153–158 [DOI] [PMC free article] [PubMed] [Google Scholar]
- Griffiths-Jones S, Saini HK, van Dongen S, Enright AJ 2008. miRBase: Tools for microRNA genomics. Nucleic Acids Res 36 (Database issue): D154–D158 [DOI] [PMC free article] [PubMed] [Google Scholar]
- Gupta S, Read DE, Deepti A, Cawley K, Gupta A, Oommen D, Verfaillie T, Matus S, Smith MA, Mott JL, et al. 2012. Perk-dependent repression of miR-106b-25 cluster is required for ER stress-induced apoptosis. Cell Death Dis 3: e333. [DOI] [PMC free article] [PubMed] [Google Scholar]
- Han D, Lerner AG, Vande Walle L, Upton JP, Xu W, Hagen A, Backes BJ, Oakes SA, Papa FR 2009. IRE1α kinase activation modes control alternate endoribonuclease outputs to determine divergent cell fates. Cell 138: 562–575 [DOI] [PMC free article] [PubMed] [Google Scholar]
- Hidaka H, Seki N, Yoshino H, Yamasaki T, Yamada Y, Nohata N, Fuse M, Nakagawa M, Enokida H 2012. Tumor suppressive microRNA-1285 regulates novel molecular targets: Aberrant expression and functional significance in renal cell carcinoma. Oncotarget 3: 44–57 [DOI] [PMC free article] [PubMed] [Google Scholar]
- Hollien J, Weissman JS 2006. Decay of endoplasmic reticulum-localized mRNAs during the unfolded protein response. Science 313: 104–107 [DOI] [PubMed] [Google Scholar]
- Hollien J, Lin JH, Li H, Stevens N, Walter P, Weissman JS 2009. Regulated Ire1-dependent decay of messenger RNAs in mammalian cells. J Cell Biol 186: 323–331 [DOI] [PMC free article] [PubMed] [Google Scholar]
- Hoon DS, Spugnardi M, Kuo C, Huang SK, Morton DL, Taback B 2004. Profiling epigenetic inactivation of tumor suppressor genes in tumors and plasma from cutaneous melanoma patients. Oncogene 23: 4014–4022 [DOI] [PMC free article] [PubMed] [Google Scholar]
- Huang V, Place RF, Portnoy V, Wang J, Qi Z, Jia Z, Yu A, Shuman M, Yu J, Li LC 2012. Upregulation of Cyclin B1 by miRNA and its implications in cancer. Nucleic Acids Res 40: 1695–1707 [DOI] [PMC free article] [PubMed] [Google Scholar]
- Huntzinger E, Izaurralde E 2011. Gene silencing by microRNAs: Contributions of translational repression and mRNA decay. Nat Rev Genet 12: 99–110 [DOI] [PubMed] [Google Scholar]
- Iqbal J, Dai K, Seimon T, Jungreis R, Oyadomari M, Kuriakose G, Ron D, Tabas I, Hussain MM 2008. IRE1β inhibits chylomicron production by selectively degrading MTP mRNA. Cell Metab 7: 445–455 [DOI] [PMC free article] [PubMed] [Google Scholar]
- Jakubovic BD, Jothy S 2007. Glypican-3: From the mutations of Simpson-Golabi-Behmel genetic syndrome to a tumor marker for hepatocellular carcinoma. Exp Mol Pathol 82: 184–189 [DOI] [PubMed] [Google Scholar]
- Jalvy-Delvaille S, Maurel M, Majo V, Pierre N, Chabas S, Combe C, Rosenbaum J, Sagliocco F, Grosset CF 2012. Molecular basis of differential target regulation by miR-96 and miR-182: The Glypican-3 as a model. Nucleic Acids Res 40: 1356–1365 [DOI] [PMC free article] [PubMed] [Google Scholar]
- Kozomara A, Griffiths-Jones S 2011. miRBase: Integrating microRNA annotation and deep-sequencing data. Nucleic Acids Res 39 (Database issue): D152–D157 [DOI] [PMC free article] [PubMed] [Google Scholar]
- Laloo B, Simon D, Veillat V, Lauzel D, Guyonnet-Duperat V, Moreau-Gaudry F, Sagliocco F, Grosset C 2009. Analysis of post-transcriptional regulations by a functional, integrated, and quantitative method. Mol Cell Proteomics 8: 1777–1788 [DOI] [PMC free article] [PubMed] [Google Scholar]
- Laloo B, Maurel M, Jalvy-Delvaille S, Sagliocco F, Grosset CF 2010. Analysis of post-transcriptional regulation using the FunREG method. Biochem Soc Trans 38: 1608–1614 [DOI] [PubMed] [Google Scholar]
- Lerner RS, Seiser RM, Zheng T, Lager PJ, Reedy MC, Keene JD, Nicchitta CV 2003. Partitioning and translation of mRNAs encoding soluble proteins on membrane-bound ribosomes. RNA 9: 1123–1137 [DOI] [PMC free article] [PubMed] [Google Scholar]
- Ma F, Liu X, Li D, Wang P, Li N, Lu L, Cao X 2010. MicroRNA-466l upregulates IL-10 expression in TLR-triggered macrophages by antagonizing RNA-binding protein tristetraprolin-mediated IL-10 mRNA degradation. J Immunol 184: 6053–6059 [DOI] [PubMed] [Google Scholar]
- Maurel M, Jalvy S, Ladeiro Y, Combe C, Vachet L, Sagliocco F, Bioulac-Sage P, Pitard V, Jacquemin-Sablon H, Zucman-Rossi J, et al. 2013. A functional screening identifies five microRNAs controlling glypican-3: Role of miR-1271 down-regulation in hepatocellular carcinoma. Hepatology 57: 195–204 [DOI] [PubMed] [Google Scholar]
- Meder B, Keller A, Vogel B, Haas J, Sedaghat-Hamedani F, Kayvanpour E, Just S, Borries A, Rudloff J, Leidinger P, et al. 2011. MicroRNA signatures in total peripheral blood as novel biomarkers for acute myocardial infarction. Basic Res Cardiol 106: 13–23 [DOI] [PubMed] [Google Scholar]
- Mizushima S, Nagata S 1990. pEF-BOS, a powerful mammalian expression vector. Nucleic Acids Res 18: 5322. [DOI] [PMC free article] [PubMed] [Google Scholar]
- Moenner M, Pluquet O, Bouchecareilh M, Chevet E 2007. Integrated endoplasmic reticulum stress responses in cancer. Cancer Res 67: 10631–10634 [DOI] [PubMed] [Google Scholar]
- Nguyen DT, Kebache S, Fazel A, Wong HN, Jenna S, Emadali A, Lee EH, Bergeron JJ, Kaufman RJ, Larose L, et al. 2004. Nck-dependent activation of extracellular signal-regulated kinase-1 and regulation of cell survival during endoplasmic reticulum stress. Mol Biol Cell 15: 4248–4260 [DOI] [PMC free article] [PubMed] [Google Scholar]
- Oikawa D, Tokuda M, Hosoda A, Iwawaki T 2010. Identification of a consensus element recognized and cleaved by IRE1α. Nucleic Acids Res 38: 6265–6273 [DOI] [PMC free article] [PubMed] [Google Scholar]
- Orom UA, Nielsen FC, Lund AH 2008. MicroRNA-10a binds the 5′UTR of ribosomal protein mRNAs and enhances their translation. Mol Cell 30: 460–471 [DOI] [PubMed] [Google Scholar]
- Pillai RS, Bhattacharyya SN, Filipowicz W 2007. Repression of protein synthesis by miRNAs: How many mechanisms? Trends Cell Biol 17: 118–126 [DOI] [PubMed] [Google Scholar]
- Pyhtila B, Zheng T, Lager PJ, Keene JD, Reedy MC, Nicchitta CV 2008. Signal sequence- and translation-independent mRNA localization to the endoplasmic reticulum. RNA 14: 445–453 [DOI] [PMC free article] [PubMed] [Google Scholar]
- Rehmsmeier M, Steffen P, Hochsmann M, Giegerich R 2004. Fast and effective prediction of microRNA/target duplexes. RNA 10: 1507–1517 [DOI] [PMC free article] [PubMed] [Google Scholar]
- Reimand J, Kull M, Peterson H, Hansen J, Vilo J 2007. g:Profiler—a web-based toolset for functional profiling of gene lists from large-scale experiments. Nucleic Acids Res 35 (Web Server issue): W193–W200 [DOI] [PMC free article] [PubMed] [Google Scholar]
- Saldanha AJ 2004. Java Treeview—extensible visualization of microarray data. Bioinformatics 20: 3246–3248 [DOI] [PubMed] [Google Scholar]
- Schroder M, Kaufman RJ 2005. The mammalian unfolded protein response. Annu Rev Biochem 74: 739–789 [DOI] [PubMed] [Google Scholar]
- Scott MS, Avolio F, Ono M, Lamond AI, Barton GJ 2009. Human miRNA precursors with box H/ACA snoRNA features. PLoS Comput Biol 5: e1000507. [DOI] [PMC free article] [PubMed] [Google Scholar]
- Shirakawa H, Suzuki H, Shimomura M, Kojima M, Gotohda N, Takahashi S, Nakagohri T, Konishi M, Kobayashi N, Kinoshita T, et al. 2009. Glypican-3 expression is correlated with poor prognosis in hepatocellular carcinoma. Cancer Sci 100: 1403–1407 [DOI] [PMC free article] [PubMed] [Google Scholar]
- Tabas I, Ron D 2011. Integrating the mechanisms of apoptosis induced by endoplasmic reticulum stress. Nat Cell Biol 13: 184–190 [DOI] [PMC free article] [PubMed] [Google Scholar]
- Tam AB, Mercado EL, Hoffmann A, Niwa M 2012. ER stress activates NF-κB by integrating functions of basal IKK activity, IRE1 and PERK. PLoS One 7: e45078. [DOI] [PMC free article] [PubMed] [Google Scholar]
- Troyanskaya OG, Dolinski K, Owen AB, Altman RB, Botstein D 2003. A Bayesian framework for combining heterogeneous data sources for gene function prediction (in Saccharomyces cerevisiae). Proc Natl Acad Sci 100: 8348–8353 [DOI] [PMC free article] [PubMed] [Google Scholar]
- Vasudevan S 2012. Posttranscriptional upregulation by microRNAs. Wiley Interdiscip Rev RNA 3: 311–330 [DOI] [PubMed] [Google Scholar]
- Vasudevan S, Tong Y, Steitz JA 2007. Switching from repression to activation: MicroRNAs can up-regulate translation. Science 318: 1931–1934 [DOI] [PubMed] [Google Scholar]
- Walter P, Ron D 2011. The unfolded protein response: From stress pathway to homeostatic regulation. Science 334: 1081–1086 [DOI] [PubMed] [Google Scholar]
- Woehlbier U, Hetz C 2011. Modulating stress responses by the UPRosome: A matter of life and death. Trends Biochem Sci 36: 329–337 [DOI] [PubMed] [Google Scholar]
- Xue Z, He Y, Ye K, Gu Z, Mao Y, Qi L 2011. A conserved structural determinant located at the interdomain region of mammalian inositol-requiring enzyme 1α. J Biol Chem 286: 30859–30866 [DOI] [PMC free article] [PubMed] [Google Scholar]
- Yang F, Zhang L, Wang F, Wang Y, Huo XS, Yin YX, Wang YQ, Sun SH 2011. Modulation of the unfolded protein response is the core of microRNA-122-involved sensitivity to chemotherapy in hepatocellular carcinoma. Neoplasia 13: 590–600 [DOI] [PMC free article] [PubMed] [Google Scholar]
- Zuker M, Mathews DH, Turner DH 1999. Algorithms and thermodynamics for RNA secondary structure prediction: A practical guide. In RNA biochemistry and biotechnology (ed. Barciszewski J, Clark BFC), pp. 11–43 NATO ASI Series, Kluwer Academic Publishers, Norwell, MA [Google Scholar]
Associated Data
This section collects any data citations, data availability statements, or supplementary materials included in this article.