

All-atom molecular dynamics simulations of the adenine-sensing add A-riboswitch to study the breaking of the kissing loop, a key tertiary element in the aptamer structure, were performed. A two-step process was observed in all the simulated systems. A general loss of stacking and hydrogen bond interactions is first seen. The junction area is partially organized before the kissing loop formation and one residue, A24, anchors together the loop helices.
Keywords: molecular dynamics simulation, free energy calculation, kissing loops, atomic interactions, RNA aptamer, adenine riboswitch
Abstract
Riboswitches are mRNA-based molecules capable of controlling the expression of genes. They undergo conformational changes upon ligand binding, and as a result, they inhibit or promote the expression of the associated gene. The close connection between structural rearrangement and function makes a detailed knowledge of the molecular interactions an important step to understand the riboswitch mechanism and efficiency. We have performed all-atom molecular dynamics simulations of the adenine-sensing add A-riboswitch to study the breaking of the kissing loop, one key tertiary element in the aptamer structure. We investigated the aptamer domain of the add A-riboswitch in complex with its cognate ligand and in the absence of the ligand. The opening of the hairpins was simulated using umbrella sampling using the distance between two loops as the reaction coordinate. A two-step process was observed in all the simulated systems. First, a general loss of stacking and hydrogen bond interactions is seen. The last interactions that break are the two base pairs G37-C61 and G38-C60, but the break does not affect the energy profile, indicating their pivotal role in the tertiary structure formation but not in the structure stabilization. The junction area is partially organized before the kissing loop formation and residue A24 anchors together the loop helices. Moreover, when the distance between the loops is increased, one of the hairpins showed more flexibility by changing its orientation in the structure, while the other conserved its coaxial arrangement with the rest of the structure.
INTRODUCTION
Riboswitches represent a class of RNA molecules that are capable of controlling gene expression by sensing and binding small molecules (Nudler and Mironov 2004; Dann et al. 2007; Edwards et al. 2007). Riboswitches have been found mainly in 5′ untranslated regions of bacterial mRNA but have also been observed in 5′ and 3′ untranslated regions and introns of mRNA of plants and fungi (Mandal et al. 2003; Winkler and Breaker 2005; Thore et al. 2006). While it was, until recently, believed that only proteins were capable of controlling genetic expression in cells, riboswitches are now thought to be reminiscent of an era before the evolution of amino acids and proteins (Barrick and Breaker 2007; Breaker 2008). Riboswitches exert their regulatory control in a cis-fashion by binding a small metabolite ligand that results in a structural change which, in turn, modulates the expression of the remaining mRNA strand (Mandal and Breaker 2004; Mandal et al. 2004). A typical riboswitch contains two functional domains, an evolutionally conserved sensing or aptamer domain and a nonconserved expression platform. The appropriate ligand is recognized by the aptamer domain which then folds into a three-dimensional structure, trapping the ligand molecule in a binding pocket. The second domain, the expression platform, contains a secondary structural switch that interfaces with the transcriptional or translational machinery. The regulation is achieved by an overlapping region between these two domains, the switching sequence. The secondary structure of this sequence, which depends on the presence or absence of the ligand, directs the folding of the rest of the expression platform into two mutually exclusive forms that represent the on and off states of the mRNA (Garst et al. 2011; Batey 2012; Serganov and Patel 2012). The active role that riboswitches play in regulating bacterial transcription makes them enticing targets for development of novel antibiotics, and several drug-like small molecules have been found to bind to riboswitches and slow cell growth (Sudarsan et al. 2005; Blount et al. 2007; Lee et al. 2009).
Riboswitches must be able to discriminate between closely related metabolic ligands with high selectivity to elicit the appropriate regulatory response. They have been found to be involved in sensing the intracellular concentrations of a wide range of small metabolites such as adenine, guanine, thiamine pyrophosphate, S-adenosylmethionine, S-adenosylhomocysteine, glucosamine-6-phosphate, glycine, lysine, Mg2+, and coenzyme B12 (Edwards et al. 2007; Serganov and Patel 2012).
The aptamer domains of purine riboswitches are structurally very similar, and their sequences are highly conserved, with differences associated with the ligand recognition residues (U for adenine ligand and C for guanine) in the binding site (Serganov et al. 2004; Gilbert et al. 2009) and some base pairs in the stems (Lemay and Lafontaine 2007; Mulhbacher and Lafontaine 2007). The structure of purine aptamer domains has been determined by X-ray crystallography (Batey et al. 2004; Serganov et al. 2004) and widely studied by NMR spectroscopy (Noeske et al. 2005, 2007; Buck et al. 2007; Ottink et al. 2007). It contains three conserved helical elements (P1, P2, and P3) that are present in all purine riboswitch sequences identified up until now. The tertiary structure of these three helices can, very simply, be described by two main principles. The P2 and P3 stems are stacked on top of P1 in a coaxial manner and are joined by a junction region, and secondly, the P2 and P3 hairpins are joined by kissing loop interactions between L2 and L3 (Fig. 1). The add A-riboswitch is a purine riboswitch, sensing adenine, whose structure was solved with X-ray crystallography by Serganov et al. (2004). It affects the gene expression of the add gene, encoding for adenine deaminase, via the activation of mRNA translation. In the presence of adenine, the fold of the aptamer domain is stabilized and the Shine–Dalgarno (GAA) sequence becomes exposed for interaction with ribosomal RNA and tRNA, leading to the initiation of translation. In the add A-riboswitch, the adenine ligand forms a Watson-Crick base pair with U74 (a specificity-determining residue) in the binding pocket. Near the binding site are also two chelated Mg2+ ions bound to the phosphates of A23 and A24.
FIGURE 1.

Aptamer domain of the add A-riboswitch represented as (A) 2-D secondary structure including stem base pair hydrogen bonds and residue numbering, together with a sketch of the angles, P1-J-L2, L2-J-L3, and P1-J-L3, and (B) a representative snapshot of the equilibrated 3-D structure. The colors represent segments of the RNA: Stem P1 is in cyan, stem P2 and loop L2 are in orange, stem P3 and loop L3 are in green, the junction-connecting segments J1-2, J2-3, and J3-1 are in red, and the adenine ligand guanine is shown in blue. (C) Sketch of the interactions between L2 and L3 loops.
The close relationship between structure and function in riboswitches makes a detailed knowledge of the mechanisms and energy landscape associated with folding imperative for the understanding of riboswitch function and efficiency. While X-ray crystal structures provide detailed information about the three-dimensional structure, they lend no insight into how these structures are formed. Several other techniques have, however, been employed to study the folding of riboswitches (for an overview, see reviews in Batey 2012; Serganov and Patel 2012). Lemay et al. used the fluorescence resonance energy transfer (FRET) technique to study the folding of the pbuE adenine riboswitch, and they reported the formation of the loop–loop interactions in the absence of adenine and an enhancement of loop–loop interactions after adenine binding (Lemay et al. 2006). Lemay et al. used the P1-P3 vector in their analysis, Brenner et al. recently proposed a folding model for the xpt G-riboswitch, based on three FRET pairs among the P1, P2, and P3 helices (Brenner et al. 2010). They identified at least three conformational states for the helices and an increase of the P1-P3 distance upon folding. Time-resolved fluorescence was used to investigate the binding pocket heterogeneity (Eskandari et al. 2007; Jain et al. 2010). Using fluorescence spectroscopy on five variants of the full-length add riboswitch (obtained by substituting residues in key positions with the fluorescent analog, 2-aminopurine), Rieder et al. (2007) reported that the add sequence allows a large portion of the aptamer to form (stems P2 and P3, loops L2/L3), even if the repressor stem is fully extended, assisting the zippering of stem P1 and ligand recognition. In 2008, Greenleaf et al. reported a study using single-molecule force measurements that investigated the folding pathway of the pbuE adenine riboswitch (Greenleaf et al. 2008). Several intermediate states were observed during the unfolding of the riboswitch, both in the absence and presence of the adenine ligand. Application of force to the folded riboswitch leads to the initial disruption of the P1 stem followed by the loss of tertiary contacts between L2 and L3, after which the stems P3 and P2 sequentially lose base-pairing to yield the completely unfolded structure. Neupane et al. (2011) reported the folding of the add A-riboswitch with single molecule spectroscopy. The observed folding landscape highlighted that P3 folded at a higher force than P2 in the add A-riboswitch (different from what Greenleaf et al. previously observed for pbuE aptamer). This was already predicted by a Langevin dynamics study of the add A-riboswitch (Lin and Thirumalai 2008), and it may be due to the different stability of the helices P2 and P3 in the two aptamers. The authors observed also that P1 in the add aptamer is similar in stability to P2 and P3 even in the absence of the cognate ligand, adenine. In real-time NMR studies, Lee et al. also investigated the folding of the full-length add adenine sensing riboswitch and reported the formation of the P1 stem at the early steps of the folding process (Lee et al. 2010).
In this study, the breaking of the interaction between the loops, L2 and L3, in the aptamer domain of the add A-riboswitch is investigated at the atomistic level using molecular dynamics (MD) simulations. The add aptamer is simulated in complex with and in the absence of its cognate ligand, adenine. The simulations in the absence of the cognate ligand allow us to identify which interactions are stabilized by the presence of the ligand. MD simulations together with a classical force field have previously been successfully used to investigate the structure of the purine-aptamer in the presence and absence of the cognate ligands (Sharma et al. 2009; Villa et al. 2009; Priyakumar and MacKerell 2010). Here, we apply umbrella sampling techniques to induce the breaking of the tertiary interaction between the L2 and L3 loops. The obtained free energy profiles have been analyzed together with the opening mechanism of the kissing loops from a global and local point of view. Finally, we propose a hypothesis for the binding mechanism, which is based on a combination of simulation results and published experimental results.
RESULTS
Add A-riboswitch aptamer bound to the cognate ligand
The aptamer domain of the add A-riboswitch bound to the cognate ligand adenine has been simulated in magnesium/water solution. During the simulations, all secondary and tertiary structure elements observed in the experimental structure (Serganov et al. 2004) have been conserved (Fig. 1). Residues in stem P1, P2, and P3 are base-paired, according to the secondary structure representation in Figure 1A. The kissing loops L2 and L3 form a tertiary interaction, characterized by two base tetrads (U34•A65•C61-G37 and A33•A66•C60-G38) and one noncanonical base pair (A64•A35) that create an intricate hydrogen bond network between the loops (Fig. 1C). The tertiary interaction in the junction area (J1-2, J2-3, and J3-1 in red in Fig. 1) is also conserved with two triplets (A23•G46-C53 and water-mediated A73•A52-U22), located above the binding site, and two triplets (C50•U75-A21 and U49•A76-U20), located below the binding site. The adenine is locked by residue U51 and U74 and forms a triplet (U51•adenine-U74) that stacks with triplets A73•A52-U22 and C50•U75-A21 (Fig. 2A).
FIGURE 2.
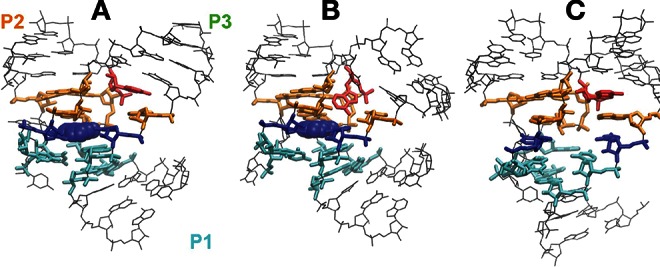
Binding pocket of the aptamer domain of the add A-riboswitch. (A) Structure at a L2-L3 distance of 13 Å. (B) Structure at a L2-L3 distance of 34 Å. (C) Structure in the absence of the ligand at 34 Å. Residue A24 in red, adenine and residues U51 and U74 in blue, triplets (A23•G46-C53 and water-mediated A73•A52-U22) in orange, triplets (C50•U75-A21 and U49•A76-U20) in cyan.
The breaking of the tertiary interaction between L2 and L3 of the add-A riboswitch aptamer has been simulated by applying an extra potential along a reaction coordinate defined as the distance between the centers-of-mass of the backbone atoms of the two kissing loops (residues 32–38 for L2 and 60–66 for L3). Sampling along the reaction coordinate was performed every 0.5 Å starting from 12.5 Å up to 34 Å. The average P2-P3 distance in the equilibrium simulation is 13.0 Å, slightly shorter than in the X-ray structure (13.4 Å). The sampled conformations at the different distances have then been combined, yielding a free-energy profile as a function of the reaction coordinate. The obtained potentials of mean force for two independent replicas are reported in Figure 3. Both curves show a minimum at 13 Å (the L2-L3 distance observed at equilibrium), and reach a plateau at ∼27 Å. Between these two points, the curves show two distinct regions: They first grow stiffer up to 17–18 Å, then softer. Conformations at the minimum of the energy profile will be labeled as “closed” and conformations at a distance >27 Å as “open.” Insets in Figure 3 show averaged structures of the aptamer-complex at a L2-L3 distance of 13 Å (closed conformation), 22 Å, and 34 Å (open conformation). The free-energy difference between the closed and open conformation of the kissing loops along the selected coordinate is ∼14 kcal/mol ± 3 kcal/mol.
FIGURE 3.

Riboswitch aptamer in complex with adenine. Potentials of mean force along the distance between the center of mass of L2 loop and L3 loop backbone atoms. Black and gray lines represent independent replicas. Error bars are plotted only for three points. Insets show the average aptamer structure at a L2-L3 distance of 13, 22, and 34 Å.
We have analyzed the effect of the increasing distance between the kissing loops on the intra-molecular interactions of the aptamer domain. First of all, we looked at the secondary structure elements in the whole domain. All of the secondary structure elements (Fig. 1A) in P1, P2, and P3 stems have been conserved during the separation of the kissing loops in both replicas. Then, we have monitored the tertiary structure elements. In particular, we analyzed the hydrogen bond network and the stacking interactions in the kissing loops region and in the junction region and the solvent-accessible surface of the aptamer residues as a function of the distance of the kissing loops. Below, we discuss in detail only those properties that change upon increasing L2-L3 distance.
In the closed conformation, the kissing loops are held together by two Watson-Crick base pairs (G37-C61 and G38-C60) and four noncanonical base pairs (A64•A35, A65•U34, A66•A33, and U31•U39). Eight of these bases form the two tetrads U34•A65•C61-G37 and A33•A66•C60-G38, which contribute to an intricate hydrogen bond network between the L2 and L3 loops. On average, 10 hydrogen bonds are observed between the two loops. As soon as the distance between L2 and L3 increases, the hydrogen bonds between the noncanonical base pairs quickly break, and the number of hydrogen bonds decreases to a plateau value of six at an L2-L3 distance of ∼18–24 Å (Fig. 4). In this plateau region, the hydrogen bonds between the canonical G37-C61 and G38-C60 base pairs and, more rarely, between A35 and the backbone of U62 are retained (see inset in Fig. 3). These base pairs last up to a distance of ∼25 Å, and then they are simultaneously broken.
FIGURE 4.

Riboswitch aptamer in complex with adenine. Top: average number of hydrogen bonds between the L2-L3 loops as a function of distance between loops during opening. Bottom: average number of base–base stacking interactions involving the residues 32–38 (loop L2) and/or 60–66 (loop L3).
In addition to the hydrogen bonds, a network of stacking interactions exists between the two tetrad platforms and between these platforms and other base pairs anchoring L2 and L3 (examples are G37/G38, C60/C61, A35/C61, U63/A35, U34/A64, A33/U31•U39, and U62/A35•A64). Among all the loop bases, a total of 16 stacking interactions are observed to contribute to the stabilization of the tertiary interactions between the two loops. The total number of inter-loop and intra-loop base stacking interactions present in the closed structure decreases by 20% when the L2-L3 distance is increased from 13 Å to 17 Å (Fig. 4). After a sharp drop in the initial steps of the kissing loop opening, a plateau of, on average, 13 base stacking interactions is reached. The lost stacking interactions are mainly the inter-loop base stacking interactions involving adenine and uridine bases, but some of these interactions are compensated by the formation of new intra-loop stacking interactions (examples are U31/U32 or U63/U64). Most of the original intra-loop– base stacking interactions (such as G37/G38 and C60/C61) are conserved throughout the opening process apart from brief periods of structural relaxation.
Another property that changes upon increasing the loop–loop distance is the solvent-accessible surface of the bases in the loops. The water-accessible surface in the closed conformation is ∼3300 Å2 for the bases in loops L2 and L3 together. In the case of L2, this value smoothly increases up to 10% in the open conformation, while the value for L3 stays constant. The loss of the hydrogen bond network and stacking interactions, observed when the L2-L3 distance increases, provokes the flipping out of some residues whose hydrophobic base rings become exposed to the solvent.
In the open conformation, the residues constituting the binding pocket keep the tertiary interactions described above for the equilibrium conformation (Fig. 2). A root-mean-square deviation (RMSD) of ∼1–2 Å between the open and closed conformation for the junction-residues (22–24, 46–53, and 73–74) was observed in all of the replicas. The triplets keep their alignment and sandwich the adenine in the same fashion as at equilibrium. The junction residues A73, G72, and A24 and their interaction are the most affected by the opening of the kissing loop, as shown in Figure 2B. In particular, the bases A24 (located in the J1-2 junction region) and A73 (located in the J2-3 junction region) become more accessible to the solvent with increasing distance between L2 and L3 (their solvent-accessible surface increases >30%). In the closed conformation, residue A24 is sandwiched between residues A73 and G72-C54, acting like a hook keeping helices P2 and P3 together. In the open conformation, the packing between residues A24 and A73 is lost, the corresponding bases become accessible to solvent, and as a consequence, the alignment between helix P1 and helix P3 is lost (see discussion below). However, the structure of the junction area is not affected.
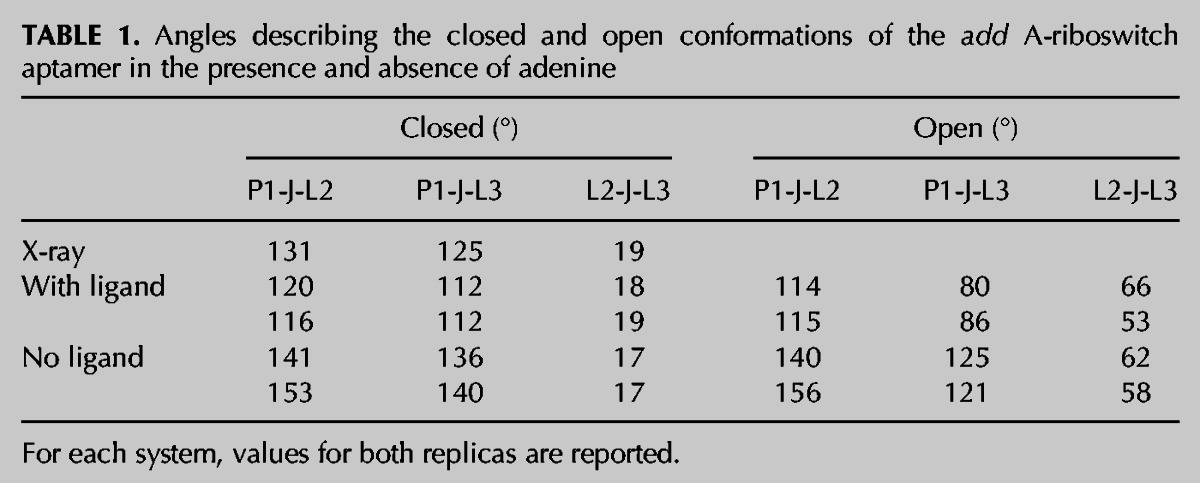
To provide a global description of the opening of the kissing loops, we describe the aptamer structure by three angles between the P1 helix, the junction area, and the L2 and L3 loops, which were calculated according to the definition reported in the Materials and Methods section (see Fig. 1 for a schematic representation). Table 1 reports the values of the angles for the open and closed conformations. The values for intermediate structures between the end points follow a linear path. Both replicas have the same trend. During the opening of the loops, the L2-J-L3 angle increases by ∼40°, the P1-J-L3 angle decreases by ∼30°, while the P1-J-L2 angle is constant within the error margin. This indicates a change in orientation of the P3 helix with respect to the P2 and P1 helices, which conserve their coaxial position. Insets in Figure 3 report an example of the conformational changes upon kissing loop opening at three distances along the reaction coordinate. The parallel orientation, which both helices P2 and P3 have in relation to helix P1 in the relaxed state, is, to a large extent, conserved for P2 during the opening of the loops, while the P3 helix changes its position to an almost perpendicular orientation to P1 in the open conformation, loosing alignment with the P1 helix.
TABLE 1.
Angles describing the closed and open conformations of the add A-riboswitch aptamer in the presence and absence of adenine
In summary, the first sharp increase observed in the free-energy profile corresponds to the initial disruption of inter-loop base stacking interactions and the breakage of the hydrogen bond network between noncanonical base pairs. Breaking of the hydrogen bonds between G37-C61 and G38-C60 at 25–30 Å L2-L3 distance does not directly affect the free-energy profile and is not associated with a loss in stacking interactions; the bases G37/G38 and C60/C61 remain stacked once they lose their base-pair hydrogen bonds. This indicates that the role of residues G37-G38 for L2, and C60-C61 for L3, is to give direction to the loop–loop interaction, more than to stabilize it, while stacking interactions stabilized the interaction between the loops L2 and L3. The opening of the loops is also associated with a solvation cost that grows in a linear way. This can be correlated with the softer growth of the energy profile between the 20–25 Å L2-L3 distance. In this interval, no change in hydrogen bond and stacking interactions is observed.
Add A-riboswitch aptamer in the absence of the cognate ligand
The removal of the bound adenine ligand from the binding pocket does not result in any major secondary or tertiary structural rearrangements during the equilibration. Note that our aim is not to sample the complete conformational space of the ligand-free riboswitches but to assess what effect the ligand has on the loop–loop interactions. The sample structures in the absence of the ligand are some of the possible conformations accessible to the system. However, after the removal of the ligand, the root-mean-square fluctuation of the residues in the junction area increases by 20% (data not shown), in agreement with previous MD studies (Sharma et al. 2009; Villa et al. 2009; Priyakumar and MacKerell 2010). The bases A21 and A19 (helix P1) and U74 (ligand recognition residue located in junction area J3-1) and U75 (helix P1) become more exposed to solvent than in the complex with adenine. The solvent-accessible area of these three bases changes from 20–40 Å2 in the presence of the ligand to 50–80 Å2 in absence of the adenine. The base pair A21-U75 (closing base pair of the P1 helix and involved in the triplet C50•A21-U75 below the binding pocket) is weakly formed, while the triplet above the binding site conserves the hydrogen bond network and planarity. Additionally, a slight collapse of the kissing loops is observed after removal of the bound ligand, as is evident from a slightly shorter average distance between the center of mass of the two hairpins constituted by residues 29–41 and 57–69 (13.2 ± 0.4 Å in the presence of the ligand and 12.4 ± 0.7 Å in the absence of the ligand), while the distance between the two loops is constant (13.0 Å) in both the presence and absence of adenine. This suggests that it is the P2 and P3 stems that come closer after removal of the ligand.
The free-energy profiles for the loops opening as a function of the distance between L2 and L3 loops show a minimum at 13 Å (Fig. 5), as also observed in the ligand-aptamer complex. The potentials of mean force (PMFs) for both replicas grow stiffer up to 22–25 Å, where they reach a plateau, while a linear intermediate region was observed for the adenine-aptamer complex. The free-energy difference between the closed and open conformations of the loops along the selected coordinate is ∼10 kcal/mol higher than in the ligand-aptamer system. Insets in Figure 5 show averaged structures at a L2-L3 distance of 13 Å (closed conformation) and 22 Å and 34 Å (open conformations).
FIGURE 5.

Riboswitch aptamer in the absence of adenine. Potentials of mean force along the distance between the center of mass of L2 loop and L3 loop backbone atoms. Black and gray lines represent independent replicas. Error bars are plotted only for three points. Insets show the average aptamer structure at a L2-L3 distance of 13, 22, and 34 Å.
The number and type of hydrogen bond interactions between the two kissing loops in the closed conformation is not affected by the absence of the ligand (Fig. 6). In the closed conformation, the kissing loops are held together by two Watson-Crick base pairs (G37-C61 and G38-C60) and four noncanonical base pairs, as in the ligand-aptamer system. As soon as the distance between L2 and L3 loops increases, the hydrogen bonds between the noncanonical base pairs quickly break, followed by the hydrogen bonds between the canonical G37-C61 and G38-C60 base pairs (see inset in Fig. 5). At a distance of 22–25 Å between the two loops, the whole hydrogen bond network between the kissing loops is lost.
FIGURE 6.

Riboswitch aptamer in complex in the absence of adenine. Top: average number of hydrogen bonds between the L2-L3 loops as a function of distance between loops during opening. Bottom: average number of base–base stacking interactions involving the residues 32–38 (loop L2) and/or 60–66 (loop L3).
The number and type of stacking interactions in the loop region is also conserved in the absence of adenine in the closed conformation, as discussed previously. The total number of stacking interactions decreases with increasing distance between L2 and L3 from 16 Å (closed conformation) to 11–10 Å (open conformation), as shown in Figure 6. In the absence of the ligand, the stacking interactions C61/C60 (loop L3) and C67/U68 (P3 closing bases) are lost in the open conformations, while in the presence of the ligand, those interactions are not affected by the increasing distance between the two loops. The loss of stacking interactions between C67/U68 is correlated with the breaking of base pair C67-G59 at the end of the P3 helix, indicating a destabilization of the P3/L3 hairpin.
The junction region is also affected by the breaking of the kissing interaction between the loops (Fig. 2C). In the open conformation, the alignment between residues C50•A21-U75 above the binding site is completely lost. This alignment is one of the platforms that sandwiched the ligand binding site in the ligand-RNA complex, and it was already more loosely bound in the closed conformation than in the ligand-aptamer system. The ligand specificity-determining residue U74 is observed to flip out toward solvent, losing the stacking interaction with A73 and U75, once in the open state. The loss of the C50•A21-U75 triplet gives more flexibility to the junction residues J2-3 and J3-1 and contributes to the loss of alignment between P3 and P1. Stacking between A24 and G72 is also lost.
To analyze the global conformational change that takes place during the opening of the kissing loops, the angles between the P1 helix and the L2 and L3 loops were calculated, as for the adenine-aptamer complex. Also, in the absence of the ligand, the L2-J-L3 angle increases linearly by >40° during the opening of the L2-L3 loops. The P1-J-L3 angle decreases by >11°, while the P1-J-L2 angle is constant within the error margin (Table 1). This indicates that P1 and P2 keep their alignment, while P3 loses the alignment with P1 at the opening of the kissing loops, as in the case of the adenine-aptamer systems.
The global mechanism for the opening of the kissing loop is independent of the presence or absence of the adenine, but a high degree of destabilization of the helix P3 and junction region is observed in the absence of the ligand. In the absence of the ligand, the junction area is more unstructured. The lack of the C50•A21-U75 triplet, that forms a plateau perpendicular to the P2 and P3 helical axis and links together the P1 helix and the J2-3 junction region in the aptamer-ligand complex, promotes the loss of alignment between P1 and P3, the loss of base–base interactions in the J3-1 region (A73/U74 and U74/U75 stacking interaction), and, indirectly, the untwisting of the P3 helix and breaking of base pairs in the P3-L3 region during the breaking of the kissing loops interactions. These interactions are always conserved when the ligand is present, and the loss of extra stacking interactions in the absence of the ligand can explain the difference of 10 kcal/mol between the energy profile in Figures 3 and 5. An early MD study reports 1–4 kcal/mol (depending on nucleotide type) for each stacked base that is lost (Norberg and Nilsson 1995). Moreover, the consequent solvation of the A73, U74, and U75 bases has to be counted in the energetic cost that the system has to pay.
The simulations in the absence of the ligand are used to identify which interactions are stabilized by the presence of the ligand upon breaking the loop–loop interactions. We cannot assume that they are representative for the ligand-free aptamer system. We have to remember that the sample conformations in the absence of the ligand are possible conformations but not necessarily the most populated one (low energy conformations).
DISCUSSION AND CONCLUSIONS
We have investigated the breaking of the tertiary interactions between the L2 and L3 loops of the aptamer domain of the add A-riboswitch in the presence and absence of the cognate ligand, adenine. We investigated the opening of the kissing loops using umbrella sampling with the distance between two loops, L2 and L3, as the reaction coordinate. We have run 100 nsec for each energy profile, each with two replicas. In all simulated systems, we observed a greater structural conservation of the P2-L2 hairpin compared to the P3-L3 hairpin during the breaking of the interactions between the kissing loops. The P3-L3 hairpin is observed to go from its initial coaxial orientation with the P1 helix and parallel to the P2 helix to an almost perpendicular position in relation to the P1 and P2 helices, while the P2 helix largely remains in a coaxial orientation with P1 during the increasing of the L2-L3 distance. In the absence of the ligand, we also observe a tendency of the P3 helix to untwist, while the P2 helix conserves its initial conformation in all the systems.
The interactions between L2 and L3 break in two steps, regardless of the presence of the cognate ligand. First, a loss of hydrogen bonds in noncanonical base pairs between the kissing loops, associated with a drop in stacking interactions in the kissing loops region, followed by a second loss of hydrogen bond interactions in canonical base pairs. During this process, interactions in the junction region are also affected. The stacking interactions between the junction residues A24 and G72/A73 are lost, and A24 becomes exposed to the solvent, losing its function as a hook between helices P2 and P3. Interestingly, a structure-based fluorescence study on the A24AP aptamer variant showed a significant decrease in fluorescence upon the addition of Mg2+ ion binding (formation of the kissing loops), followed by a second decay upon addition of adenine (ligand binding), indicating that A24 goes from a solvent-exposed conformation to an intercalate state between residues G72 and A73 state upon folding/binding (Rieder et al. 2007).
In the absence of the ligand, the junction area is more affected than in the adenine-aptamer system and becomes partially unstructured, in particular, in the proximity of helix P1, in line with an NMR study on the guanine aptamer in the absence of the ligand (Ottink et al. 2007). The partially unstructured binding pocket promotes the breaking of the secondary structure element in the P1 and P3 helices and the flipping out of residues in the J1-3 region during the opening of the kissing loops. These events are associated with an extra energetic cost, as indicated by the difference in the energy profiles.
In the presence of the ligand, other interactions in the junction area are conserved upon binding. This makes the energy profile comparable to the formation free energy of kissing loops between two independent RNA hairpins. Salim et al. (2012) proposed a stabilization energy of ∼10 kcal/mol for kissing interactions among two RNA 7-mer loop hairpins, based on titration calorimetry, UV melting, and single-molecule FRET data. We report a free-energy difference of ∼14 kcal/mol between the closed and open conformations. The quantities are comparable if we account for the fact that the loss of the interactions involving residue A24 upon loop opening can be associated with 2–6 kcal/mol (for 1–4 kcal/mol for the loss of each stacked base [Norberg and Nilsson 1995] plus base solvation costs).
The details of residue interactions in the breaking of the loop–loop interaction indicates the formation of the G37-C61 and G38-C60 base pairs as the initial tertiary contacts between L2 and L3. This is in perfect agreement with the results of NMR (Buck et al. 2010) and FRET (Lemay et al. 2006) studies. These studies showed that the loop–loop interaction was not formed once mutations were performed to prevent the formation of canonical base pairs between the loops in the xpt G-riboswitch and in the pbuE A-riboswitch, respectively. Our results indicate that the role of residues G37 and G38 for L2, and C60 and C61 for L3, is to give direction to the kissing loop interaction more than to stabilize it, while it is the stacking interactions that stabilize the interactions between the two loops. The stacking interactions that are broken upon loops opening are mainly inter-loop interactions that involve uridines and adenine residues. Interestingly, a recent nonequilibrium molecular dynamics simulation study on a model kissing loop from the Moloney murine leukemia virus shows that stacking interactions with unpaired, adjacent loop adenines stabilize the kissing loop complex by increasing the repair rate of partially broken hydrogen bonds (Chen and Garcia 2012).
The interactions between the P2 and P3 hairpins in purine riboswitches are a crucial part of their function and are influenced by the presence of the ligand and the Mg2+ ion concentration. The existing experimental and simulated work on the unfolding is not unanimous regarding the folding mechanism of the two hairpins. In their single-molecule force measurement experiment of the pbuE A-riboswitch, Greenleaf et al. (2008) saw that P3 unfolds before P2, indicating less stability of P3. In Langevin simulations of the aptamer domain of the add A-riboswitch (Lin and Thirumalai 2008), however, P2 was found to unfold before P3. This agrees with recent results from single-molecule experiments performed by Neupane et al. (2011) on the add A-riboswitch. The authors attributed the difference to the different relative stability of the helices P2 and P3 in pbuE and add aptamer domains. However, the results cannot be compared directly with our study, since the P1 helix is completely unfolded once the kissing loops are open in the experiment, while we studied the unfolding of the kissing loops without pre-unfolding of the P1 helix. Interestingly, a real-time NMR experiment on add A-riboswitch folding (Lee et al. 2010) did not distinguish any particular order of the formation of the three helices P1, P2, and P3 within the time resolution of their experiment, but the authors observed that the adenine is bound to the central core of the aptamer before the stabilization of stem P2 and P3 and L2-L3 interactions occurred. Previously, Lemay also showed that the ligand promotes the formation of the kissing loop (Lemay et al. 2006).
Our results clearly indicate a mobility of the folded helices relative to each other regardless of ligand presence, in line with the diverse conformational states for aptamers’ stems and an increase in the P1-P3 helical distance upon folding observed by Brenner et al. for the xpt G-riboswitch (Brenner et al. 2010). To correlate our simulation results with experimental results of Brenner et al. (2010), we have calculated the distances between the dye locations from our structures, and a clear correlation is observed between the P1-P3 distance and opening of the kissing loops. In both systems, the P1-P3 distance decreases linearly at the opening of the kissing loops for a total of 7–8 Å. However, our analysis shows a high conformational flexibility for P3 with respect to P2 and P1, while Brenner et al. interpret their data as showing that P2 is highly flexible in relation to P1 and P3 before ligand binding. This difference could be due to a not unique interpretation of the experimental data or to our sampling being biased by the selected reaction coordinate, L2-L3 distance. The difference in sequence between the adenine and guanine riboswitches in the P1, P2, and P3 helices (even if it is very tiny) may also play a role (Lemay and Lafontaine 2007; Mulhbacher and Lafontaine 2007). Interestingly, the add A-riboswitch has a wobble base pair in the middle of P2, while the xpt G-riboswitch has one in the middle of P3.
On the basis of our simulation results, we propose a model for the conformational changes that the add aptamer experiences upon binding. We assume the helices P2 and P3 to be preformed, while we assume helix P1 to be partially formed (but we can not exclude that it may be completely unfolded). Figure 7 shows a schema of our hypothesis divided into four steps. In Step 1, the interactions between residues A23•G46-C53 and A52-U22 in the junction area are formed and create a sort of platform to accommodate the ligand in the future, and the helices P2 and P3 come closer to each other. In all our systems, those interactions are present in the open conformation, while the base triplets below the binding site (C50•U75-A21 and U49•A76-U20) are not present in the open conformation in the absence of the ligand. In Step 2, the kissing loops interaction is formed, driven by the formation of base pairs G37-C61 and G38-C60. Residue A24 anchors together the P2 and P3 helices, forming stacking interactions with A73 and G72, and at the same time, the water-mediated A73•A52-U22 triplet is formed. In Step 3, the ligand approaches the binding site, forms stacking interaction with the platform formed by triplets A23•G46-C53 and water-mediated A73•A52-U22 and is locked by residues U51 and C74. This promotes the alignment between P1 and P3 and the formation of the triplets C50•U75-A21 and U49•A76-U20 to close the binding pocket (Step 4).
FIGURE 7.
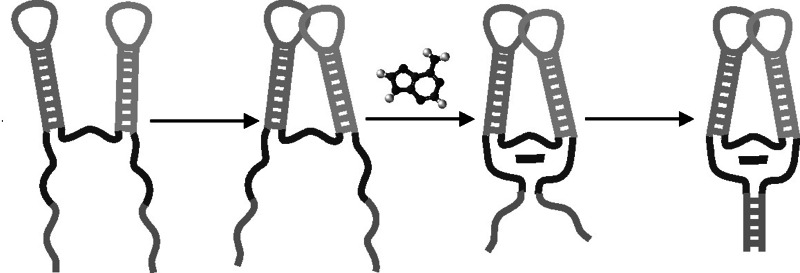
Hypothesis of binding mechanism.
Conclusions
We have performed all-atom MD simulations of the add A-riboswitch to provide an atomistic description of the breaking of the loop–loop interaction in the adenine riboswitch. When studying the opening of the P2 and P3 hairpins, P3 was found to be the more flexible hairpin, while P2 conserves its coaxial arrangement with P1, in partial agreement with a FRET study by Brenner et al. (2010). Two base pairs, G37-C61 and G38-C60, are found to be essential for the formation of tertiary interaction between the loops, which, together with other observations of base pair behavior, is in excellent agreement with FRET and NMR studies. The junction area is partially organized before the kissing loop formation (A23•G46-C53 and A52-U22), and residue A24 has the function to anchor together the P2 and P3 helices.
MATERIALS AND METHODS
Simulated systems
The aptamer domain of the add A-riboswitch has been simulated in Mg2+ ion water solution: (1) in complex with its cognate ligand, adenine; and (2) in the absence of the cognate ligand.
The CHARMM36 (Foloppe and MacKerell 2000; MacKerell and Banavali 2000) parameters, which include an update of the RNA 2′-hydroxyl torsion angle parameters (Denning et al. 2011) were used to describe the riboswitch. As a starting structure, we used the X-ray structure of Serganov et al. (2004) (PDB ID 1Y26). Hydrogen atoms were added using a standard CHARMM procedure (Brünger and Karplus 1988). The riboswitch was set in a rhombic dodecahedron box with an 80-Å face-to-face dimension and was solvated with ∼10,500 TIP3P (Jorgensen et al. 1983) water molecules using a scheme where water molecules with the water oxygen within 2.8 Å of any solute heavy atom were removed. Crystal waters present in the X-ray structure were kept at their respective positions at the start of the simulations. In the system without the bound adenine, the ligand was deleted, and the pocket was filled with water molecules during the solvation step.
The X-ray structure includes five Mg2+ ions. The add A-riboswitch has a total charge of −70, and in order to obtain a zero net charge, cations had to be added to the solution. For the systems in magnesium-water solution, we added 30 additional Mg2+ ions at random positions in the bulk water for a total of 35 ions (corresponding to an ion concentration of 0.18 M). The parameters of the CHARMM36 force field were used for the ions.
The resulting Mg2+ concentration is high compared to physiological concentration. However, this did not severely affect the structure of the riboswitch on the time scales under consideration (Villa et al. 2009), but it can slow the RNA fluctuations (Hayes et al. 2012). Note that NMR experiments showed no structural deformations of the purine riboswitch using Mg2+:RNA ratios as high as 20:1 (Noeske et al. 2007). Under the choice simulation conditions, Mg-water exchange is on the order of milliseconds, and Mg indirect binding to RNA has an average time of 50 psec (Allnér et al. 2012).
Simulation protocols
All MD simulations were carried out using the program CHARMM36 (Brooks et al. 1983, 2009) using periodic boundary conditions. The fast lookup routines for nonbonded interactions (Nilsson 2009) were applied when possible. The SHAKE algorithm (Ryckaert et al. 1977) was used to constrain all bonds involving hydrogen. Newton’s equations of motion were integrated using the leapfrog algorithm with a 2-fsec time step. A 12-Å cutoff was used for particle–particle interactions, and the nonbonded list was constructed using a 16-Å cutoff and was heuristically updated every time an atom moved >2 Å since the last update. The long-range electrostatics were treated with the particle mesh Ewald method (PME) (Darden et al. 1993; Essmann et al. 1995), using a grid of 1 Å and a κ value of 0.34. The simulations were run at constant pressure (1 atm) and temperature (298 K) using a Berendsen thermostat and barostat (Berendsen et al. 1984) with coupling times of 2 psec and 0.5 psec and a compressibility of 4.63 × 10⁻⁵ atm−1 for the barostat.
To avoid RNA structural distortions due to nonoptimal positions of the ions around the RNA, the system was prepared in several steps. First, energy minimizations (150 steepest descents and 150 adopted basis Newton-Raphson steps) and 200 psec of MD were performed with restraints on both RNA and ions. This procedure was then repeated two times, first, with restraints removed on ions and finally, with all restraints removed. An equilibration of 12 nsec unrestrained simulation was run for each of the systems.
Umbrella sampling
The potential of mean force profiles were calculated using umbrella sampling with the harmonic bias potential wi(x) = k(x − xi)2 along a reaction coordinate, x, defined as the distance between the center of mass of backbone atoms of residues 32–38 (L2) and 60–66 (L3) (Fig. 1). The force was applied to the backbone atoms to avoid any unnecessary interference with the interacting bases.
We used a total of 44 simulation windows with the reference value for the bias potential, xi, ranging from 12.5 Å to 34 Å in 0.5 Å intervals. Initial conformations for each window were generated by running 0.25 nsec of MD at each point along the reaction coordinate, with k = 40 kcal/(mol · Å2), using the last structure in each window as the starting structure in the next window.
In the production phase, each window was run for an additional 2.25 nsec with a force constant of k= 20 kcal/(mol · Å2), saving coordinates every 1 psec. The PMF curves were constructed from the resulting distance distributions using the weighted histogram analysis method (Boczko and Brooks 1993) with a tolerance of 10−5 after checking that the 44 sampling distributions overlap. The zero point of the curves has been set to the global minima at ∼13 Å. When the distance between the two mass centers is constrained, free rotation of the solute–solute connecting vector remains possible, and larger volume elements are sampled at larger distances.
Data analyses were performed on the last 1.5 nsec of each window. Error bars were obtained by dividing the trajectory of each window into three parts and calculating the standard deviation between them.
PMF profiles of L2-L3 opening were calculated for two systems: the aptamer domain in Mg2+ ion solution with and without the ligand. Two independent replicas were used to generate PMF curves for each system.
Analyses
The hydrogen bond contacts were calculated using a 2.4-Å distance cutoff (De Loof et al. 1992) between hydrogen atoms and acceptor atoms. No angle criterion was used. A stacking interaction was defined as a distance of <5.6 Å between the center of mass of two bases. The cutoff value was obtained by studying the distance distribution between several types of stacked bases in the equilibrium simulation of the wild-type system. In the secondary structure analysis, we consider that two bases form a pair when at least one of the hydrogen bonds that characterize the base-pair interaction is present.
To analyze the global conformational changes that take place during the opening of the kissing loops of the aptamer domain, the average structure of each PMF simulation window along the reaction coordinate was calculated. We defined three angles: (1) P1-J-L2 by the center of mass of stem P1, of junction J (residues 22–24, 46–53 and 73–74) and L2 loop; (2) P1-J-L3 by the center of mass of stem P1, of the junction J and loop L3; and (3) L2-J-L3 by the center of mass of loop L2, of junction and loop L3. See Figure 1 for a schematic representation of the angle. The angles were calculated for each average structure of each distance window and used to describe the opening of the P2-P3 hairpins.
The solvent-accessible surface area (Lee and Richards 1971) was calculated for the bases of selected residues using a rolling probe with a radius of 1.4 Å on the average structure of the last 1 nsec of each window along the L2-L3 opening reaction coordinate.
ACKNOWLEDGMENTS
This work was supported by the Swedish Research Council.
REFERENCES
- Allnér O, Nilsson L, Villa A 2012. Magnesium ion-water coordination and exchange in biomolecular simulations. J Chem Theory Comput 8: 1493–1502 [DOI] [PubMed] [Google Scholar]
- Barrick JE, Breaker RR 2007. The distributions, mechanisms, and structures of metabolite-binding riboswitches. Genome Biol 8: R239. [DOI] [PMC free article] [PubMed] [Google Scholar]
- Batey RT 2012. Structure and mechanism of purine-binding riboswitches. Q Rev Biophys 45: 345–381 [DOI] [PMC free article] [PubMed] [Google Scholar]
- Batey RT, Gilbert SD, Montange RK 2004. Structure of a natural guanine-responsive riboswitch complexed with the metabolite hypoxanthine. Nature 432: 411–415 [DOI] [PubMed] [Google Scholar]
- Berendsen HJC, Postma JPM, van Gunsteren WF, DiNola A, Haak JR 1984. Molecular dynamics with coupling to an external bath. J Chem Phys 81: 3684–3690 [Google Scholar]
- Blount KF, Wang JX, Lim J, Sudarsan N, Breaker RR 2007. Antibacterial lysine analogs that target lysine riboswitches. Nat Chem Biol 3: 44–49 [DOI] [PubMed] [Google Scholar]
- Boczko EM, Brooks CL 1993. Constant-temperature free-energy surfaces for physical and chemical processes. J Phys Chem 97: 4509–4513 [Google Scholar]
- Breaker RR 2008. Complex riboswitches. Science 319: 1795–1797 [DOI] [PubMed] [Google Scholar]
- Brenner MD, Scanlan MS, Nahas MK, Ha T, Silverman SK 2010. Multivector fluorescence analysis of the xpt guanine riboswitch aptamer domain and the conformational role of guanine. Biochemistry 49: 1596–1605 [DOI] [PMC free article] [PubMed] [Google Scholar]
- Brooks BR, Bruccoleri RE, Olafson BD, States DJ, Swaminathan S, Karplus M 1983. CHARMM: A program for macromolecular energy, minimization, and dynamics calculations. J Comput Chem 4: 187–217 [Google Scholar]
- Brooks BR, Brooks CL, Mackerell AD, Nilsson L, Petrella RJ, Roux B, Won Y, Archontis G, Bartels C, Boresch S, et al. 2009. CHARMM: The biomolecular simulation program. J Comput Chem 30: 1545–1614 [DOI] [PMC free article] [PubMed] [Google Scholar]
- Brünger AT, Karplus M 1988. Polar hydrogen positions in proteins: Empirical energy placement and neutron diffraction comparison. Proteins 4: 148–156 [DOI] [PubMed] [Google Scholar]
- Buck J, Fürtig B, Noeske J, Wöhnert J, Schwalbe H 2007. Time-resolved NMR methods resolving ligand-induced RNA folding at atomic resolution. Proc Natl Acad Sci 104: 15699–15704 [DOI] [PMC free article] [PubMed] [Google Scholar]
- Buck J, Noeske J, Wöhnert J, Schwalbe H 2010. Dissecting the influence of Mg2+ on 3D architecture and ligand-binding of the guanine-sensing riboswitch aptamer domain. Nucleic Acids Res 38: 4143–4153 [DOI] [PMC free article] [PubMed] [Google Scholar]
- Chen AA, Garcia AE 2012. Mechanism of enhanced mechanical stability of a minimal RNA kissing complex elucidated by nonequilibrium molecular dynamics simulations. Proc Natl Acad Sci 109: E1530–E1539 [DOI] [PMC free article] [PubMed] [Google Scholar]
- Dann CE, Wakeman CA, Sieling CL, Baker SC, Irnov I, Winkler WC 2007. Structure and mechanism of a metal-sensing regulatory RNA. Cell 130: 878–892 [DOI] [PubMed] [Google Scholar]
- Darden T, York D, Pedersen L 1993. Particle mesh Ewald: An N·Log(N) method for Ewald sums in large systems. J Chem Phys 98: 10089–10092 [Google Scholar]
- De Loof H, Nilsson L, Rigler R 1992. Molecular dynamics simulation of galanin in aqueous and nonaqueous solution. J Am Chem Soc 114: 4028–4035 [Google Scholar]
- Denning EJ, Priyakumar UD, Nilsson L, Mackerell AD 2011. Impact of 2′-hydroxyl sampling on the conformational properties of RNA: Update of the CHARMM all-atom additive force field for RNA. J Comput Chem 32: 1929–1943 [DOI] [PMC free article] [PubMed] [Google Scholar]
- Edwards TE, Klein DJ, Ferre-D’Amare AR 2007. Riboswitches: Small-molecule recognition by gene regulatory RNAs. Curr Opin Struct Biol 17: 273–279 [DOI] [PubMed] [Google Scholar]
- Eskandari S, Prychyna O, Leung J, Avdic D, O’Neill MA 2007. Ligand-directed dynamics of adenine riboswitch conformers. J Am Chem Soc 129: 11308–11309 [DOI] [PubMed] [Google Scholar]
- Essmann U, Perera L, Berkowitz ML, Darden T, Lee H, Pedersen LG 1995. A smooth particle mesh Ewald method. J Chem Phys 103: 8577–8593 [Google Scholar]
- Foloppe N, MacKerell AD 2000. All-atom empirical force field for nucleic acids: I. Parameter optimization based on small molecule and condensed phase macromolecular target data. J Comput Chem 21: 86–104 [Google Scholar]
- Garst AD, Edwards AL, Batey RT 2011. Riboswitches: Structures and mechanisms. Cold Spring Harb Perspect Biol 3: a003533. [DOI] [PMC free article] [PubMed] [Google Scholar]
- Gilbert SD, Reyes FE, Edwards AL, Batey RT 2009. Adaptive ligand binding by the purine riboswitch in the recognition of guanine and adenine analogs. Structure 17: 857–868 [DOI] [PMC free article] [PubMed] [Google Scholar]
- Greenleaf WJ, Frieda KL, Foster DAN, Woodside MT, Block SM 2008. Direct observation of hierarchical folding in single riboswitch aptamers. Science 319: 630–633 [DOI] [PMC free article] [PubMed] [Google Scholar]
- Hayes RL, Noel JK, Mohanty U, Whitford PC, Hennelly SP, Onuchic JN, Sanbonmatsu KY 2012. Magnesium fluctuations modulate RNA dynamics in the SAM-I riboswitch. J Am Chem Soc 134: 12043–12053 [DOI] [PMC free article] [PubMed] [Google Scholar]
- Jain N, Zhao L, Liu JD, Xia TB 2010. Heterogeneity and dynamics of the ligand recognition mode in purine-sensing riboswitches. Biochemistry 49: 3703–3714 [DOI] [PubMed] [Google Scholar]
- Jorgensen WL, Chandrasekhar J, Madura J, Impey RW, Klein ML 1983. Comparison of simple potential functions for simulating liquid water. J Chem Phys 79: 926–935 [Google Scholar]
- Lee B, Richards FM 1971. The interpretation of protein structures: Estimation of static accessibility. J Mol Biol 55: 379–400 [DOI] [PubMed] [Google Scholar]
- Lee ER, Blount KF, Breaker RR 2009. Roseoflavin is a natural antibacterial compound that binds to FMN riboswitches and regulates gene expression. RNA Biol 6: 187–194 [DOI] [PMC free article] [PubMed] [Google Scholar]
- Lee MK, Gal M, Frydman L, Varani G 2010. Real-time multidimensional NMR follows RNA folding with second resolution. Proc Natl Acad Sci 107: 9192–9197 [DOI] [PMC free article] [PubMed] [Google Scholar]
- Lemay JF, Lafontaine DA 2007. Core requirements of the adenine riboswitch aptamer for ligand binding. RNA 13: 339–350 [DOI] [PMC free article] [PubMed] [Google Scholar]
- Lemay JF, Penedo JC, Tremblay R, Lilley DMJ, Lafontaine DA 2006. Folding of the adenine riboswitch. Chem Biol 13: 857–868 [DOI] [PubMed] [Google Scholar]
- Lin JC, Thirumalai D 2008. Relative stability of helices determines the folding landscape of adenine riboswitch aptamers. J Am Chem Soc 130: 14080–14081 [DOI] [PubMed] [Google Scholar]
- MacKerell AD, Banavali NK 2000. All-atom empirical force field for nucleic acids: II. Application to molecular dynamics simulations of DNA and RNA in solution. J Comput Chem 21: 105–120 [Google Scholar]
- Mandal M, Breaker RR 2004. Adenine riboswitches and gene activation by disruption of a transcription terminator. Nat Struct Mol Biol 11: 29–35 [DOI] [PubMed] [Google Scholar]
- Mandal M, Boese B, Barrick JE, Winkler WC, Breaker RR 2003. Riboswitches control fundamental biochemical pathways in Bacillus subtilis and other bacteria. Cell 113: 577–586 [DOI] [PubMed] [Google Scholar]
- Mandal M, Lee M, Barrick JE, Weinberg Z, Emilsson GM, Ruzzo WL, Breaker RR 2004. A glycine-dependent riboswitch that uses cooperative binding to control gene expression. Science 306: 275–279 [DOI] [PubMed] [Google Scholar]
- Mulhbacher J, Lafontaine DA 2007. Ligand recognition determinants of guanine riboswitches. Nucleic Acids Res 35: 5568–5580 [DOI] [PMC free article] [PubMed] [Google Scholar]
- Neupane K, Yu H, Foster DAN, Wang F, Woodside MT 2011. Single-molecule force spectroscopy of the add adenine riboswitch relates folding to regulatory mechanism. Nucleic Acids Res 39: 7677–7687 [DOI] [PMC free article] [PubMed] [Google Scholar]
- Nilsson L 2009. Efficient table lookup without inverse square roots for calculation of pair wise atomic interactions in classical simulations. J Comput Chem 30: 1490–1498 [DOI] [PubMed] [Google Scholar]
- Noeske J, Richter C, Grundl MA, Nasiri HR, Schwalbe H, Wöhnert J 2005. An intermolecular base triple as the basis of ligand specificity and affinity in the guanine- and adenine-sensing riboswitch RNAs. Proc Natl Acad Sci 102: 1372–1377 [DOI] [PMC free article] [PubMed] [Google Scholar]
- Noeske J, Schwalbe H, Wöhnert J 2007. Metal-ion binding and metal-ion induced folding of the adenine-sensing riboswitch aptamer domain. Nucleic Acids Res 35: 5262–5273 [DOI] [PMC free article] [PubMed] [Google Scholar]
- Norberg J, Nilsson L 1995. Stacking free-energy profiles for all 16 natural ribodinucleoside monophosphates in aqueous solution. J Am Chem Soc 117: 10832–10840 [Google Scholar]
- Nudler E, Mironov AS 2004. The riboswitch control of bacterial metabolism. Trends Biochem Sci 29: 11–17 [DOI] [PubMed] [Google Scholar]
- Ottink OM, Rampersad SM, Tessari M, Zaman GJR, Heus HA, Wijmenga SS 2007. Ligand-induced folding of the guanine-sensing riboswitch is controlled by a combined predetermined-induced fit mechanism. RNA 13: 2202–2212 [DOI] [PMC free article] [PubMed] [Google Scholar]
- Priyakumar UD, MacKerell AD 2010. Role of the adenine ligand on the stabilization of the secondary and tertiary interactions in the adenine riboswitch. J Mol Biol 396: 1422–1438 [DOI] [PMC free article] [PubMed] [Google Scholar]
- Rieder R, Lang K, Graber D, Micura R 2007. Ligand-induced folding of the adenosine deaminase A-riboswitch and implications on riboswitch translational control. Chembiochem 8: 896–902 [DOI] [PubMed] [Google Scholar]
- Ryckaert J-P, Ciccotti G, Berendsen HJC 1977. Numerical integration of the Cartesian equations of motion of a system with constraints: Molecular dynamics of n-alkanes. J Comp Phys 23: 327–341 [Google Scholar]
- Salim N, Lamichhane R, Zhao R, Banerjee T, Philip J, Rueda D, Feig AL 2012. Thermodynamic and kinetic analysis of an RNA kissing interaction and its resolution into an extended duplex. Biophys J 102: 1097–1107 [DOI] [PMC free article] [PubMed] [Google Scholar]
- Serganov A, Patel DJ 2012. Metabolite recognition principles and molecular mechanisms underlying riboswitch function. Annu Rev Biophys 41: 343–370 [DOI] [PMC free article] [PubMed] [Google Scholar]
- Serganov A, Yuan YR, Pikovskaya O, Polonskaia A, Malinina L, Phan AT, Hobartner C, Micura R, Breaker RR, Patel DJ 2004. Structural basis for discriminative regulation of gene expression by adenine- and guanine-sensing mRNAs. Chem Biol 11: 1729–1741 [DOI] [PMC free article] [PubMed] [Google Scholar]
- Sharma M, Bulusu G, Mitra A 2009. MD simulations of ligand-bound and ligand-free aptamer: Molecular level insights into the binding and switching mechanism of the add A-riboswitch. RNA 15: 1673–1692 [DOI] [PMC free article] [PubMed] [Google Scholar]
- Sudarsan N, Cohen-Chalamish S, Nakamura S, Emilsson GM, Breaker RR 2005. Thiamine pyrophosphate riboswitches are targets for the antimicrobial compound pyrithiamine. Chem Biol 12: 1325–1335 [DOI] [PubMed] [Google Scholar]
- Thore S, Leibundgut M, Ban NN 2006. Structure of the eukaryotic thiamine pyrophosphate riboswitch with its regulatory ligand. Science 312: 1208–1211 [DOI] [PubMed] [Google Scholar]
- Villa A, Wöhnert J, Stock G 2009. Molecular dynamics simulation study of the binding of purine bases to the aptamer domain of the guanine sensing riboswitch. Nucleic Acids Res 37: 4774–4786 [DOI] [PMC free article] [PubMed] [Google Scholar]
- Winkler WC, Breaker RR 2005. Regulation of bacterial gene expression by riboswitches. Annu Rev Microbiol 59: 487–517 [DOI] [PubMed] [Google Scholar]