

Abstract
Context
The botanical product silymarin, an extract of milk thistle, is commonly used by patients to treat chronic liver disease, despite scant and conflicting evidence of its efficacy.
Objective
To determine the effect of silymarin on liver disease activity in patients with chronic hepatitis C virus (HCV) infection unsuccessfully treated with interferon-based therapy.
Design, Setting, and Participants
Multicenter, double-blind, placebo-controlled trial conducted at 4 medical centers in the United States. Participants included 154 persons with chronic HCV infection and serum alanine aminotransferase (ALT) levels of 65 U/L or greater who were previously unsuccessfully treated with interferon-based therapy. Enrollment began in May 2008 and was completed in May 2010, with the last follow-up visit completed in March 2011.
Intervention
Participants were randomly assigned to receive 420-mg silymarin, 700-mg silymarin, or matching placebo administered 3 times per day for 24 weeks.
Main Outcome Measures
The primary outcome measure was serum ALT level of 45 U/L or less (considered within the normal range) or less than 65 U/L, provided this was at least a 50% decline from baseline values. Secondary outcomes included changes in ALT levels, HCV RNA levels, and quality-of-life measures.
Results
After 24 weeks of treatment, only 2 participants in each treatment group (P≥.99) met the primary outcome measure (3.8% [95% CI, 0.5% to 13.2%] for placebo, 4.0% [95% CI, 0.5% to 13.7%] for 420-mg silymarin, and 3.8% [95% CI, 0.5% to 13.2%] for 700-mg silymarin). The mean decline in serum ALT activity at the end of treatment did not differ significantly (P=.75) across the 3 treatment groups (mean decline, −4.3 [95% CI, −17.3 to 8.7] U/L for placebo, −14.4 [95% CI, −41.6 to 12.7] U/L for 420-mg silymarin, −11.3 [95% CI, −27.9 to 5.4] U/L for 700-mg silymarin); there likewise were no significant differences in HCV RNA levels (mean change, 0.07 [95% CI, −0.05 to 0.18] log10 IU/mL for placebo, −0.03 [95% CI, −0.18 to 0.12] log10 IU/mL for 420-mg silymarin, 0.04 [95% CI, −0.08 to 0.16] log10 IU/mL for 700-mg silymarin; P=.54) or quality-of-life measures. The adverse event profile of silymarin was comparable with that of placebo.
Conclusion
Higher than customary doses of silymarin did not significantly reduce serum ALT levels more than placebo in participants with chronic HCV infection unsuccessfully treated with interferon-based therapy.
CHRONIC HEPATITIS C VIRUS (HCV) infection affects almost 3% of the global population and may lead to cirrhosis, hepatic failure, and hepatocellular carcinoma.1 Sustained virological response can be achieved in patients treated with peginterferon and ribavirin, often combined with an HCV protease inhibitor.2–4 Nevertheless, a large proportion of patients do not respond to these therapies, and many others cannot be treated because of medical comorbidities.5 Thus, alternative medications with disease-modifying activity may be of benefit.
Silymarin (Silybum marianum), an extract of milk thistle, is the botanical treatment most commonly used for liver disorders in the United States, owing to its purported hepatoprotective properties.6,7 Indeed, 33% of patients with chronic HCV infection and cirrhosis reported current or past use of silymarin for the treatment of their disease.8 Silymarin has been demonstrated to have anti-inflammatory and immunomodulatory properties via inhibition of NF-κB (nuclear factor κ-light-chain-enhancer of activated B cells), as demonstrated in vitro.9,10 Studies of silymarin in the HCV replicon system also suggest an effect on HCV core and NS5A expression, although at high concentrations.11 These same pathways, implicated in the pathogenesis of chronic liver disease, provide the rationale to investigate silymarin as a potential treatment for chronic HCV infection.
Clinical studies that have evaluated milk thistle for a variety of liver diseases have yielded inconsistent results and were compromised by lack of well-defined efficacy end points, heterogeneous populations of patients with liver disease, and use of nonstandardized silymarin preparations.12–16 In view of the limited data available on dosing and pharmacokinetics of silymarin, an initial dose-ranging study was performed to identify silymarin doses for further study in the current trial.17 Two doses, 3 and 5 times higher than the customary dose, were selected based on this early testing. The aim of the present study was to assess the safety and efficacy of silymarin for treating chronic HCV infection among patients previously unsuccessfully treated with conventional interferon (IFN)–based treatment.
METHODS
Trial Design
The Silymarin in NASH and C Hepatitis (SyNCH) study was a randomized, double-blind, placebo-controlled multicenter trial of 2 doses of silymarin and placebo with 1:1:1 allocation into the 3 treatment groups. Enrollment began in May 2008 and was completed in May 2010. Follow-up was completed by March 2011.18
Participants
Adult patients with chronic HCV infection were eligible for the trial if they had received previous IFN-based therapy without sustained virological response, had quantifiable serum HCV RNA levels, and had an alanine aminotransferase (ALT) level of 65 U/L or greater at screening. Patients were excluded if they had evidence of decompensated hepatic cirrhosis, a positive HIV antibody test result or positive result for HBsAg (surface antigen of the hepatitis B virus), or had used milk thistle products within the previous 30 days. Liver biopsy was not required for entry, although if obtained, the presence of moderate steatosis or steato-hepatitis were considered exclusions.
Participants were recruited at 4 clinical centers in the United States (Beth Israel Deaconess Medical Center, Boston, Massachusetts; Thomas Jefferson University, Philadelphia, Pennsylvania; University of North Carolina, Chapel Hill; University of Pennsylvania, Philadelphia). The study was approved by the institutional review boards at these centers and the data coordinating center, and all participants provided written informed consent. An independent data and safety monitoring board established by the National Institutes of Health approved the protocol and regularly reviewed study progress.
Interventions
Participants were randomly assigned to 1 of 3 groups: 420-mg silymarin, 700-mg silymarin, or matching placebo gelatin capsules administered 3 times daily for 24 weeks, a standard duration of treatment for which effective therapies for HCV have regularly demonstrated improvement in disease activity.5,18,19 The botanical product used in the trial is a dry extract of milk thistle fruits (S marianum), marketed as Legalon 140 (Rottapharm | Madaus) (eAppendix, available at http://www.jama.com). This standardized silymarin product is approved as a prescription drug in several countries of Europe and Asia as a treatment for hepatic disorders. The placebo gelatin capsules consisted of lactose and other Legalon 140 components that included mannitol, magnesium stearate, and sodium carboxymethyl starch. The study was double blinded so that patients took 5 capsules 3 times daily, which consisted of either 5 capsules of silymarin (700 mg), 3 capsules of silymarin and 2 of placebo (420 mg), or 5 capsules of placebo, provided in a sealed, labeled cup. Medication was dispensed in the sealed cups, and each cup represented 1 dose.
Outcomes
The primary outcome measure for efficacy was serum ALT level of 45 U/L or less (approximate normal range) or attainment of at least 50% decline of serum ALT level to less than 65 U/L (approximately 1.5 times the upper limit of normal) after the 24-week treatment period. The change in serum ALT level was chosen as the primary outcome in this study as a practical measure that has been correlated with improvement in hepatic necroinflammatory activity during studies of interferon for HCV infection.18–22 Secondary outcomes included change in serum ALT and serum HCV RNA levels during treatment. Adherence to study medication was assessed by dose counts.
Adverse events were prospectively monitored, as were blood counts and results of chemistry and coagulation tests. The Short-Form 36 and the Chronic Liver Disease Questionnaire were used to measure generic and liver-disease related quality of life, respectively.23,24 The Center for Epidemiologic Studies–Depression scale measured depressive symptomatology.25 These instruments were completed by participants before, during, and at the end of treatment. HCV RNA levels were measured by reverse transcription polymerase chain reaction (Abbott RealTime HCV assay, Abbott Molecular Inc). Plasma specimens for measurement of levels of silymarin flavonolignans, predominantly silybin A, were collected during the trial and quantified by liquid chromatography electron spray ionization mass spectrometry as previously described.17 Silybin A is the major silymarin flavonolignan detected in blood.
Participants were seen at baseline and for 6 follow-up visits scheduled 2 to 8 weeks apart throughout the 24-week treatment period, and at 4 and 12 weeks after treatment, to assess safety and efficacy.
Sample Size
In the absence of silymarin, it was anticipated that 15% of participants in the placebo group would reach the primary outcome measure during a 24-week period. A clinically significant difference was considered to be 25%, ie, that 40% of those receiving silymarin met the primary end point. These estimates were based on early studies conducted among patients with HCV infection treated with interferon, placebo, or in observational control groups and on the clinical experience of the investigators to account for the composite end point.19 Assuming no dose-response relationship and 40% success in each silymarin treatment group, enrolling 153 patients (51 per group) would provide 80% power to reject the null hypothesis at α=.05 using a χ2 test. If there was a dose-response relationship, there would be greater power.
Randomization and Masking
Eligible participants were allocated to treatment group using an adaptive minimization randomization scheme stratified by site and history of previous use of any milk thistle preparations, using a web-based system created by the data coordinating center that allocated treatment to minimize the imbalance in treatment allocation. The randomization algorithm ensured that the treatment groups were imbalanced by no more than 4 participants overall, by no more than 3 participants within each site, and by no more than 2 participants within each stratum within each site, in that order. All clinical center personnel and participants were masked to treatment assignment and the parameters of the allocation scheme.
Statistical Methods
The analysis of the primary outcome measure was an intention-to-treat analysis including all allocated participants. Preplanned secondary outcomes included changes in ALT and serum HCV RNA levels, as well as quality-of-life and depression measures. Adherence to study medication was measured using a summary of missed- dose information obtained from dose counts and calculated as a percentage of the medication dose cups dispensed to participants compared with cups returned by participants at follow-up visits.
Baseline characteristics were summarized using frequencies and proportions for categorical variables (eg, race, sex) and median and quartiles for continuous variables (eg, age, baseline ALT levels). Because race and ethnicity have been shown to be associated with response to IFN-based therapies,26 these data were collected using a self-report, fixed-category questionnaire to evaluate their influence on the primary end point. Categorical variables across treatment groups, including the primary outcome, were compared using Pearson χ2 test or its exact version when appropriate. The Kruskal-Wallis (non-parametric analysis of variance) test was used to compare distributions of continuous measures across treatment groups.
The primary outcome was summarized using percentages and 95% CIs. Secondary outcomes (changes) were summarized using means and 95% CIs and compared across treatment groups using the F test from the general linear model, with treatment as the only explanatory factor in the model. Repeated ALT measures were analyzed by linear mixed models with an autoregressive correlation structure, using ALT levels as the dependent variable and treatment, time point, and treatment×time-point interaction as the independent variables. The significance of the changes in ALT levels over time was assessed using a likelihood ratio test of the interaction term.
The proportions of participants with serious adverse events between the treatment (either silymarin dose) and placebo groups were compared using the Fisher exact test. In all analyses, P=.05 was used as a cutoff for statistical significance. All null hypotheses were tested against nondirectional alternatives.
Missing data for the primary end point and for the secondary end point of changes in ALT level were handled using the last observation carried forward imputation method per the external data and safety monitoring board. Analysis of the primary hypothesis was also performed using multiple imputations. Twenty imputed data sets were created using a Markov chain Monte Carlo algorithm based on the observed ALT values at previous time points. For each of these imputed data sets, the primary end point was calculated and the analysis was repeated. All analyses were performed using SAS version 9.2 (SAS Institute Inc).
RESULTS
Of the 234 patients screened, 154 were randomly allocated to receive treatment. The most frequent reason for ineligibility was serum ALT activity less than 65 U/L (Figure 1). Among those enrolled, 86 (56%) had never used a milk thistle preparation (Figure 1).
Figure 1.
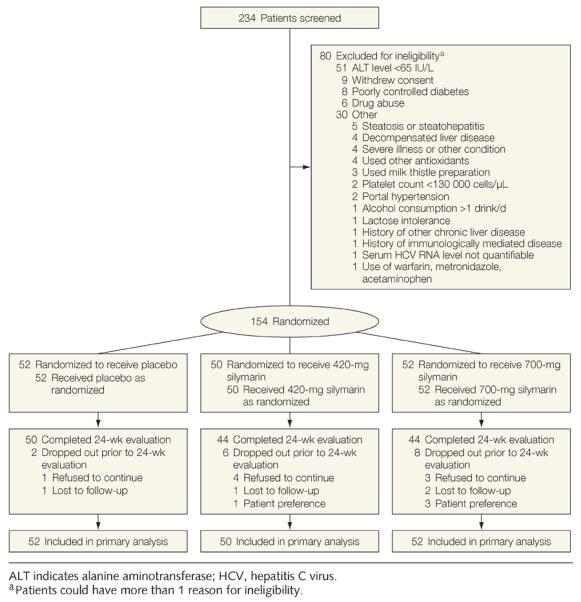
Study Flow
Participants in the 3 treatment groups were similar with respect to baseline characteristics, with the exception that the placebo group included a higher percentage of white participants (Table 1). Most participants were men (71%); the median age was 54 years, and the median body mass index was 29.2 (calculated as weight in kilograms divided by height in meters squared). The majority of patients had HCV genotype 1 infection (91%). The median HCV RNA level was 6.2 log10 IU/L and was similar in the 3 treatment groups. Serum ALT levels did not differ significantly (median, 106 U/L for placebo; 110 U/L for 420-mg silymarin; and 105 U/L for 700-mg silymarin; P=.90) across treatment groups. Markers suggestive of advanced liver disease (serum bilirubin levels, albumin levels, platelet counts) did not differ significantly across treatment groups.
Table 1.
Baseline Characteristics of Study Participants
| Silymarin |
|||||
|---|---|---|---|---|---|
| Characteristics | All (N = 154) | Placebo (n = 52) | 420 mg (n = 50) | 700 mg (n = 52) | P Valuea |
| Age, median (IQR), y | 54.0 (51.0–58.0) | 56.0 (51.5–59.5) | 54.0 (52.0–57.0) | 54.0 (48.0–58.0) | .31 |
|
| |||||
| Men, No. (%) | 110 (71.4) | 41 (78.9) | 34 (68.0) | 35 (67.3) | .35 |
|
| |||||
| Race/ethnicity, No. (%)b | |||||
| White | 114 (75.0) | 45 (88.2) | 36 (72.0) | 33 (64.7) | .08 |
|
| |||||
| Black | 31 (20.4) | 5 (9.8) | 11 (22.0) | 15 (29.4) | |
|
| |||||
| Other | 7 (4.6) | 1 (2.0) | 3 (6.0) | 3 (5.9) | |
|
| |||||
| Hispanic | 8 (5.2) | 3 (5.8) | 3 (6.0) | 2 (3.9) | .91c |
|
| |||||
| Body mass index, median (IQR)d | 29.2 (26.5–32.7)e | 29.1 (25.6–32.7)e | 28.5 (26.0–32.4) | 30.2 (28.1–32.9) | .29 |
|
| |||||
| History of diabetes, No. (%) | 21 (13.6) | 8 (15.4) | 6 (12.0) | 7 (13.5) | .88 |
|
| |||||
| History of any milk thistle preparation use, No. (%) | 68 | 24 (46.2) | 22 (44.0) | 22 (42.3) | .92 |
|
| |||||
| HCV genotype, No. (%) | |||||
| 1 | 139 (91.5) | 44 (88.0) | 47 (94.0) | 48 (92.3) | .59c |
|
| |||||
| 2, 3, or 4 | 13 (8.5) | 6 (12.0) | 3 (6.0) | 4 (7.7) | |
|
| |||||
| HCV RNA, median (IQR), log10 IU/L | 6.2 (5.8–6.6)e | 6.4 (5.9–6.7) | 6.1 (5.7–6.5) | 6.3 (5.8–6.6)e | .18 |
|
| |||||
| Albumin, median (IQR), g/dL | 4.2 (3.9–4.4)e | 4.3 (3.9–4.5)e | 4.1 (3.9–4.4) | 4.1 (4.0–4.4) | .37 |
|
| |||||
| ALT, median (IQR), U/L | 107.0 (83.0–150.0) | 106.0 (83.0–136.0) | 109.5 (83.0–158.0) | 104.5 (83.5–151.0) | .9 |
|
| |||||
| Creatinine, median (IQR), mg/dL | 0.8 (0.7–1.0) | 0.9 (0.7–1.0) | 0.8 (0.7–1.0) | 0.8 (0.8–1.0) | .75 |
|
| |||||
| Fasting glucose, median (IQR), mg/dL | 93.0 (83.0–105.0)f | 91.5 (80.0–106.0)g | 93.0 (83.0–103.0)h | 93.0 (83.0–113.0)h | .75 |
|
| |||||
| Hemoglobin, median (IQR), g/dL | 15.0 (14.2–15.8) | 15.2 (14.2–15.9) | 15.0 (14.1–15.6) | 15.0 (14.2–15.9) | .72 |
|
| |||||
| Platelets, median (IQR), ×103 cells/μL | 177.0 (133.0–217.0) | 180.0 (138.5–228.0) | 173.0 (132.0–227.0) | 177.0 (134.0–206.5) | .98 |
|
| |||||
| Total bilirubin, median (IQR), mg/dL | 0.8 (0.6–1.0) | 0.9 (0.6–1.1) | 0.8 (0.6–1.0) | 0.8 (0.6–1.0) | .85 |
|
| |||||
| White blood cells, median (IQR), cells/μL | 5700 (4700–6900) | 5800 (4900–6900) | 5500 (4600–6500) | 5600 (4900–7100) | .47 |
|
| |||||
| SF-36 score, median (IQR)i | |||||
| Physical health composite | 51.0 (43.0–55.0)e | 51.0 (43.0–53.5) | 52.0 (45.0–56.0)e | 48.5 (42.0–54.0) | .13 |
|
| |||||
| Mental health composite | 54.0 (47.0–57.0)e | 54.0 (47.55–8.0) | 53.0 (47.0–57.0)e | 54.0 (45.0–57.0) | .74 |
|
| |||||
| CLDQ score, median (IQR)i | 5.8 (5.1–6.3)e | 5.8 (5.1–6.3) | 6.0 (5.4–6.4)e | 5.7 (4.8–6.3) | .25 |
|
| |||||
| CES-D score, median (IQR)i | 8.0 (3.0–14.0)e | 7.5 (3.0–14.0) | 8 (3–13.7) | 8.5 (5.0–16.0)e | .68 |
Abbreviations: ALT, alanine aminotransferase; CES-D, Center for Epidemiologic Studies–Depression Scale; CLDQ, Chronic Liver Disease Questionnaire; HCV, hepatitis C virus; IQR, interquartile range; SF-36, Short-Form 36.
SI conversion factors; To convert ALT values to μkat/L, multiply by 0.0167; creatinine values to μmol/L, multiply by 88.4; glucose values to mmol/L, multiply by 0.0555.
P values are for testing equality across all 3 groups: Kruskal-Wallis test for continuous data (presented by median and IQR) and Pearson χ2 test for categorical data (presented by No. [%]) except otherwise indicated.
Data missing for 2 participants.
By exact Pearson χ2 test.
Calculated as weight in kilograms divided by height in meters squared.
One patient missing data.
Twelve patients missing data.
Six patients missing data.
Three patients missing data.
SF-36 summary scores for the physical health composite range from 8 to 73 and for the mental health composite range from 10 to 74. CLDQ scores range from 1 (most impairment) to 7 (least impairment). CES-D total scores range from 0 to 60, with higher scores indicative of more severe depressive symptoms.
At the end of treatment, 5 participants achieved serum ALT activity less than 45 U/L; 1 in the placebo group (1.9% [95% CI, 0.1% to 10.3%] and 2 each in the 420-mg silymarin (4.0% [95% CI, 0.5% to 13.7%]) and 700-mg silymarin (3.8% [95% CI, 0.5% to 13.2%]) groups (P=.80) (Table 2). One other participant treated with placebo had a decrease of serum ALT levels to less than 65 U/L, which reflected a decrease of 57% from baseline. Thus, 2 participants in each treatment group achieved the prespecified primary end point (P>.99). The percentages of participants who achieved the primary end point were 3.8% (95% CI, 0.5% to 13.2%) in the placebo group, 4.0% (95% CI, 0.5% to 13.7%) in the 420-mg silymarin group, and 3.8% (95% CI, 0.5% to 13.2%) in the 700-mg silymarin group.
Table 2.
Analysis of Primary and Secondary Outcome Measures
| Silymarin |
||||
|---|---|---|---|---|
| Variable | Placebo (n = 52) | 420 mg (n = 50) | 700 mg (n = 52) | P Value |
| Primary end point, No. (%) [95% CI] | ||||
| ALT ≤45 U/L at treatment wk 24a | 1 (1.9) [0.1 to 10.3] | 2 (4.0) [0.5 to 13.7] | 2 (3.8) [0.5 to 13.2] | .80b |
|
| ||||
| At least 50% ALT decline from baseline to wk 24 and ALT <65 U/L at treatment wk 24a,c | 2 (3.8) [0.5 to 13.2] | 1 (2.0) [0.1 to 10.7] | 2 (3.8) [0.5 to 13.2] | .83b |
|
| ||||
| Either treatment response | 2 (3.8) [0.5 to 13.2] | 2 (4.0) [0.5 to 13.7] | 2 (3.8) [0.5 to 13.2] | >.99b |
|
| ||||
| Secondary end points, mean (95% CI) d | ||||
| Change in ALT, U/L | −4.3 (−17.3 to 8.7) | −14.4 (−41.6 to 12.7) | −11.3 (−27.9 to 5.4) | .75e |
|
| ||||
| Change in HCV RNA, mean, log10 IU/L | 0.07 (−0.05 to 0.18)f | −0.03 (−0.18 to 0.12)g | 0.04 (−0.08 to 0.16)h | 0.54e |
|
| ||||
| Quality of lifei | ||||
| SF-36 | ||||
| Aggregate physical | −0.69 (−2.78 to 1.39)j | −2.86 (−5.06 to −0.66)k | −0.27 (−2.24 to 1.69)l | .18e |
|
| ||||
| Aggregate mental | 0.24 (−1.74 to 2.23)j | 0.35 (−2.10 to 2.80)k | −0.90 (−3.35 to 1.53)l | .68e |
|
| ||||
| CLDQ | 0.12 (−0.03 to 0.28)m | −0.10 (−0.32 to 0.12)k | −0.03 (−0.26 to 0.20)l | .26e |
|
| ||||
| CES-D | −0.26 (−1.79 to 1.27)m | −0.73 (−2.98 to 1.51)k | −0.41 (−4.22 to 3.39)l | .97e |
Abbreviations: ALT, alanine aminotransferase; CES-D, Center for Epidemiologic Studies–Depression; CLDQ, Chronic Liver Disease Questionnaire; HCV, hepatitis C virus; SF-36, Short-Form 36.
SI conversion factor: To convert ALT values to to μkat/L, multiply by 0.0167.
Last ALT value prior to dropout was used in subsequent calculations for patients who dropped out (n = 16) prior to week 24 of treatment.
By exact χ2 test for testing the proportions across treatment groups.
One patient's ALT level was not measured at baseline; the last screening value was used in the calculation.
Change is calculated as week 24 value minus the baseline value; therefore, a negative value will indicate a decline. A negative change in ALT level, HCV RNA level, and CES-D score, and a positive change in SF-36 and CLDQ scores, indicates improvement from baseline.
F test from general linear model was used to test the equality of mean changes across treatment groups.
Four patients missing the corresponding outcome measure.
Six patients missing the corresponding outcome measure.
Ten patients missing the corresponding outcome measure.
SF-36 scores range from 0–100 (higher scores indicate better functioning; US population has a score of 50). CLDQ scores range from 1 (most impairment) to 7 (least impairment). CES-D total scores range from 0 to 60, with higher scores indicative of more severe depressive symptoms.
Three patients missing the corresponding outcome measure.
Seven patients missing the corresponding outcome measure.
Eight patients patients missing the corresponding outcome measure.
Two patients missing the corresponding outcome measure.
When the multiple imputations method was used to handle missing data,27 the estimated 4.6%, 4.3%, and 3.8% of participants achieving the primary end point in the placebo, 420-mg silymarin, and 700-mg silymarin groups, respectively (P=.89), were similar compared with the estimates obtained using the last observation carried forward method, again indicating that there was not a significant difference in the response across the 3 treatment groups.
Furthermore, there was no statistically significant difference across treatment groups (P=.75) when changes in serum ALT levels from baseline to end of treatment were analyzed as a continuous variable (mean decline, −4.3 [95% CI, −17.3 to 8.7] U/L for placebo, −14.4 [95% CI, −41.6 to 12.7] U/L for 420-mg silymarin, and −11.3 [95% CI, −27.9 to 5.4] U/L for 700-mg silymarin). Mean ALT levels are shown by treatment group for all participants in an intention-to-treat analysis (Figure 2).
Figure 2.
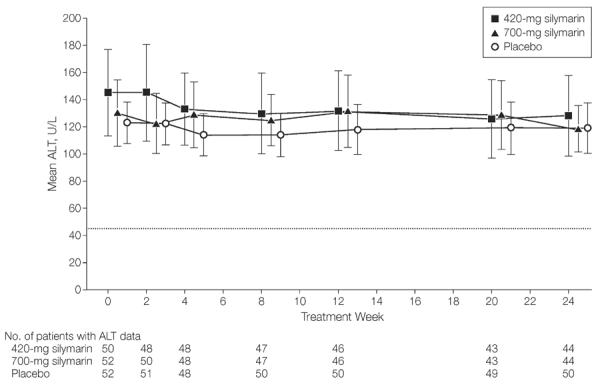
Mean ALT Levels Across Time by Treatment Group for All Participants
Means estimated by fitting a linear mixed model with alanine aminotransferase (ALT) as outcome and treatment group and time point (treated as categorical) and their interaction as covariates. Dotted line at y=45 U/L indicates the ALT value considered the upper limit of normal for this study. Time axis has been shifted slightly to the right by 0.3 units for 420-mg silymarin and 0.6 units for 700-mg silymarin to separate the error bars. Error bars indicate 95% CIs.
The change in serum ALT levels did not differ significantly across treatment groups in either stratum defined by the presence (mean decline, −5.9 [95% CI, −20.9 to 9.0] U/L for placebo, −16.6 [95% CI, −38.3 to 5.2] U/L for 420-mg silymarin, and −10.5 (95% CI, −32.1 to 11.1] U/L for 700-mg silymarin) or absence (mean decline, −2.9 [95% CI, −24.3 to 18.6] U/L for placebo, −12.8 [95% CI, −59.8 to 34.2] U/L for 420-mg silymarin, and −11.8 [95% CI, −37.0 to 13.4] U/L for 700-mg silymarin) of previous milk thistle use.
Mean serum HCV RNA levels did not change significantly during the 24 weeks of therapy (mean change, 0.07 [95% CI, −0.05 to 0.18)] log10 IU/L for placebo, −0.03 [95% CI, −0.18 to 0.12] log10 IU/L for 420-mg silymarin, and 0.04 [95% CI, −0.08 to 0.16] log10 IU/L for 700-mg silymarin; P=.54) (Table 2). Similarly, restricting the analysis to patients from whom all data were available throughout the treatment phase showed no differences between the 3 treatment groups. Analysis of the continuum of HCV RNA levels from baseline to end of treatment did not demonstrate a statistically significant difference.
Adherence was maintained throughout the study, with 95% of participants meeting or exceeding an 80% threshold for adherence (91.8% for placebo, 95.2% for 420-mg silymarin, and 93.0% for 700-mg silymarin). Analysis of serum ALT activity performed in a per-protocol analysis (125 participants with >80% adherence) did not demonstrate significant changes in serum ALT activity by week 24 of treatment (mean change, −8.3 [95% CI, −22.3 to 5.8] U/L for placebo, −17.6 [95% CI, −51.4 to 16.2] U/L for 420-mg silymarin, and −3.7 [95% CI, −17.0 to 9.6] U/L for 700-mg silymarin; P=.66).
Silybin A plasma concentrations in participants who completed the study, drawn randomly at visits after a recorded dose, were observed in the range of 2.1 to 2048 ng/mL. All samples from placebo recipients had no detectable silybin A concentrations. The median and highest steady-state silybin A concentrations observed were 2-fold greater in the higher-dose group compared with the lower-dose group.
There were no significant changes in physical or mental health components of quality-of-life scores (Short-Form 36), in chronic liver disease health-related quality-of-life assessments (Chronic Liver Disease Questionnaire), or in depression scores (Center for Epidemiologic Studies–Depression) in any group (Table 2).
Frequency of adverse events reported by individual patents did not differ significantly among the treatment groups (Table 3), although the power to detect such differences was limited because of the sample size and the relative infrequency of adverse events. The most frequent adverse events were gastrointestinal symptoms, reported in 12% of participants receiving any silymarin dose compared with 5% receiving placebo. The majority of adverse events were reported as mild or moderate in severity. Three patients (1 in the 420-mg silymarin group and 2 in the 700-mg silymarin group) had treatment discontinued because of adverse events. There were 12 serious adverse events: 1 in the placebo group, 6 in the 420-mg silymarin group, and 5 in the 700-mg silymarin group, reported by 2, 5, and 1 unique patients, respectively. Comparing placebo vs silymarin (either dose), the proportion of patients with at least 1 serious adverse event in the silymarin groups (7/102) did not differ significantly from the proportion in the placebo group (1/52) (P = .27). One participant treated with 420-mg silymarin died as a result of suicide 12 weeks after finishing treatment.
Table 3.
Number of Adverse Events and Serious Adverse Events by Treatment Group
| No. |
||||
|---|---|---|---|---|
| Silymarin |
||||
| Events | Placebo | 420 mg | 700 mg | P Valuea |
| Participants with any adverse event | ||||
| All adverse events | 34 | 31 | 29 | .84 |
|
| ||||
| Serious adverse events | 1 | 6 | 5 | .08 |
|
| ||||
| Most common classes of adverse events | ||||
| Gastrointestinal | 4 | 8 | 6 | .56 |
|
| ||||
| Musculoskeletal | 4 | 2 | 3 | .70 |
|
| ||||
| Dermatologic | 3 | 0 | 4 | .67 |
|
| ||||
| Infection | 3 | 1 | 3 | .44 |
|
| ||||
| Physical injury | 1 | 1 | 3 | .65 |
|
| ||||
| Other | 19 | 19 | 10 | .17 |
|
| ||||
| Participants with ≤1 adverse event | ||||
| All adverse events | 21 | 17 | 17 | .68 |
|
| ||||
| Serious adverse events | 1 | 5 | 2 | .10 |
|
| ||||
| Most common classes of adverse events | ||||
| Gastrointestinal | 3 | 6 | 6 | .56 |
|
| ||||
| Musculoskeletal | 4 | 2 | 3 | .91 |
|
| ||||
| Dermatologic | 3 | 0 | 4 | .22 |
|
| ||||
| Infection | 3 | 1 | 2 | .87 |
|
| ||||
| Physical injury | 1 | 1 | 2 | >.99 |
|
| ||||
| Other | 13 | 12 | 6 | .18 |
For comparing number of adverse events across doses, a repeated-measure generalized linear model was used to assess statistical significance. For comparing proportion of patients with at least 1 adverse event across doses, exact Pearson χ2 test was used to assess statistical significance.
COMMENT
Milk thistle fruit extracts have been widely used in the setting of liver disease, but rigorous trials have not been conducted. The current study was designed to assess the efficacy of increasing doses of silymarin in patients with chronic HCV infection. We found that silymarin did not significantly improve serum ALT levels compared with placebo when administered to patients with chronic HCV infection previously unsuccessfully treated with IFN-based therapy.
This trial of silymarin is unique in that it used a well-characterized silymarin product; focused on a specific liver disease; enrolled a large, representative cohort across 4 different clinical sites; included an adequate treatment duration (24 weeks); had excellent adherence with study medication and visits; and used well-defined outcome measures.
Limited data from human and animal studies suggest that silymarin flavonolignans undergo rapid and extensive conjugative metabolism with primarily biliary excretion, resulting in short half-lives and low systemic exposures following oral administration of silymarin.28–32 The doses adminis tered in the present trial, substantially higher than customary doses of silymarin preparations, were first evaluated in a phase 1 pharmacokinetic study and were chosen to increase the chance of detecting a therapeutic benefit. Steady-state peak plasma concentrations of silybin A, the major silymarin flavonolignan detected in blood, ranged between 77 ng/mL to 1510 ng/mL at doses of 280 to 700 mg administered every 8 hours, similar to concentrations achieved in the current trial.17 In contrast, the antiviral, anti-inflammatory, and antioxidant properties of silymarin have been demonstrated in human HCV replicon systems, human hepatoma cell lines, and primary human hepatocytes using silybin A concentrations between 20 and 50 μg/mL, markedly higher than the peak concentrations achieved with the oral silymarin preparation in this study.9,11,33–36
Because the focus of this study was on modifying disease activity, serum ALT level was deemed the most appropriate measure of the primary outcome, rather than HCV RNA level, which was explored as a secondary outcome. Although it is acknowledged that the most direct measure of improvement in liver disease is obtained by assessing paired liver biopsies obtained before and after therapy, liver biopsies incur risks to participants. As noted above, decreases in serum ALT levels highly correlate with improvement in hepatic necroinflammatory activity after interferon therapy, even when HCV RNA levels remain unchanged.19–22 Thus, in the absence of any change in serum ALT level, improvement in hepatic histology or in hepatic fibrosis (as measured by noninvasive serum markers or transient elastography, none of which are approved by the US Food and Drug Administration in the United States37) would have been unlikely.
Serum HCV RNA levels also remained unchanged during the course of this study, which was consistent with the primary end point findings for disease activity. It is interesting, however, that a recent case series of patients with treatment-resistant HCV infection showed up to 3-log reductions in HCV RNA levels when treated with infusions of silibinin succinate, a silymarin-derived compound not contained in the oral product used in this trial.38 Serum ALT activity was also improved in some patients. Differential in vitro effects on HCV viral genotypes and HCV RNA–dependent RNA polymerase between oral silymarin and silibinin succinate have also been reported, suggesting potential differential in vivo activities of the 2 formulations.34,35
Adherence to therapy was well maintained, despite a high pill burden, throughout the 24-week treatment period. Analysis of the primary end point among participants with the highest level of adherence did not demonstrate any significant difference across treatment groups. Similarly, an analysis of continuous changes in serum ALT levels during the first or second 12 weeks of treatment could not differentiate any treatment effect.
This study had several limitations. Fewer patients than expected treated with placebo or silymarin achieved the primary outcome, raising the possibility that the participants in this study were not representative of all patients with chronic HCV not responding to IFN-based therapy or that the expected response rates were assumed to be higher than the actual rates in the population. Enrollment in this study required an abnormal ALT level, which would identify the population for whom an alternative medication would be expected to provide the greatest benefit if any signal of efficacy was detected. Furthermore, the study was designed to have adequate power if 25% more participants in the treatment group had a response than in the placebo group. Even if the actual response in the placebo group was as low as the observed response (3.8%), the study was still adequately powered to find the hypothesized difference between the treated and placebo groups. If the true response rate in the placebo group was 3.8% and was 25% higher (28.8%) in the 2 silymarin groups, the study would have 91% power to detect a 25% between-group difference at the same sample size and type I error level.
Although the percentage of participants with serious adverse events was numerically higher with silymarin treatment, the distribution of all adverse events was similar between the treatment and placebo groups. However, this study was not powered to find statistically significant differences among treatment groups with respect to adverse events.
In summary, oral silymarin, used at higher than customary doses, did not significantly alter biochemical or virological markers of disease activity in patients with chronic HCV infection who had prior treatment with IFN-based regimens. Silymarin did not provide greater benefit than placebo for patients with treatment-resistant chronic HCV infection.
Acknowledgments
Funding/Support: This study was supported with cooperative agreements from the National Institutes of Health (NIH) National Center for Complementary and Alternative Medicine (NCCAM) (UO1 AT003571, UO1 AT003560, UO1 AT003573, UO1 AT003566, and UO1 AT003574); with cofunding from the National Institute of Diabetes and Digestive and Kidney Diseases (NIDDK); and with support from the NIH Clinical & Translational Sciences Awards Division of Research Resources (UL1 RR024134, UL1 TR000083). Dr Fried is also supported by an NIH Mid-Career Award (DK066144). The trial was conducted under an Investigational New Drug Application from the US Food and Drug Administration. Rottapharm | Madaus (Monza, Italy, and Cologne, Germany) donated the silymarin study medication and matching placebo. Abbott Molecular Inc (Des Plaines, Illinois) donated the Abbott RealTime HCV assays.
Role of the Sponsors: Neither Rottapharm|Madaus nor Abbott Molecular Inc had any role in the design and conduct of the study or the collection or analysis of the data. Rottapharm|Madaus provided nonbinding comments to the authors on a draft manuscript. SyNCH Study Group Members and Centers: Clinical Centers: Beth Israel Deaconess Medical Center, Boston, Massachusetts: Nezam Afdhal, MD; Joseph Colagreco, DNP, APRN-BC, NP. Thomas Jefferson University, Philadelphia, Pennsylvania: Divya Gupta, MD, MS; Cynthia Miller, RN; Victor Navarro, MD; Manisha Verma, MD. University of North Carolina, Chapel Hill: Betty Batey, PA-C; Eric Borg, PharmD; Paris Davis, BA; Karen A. Dougherty, A-NP; Scott Elliott, PA-C; Donna Evon, PhD, Michael W. Fried, MD; Roy Hawke, PharmD, PhD; Meredith Howell, PharmD; Sarah Schrieber, PharmD; Tedi Soule, PharmD. University of Pennsylvania, Philadelphia: David E. Kaplan, MD; Christine Kennedy, BA; Amy Walton, MPH; K. Rajender Reddy, MD; Amina Wirjosemito, MPH. Data Coordinating Center: University of Pittsburgh, Pittsburgh, Pennsylvania: Steven Belle, PhD, MScHyg; Joy Bowen, BA; Marcia Kurs-Lasky, MS; Sharon Lawlor, MBA; Abdus Wahed, PhD; Ella Zadorozny, MS. National Institutes of Health: National Center for Complementary and Alternative Medicine: Linda Duffy, PhD; Catherine Meyers, MD; National Institute of Diabetes and Digestive and Kidney Diseases: Edward Doo, MD, Jay Hoofnagle, MD, Leonard Seeff, MD. Data and Safety Monitoring Board: Henry C. Bodenheimer, MD (chair) (Beth Israel Medical Center); Jacqueline Laurin, MD (Georgetown Univer sity); Kimberly Kristine McFann, PhD (University of Colorado); Richard I. Shader, MD (Tufts University); Mark Blumenthal (American Botanical Council).
Trial Registration clinicaltrials.gov Identifier: NCT00680342
Footnotes
Author Contributions: Dr Belle had full access to all the data in the study and takes responsibility for the integrity of the data and the accuracy of the data analysis.
Study concept and design: Fried, Navarro, Afdhal, Belle, Wahed, Hawke, Doo, Reddy.
Acquisition of data: Fried, Navarro, Afdhal, Reddy.
Analysis and interpretation of data: Fried, Belle, Wahed, Hawke, Doo, Meyers, Reddy.
Drafting of the manuscript: Fried, Belle, Wahed, Hawke, Meyers, Reddy.
Critical revision of the manuscript: Fried, Navarro, Afdhal, Belle, Wahed, Hawke, Doo, Meyers, Reddy.
Statistical analysis: Belle, Wahed.
Obtained funding: Fried, Navarro, Afdhal, Belle, Reddy.
Study supervision: Fried, Navarro, Afdhal, Belle, Wahed, Hawke, Doo, Meyers, Reddy.
Conflict of Interest Disclosures: All authors have completed and submitted the ICMJE Form for Disclosure of Potential Conflicts of Interest. Dr Fried reported receiving research grants from Genentech, Merck, Vertex, Gilead, Tibotec, Janssen, Bristol Myers Squibb, Abbott, and Rottapharm|Madaus and serving as an ad hoc consultant to Genentech, Vertex, Merck, Tibotec, Gilead, Bristol Myers Squibb, and Novartis. Dr Navarro reported receiving research grants from Vertex and Rottapharm|Madaus and serving as a consultant to Merck. Dr Afdhal reported receiving research grants from and serving as consultant to Merck, GlaxoSmithKline, Vertex, Abbott, Springbank, Medgenics, Boehringer Ingelheim, and Novartis and receiving research grants from Rottapharm|Madaus. Dr Belle reported receiving research grants from Rottapharm|Madaus. Dr Reddy reported receiving research grants from Genentech-Roche, Merck, Gilead, BMS, Ikaria, Anadys, Gore, Janssen, Vertex, and Rottapharm|Madaus and serving on advisory boards for Genentech-Roche, Merck, Gilead, Janssen, and Vertex. No other authors reported disclosures.
Online-Only Material: The eAppendix is available at http://www.jama.com.
Additional Contributions: We thank Melissa Miller, PhD, Department of Pathology and Laboratory Medicine, University of North Carolina at Chapel Hill, for performing the HCV RNA assays. Dr Miller was compensated for the technical costs of the assays.
REFERENCES
- 1.Shepard CW, Finelli L, Alter MJ. Global epidemiology of hepatitis C virus infection. Lancet Infect Dis. 2005;5(9):558–567. doi: 10.1016/S1473-3099(05)70216-4. [DOI] [PubMed] [Google Scholar]
- 2.Fried MW, Shiffman ML, Reddy KR, et al. Peginterferon alfa-2a plus ribavirin for chronic hepatitis C virus infection. N Engl J Med. 2002;347(13):975–982. doi: 10.1056/NEJMoa020047. [DOI] [PubMed] [Google Scholar]
- 3.Poordad F, McCone J, Jr, Bacon BR, et al. SPRINT-2 Investigators. Boceprevir for untreated chronic HCV genotype 1 infection. N Engl J Med. 2011;364(13):1195–1206. doi: 10.1056/NEJMoa1010494. [DOI] [PMC free article] [PubMed] [Google Scholar]
- 4.Jacobson IM, McHutchison JG, Dusheiko G, et al. ADVANCE Study Team Telaprevir for previously untreated chronic hepatitis C virus infection. N Engl J Med. 2011;364(25):2405–2416. doi: 10.1056/NEJMoa1012912. [DOI] [PubMed] [Google Scholar]
- 5.Ghany MG, Strader DB, Thomas DL, Seeff LB. American Association for the Study of Liver Diseases. Diagnosis, management, and treatment of hepatitis C: an update. Hepatology. 2009;49(4):1335–1374. doi: 10.1002/hep.22759. [DOI] [PMC free article] [PubMed] [Google Scholar]
- 6.Freedman ND, Curto TM, Morishima C, et al. HALT-C Trial Group Silymarin use and liver disease progression in the Hepatitis C Antiviral Long-Term Treatment Against Cirrhosis trial. Aliment Pharmacol Ther. 2011;33(1):127–137. doi: 10.1111/j.1365-2036.2010.04503.x. [DOI] [PMC free article] [PubMed] [Google Scholar]
- 7.Abenavoli L, Capasso R, Milic N, Capasso F. Milk thistle in liver diseases: past, present, future. Phytother Res. 2010;24(10):1423–1432. doi: 10.1002/ptr.3207. [DOI] [PubMed] [Google Scholar]
- 8.Seeff LB, Curto TM, Szabo G, et al. HALT-C Trial Group Herbal product use by persons enrolled in the Hepatitis C Antiviral Long-Term Treatment Against Cirrhosis (HALT-C) Trial. Hepatology. 2008;47(2):605–612. doi: 10.1002/hep.22044. [DOI] [PubMed] [Google Scholar]
- 9.Polyak SJ, Morishima C, Lohmann V, et al. Identification of hepatoprotective flavonolignans from silymarin. Proc Natl Acad Sci U S A. 2010;107(13):5995–5999. doi: 10.1073/pnas.0914009107. [DOI] [PMC free article] [PubMed] [Google Scholar]
- 10.Morishima C, Shuhart MC, Wang CC, et al. Silymarin inhibits in vitro T-cell proliferation and cytokine production in hepatitis C virus infection. Gastroenterology. 2010;138(2):671–681. doi: 10.1053/j.gastro.2009.09.021. [DOI] [PMC free article] [PubMed] [Google Scholar]
- 11.Bonifaz V, Shan Y, Lambrecht RW, Donohue SE, Moschenross D, Bonkovsky HL. Effects of silymarin on hepatitis C virus and haem oxygenase-1 gene expression in human hepatoma cells. Liver Int. 2009;29(3):366–373. doi: 10.1111/j.1478-3231.2008.01833.x. [DOI] [PMC free article] [PubMed] [Google Scholar]
- 12.Rambaldi A, Jacobs BP, Gluud C. Milk thistle for alcoholic and/or hepatitis B or C virus liver diseases. Cochrane Database Syst Rev. 2007;(4):CD003620. doi: 10.1002/14651858.CD003620.pub3. [DOI] [PMC free article] [PubMed] [Google Scholar]
- 13.Jacobs BP, Dennehy C, Ramirez G, Sapp J, Lawrence VA. Milk thistle for the treatment of liver disease: a systematic review and meta-analysis. Am J Med. 2002;113(6):506–515. doi: 10.1016/s0002-9343(02)01244-5. [DOI] [PubMed] [Google Scholar]
- 14.Saller R, Brignoli R, Melzer J, Meier R. An updated systematic review with meta-analysis for the clinical evidence of silymarin. Forsch Komplementmed. 2008;15(1):9–20. doi: 10.1159/000113648. [DOI] [PubMed] [Google Scholar]
- 15.Liu J, Manheimer E, Tsutani K, Gluud C. Medicinal herbs for hepatitis C virus infection: a Cochrane hepatobiliary systematic review of randomized trials. Am J Gastroenterol. 2003;98(3):538–544. doi: 10.1111/j.1572-0241.2003.07298.x. [DOI] [PubMed] [Google Scholar]
- 16.Verma S, Thuluvath PJ. Complementary and alternative medicine in hepatology: review of the evidence of efficacy. Clin Gastroenterol Hepatol. 2007;5(4):408–416. doi: 10.1016/j.cgh.2006.10.014. [DOI] [PubMed] [Google Scholar]
- 17.Hawke RL, Schrieber SJ, Soule TA, et al. SyNCH Trial Group Silymarin ascending multiple oral dosing phase I study in noncirrhotic patients with chronic hepatitis C. J Clin Pharmacol. 2010;50(4):434–449. doi: 10.1177/0091270009347475. [DOI] [PMC free article] [PubMed] [Google Scholar]
- 18.Reddy KR, Belle SH, Fried MW, et al. SyNCH Study Group Rationale, challenges, and participants in a phase II trial of a botanical product for chronic hepatitis C. Clin Trials. 2012;9(1):102–112. doi: 10.1177/1740774511427064. [DOI] [PMC free article] [PubMed] [Google Scholar]
- 19.Carithers RL, Jr, Emerson SS. Therapy of hepatitis C: meta-analysis of interferon alfa-2b trials. Hepatology. 1997;26(suppl 1):83S–88S. doi: 10.1002/hep.510260715. (3) [DOI] [PubMed] [Google Scholar]
- 20.Bonis PA, Ioannidis JP, Cappelleri JC, Kaplan MM, Lau J. Correlation of biochemical response to inter-feron alfa with histological improvement in hepatitis C: a meta-analysis of diagnostic test characteristics. Hepatology. 1997;26(4):1035–1044. doi: 10.1002/hep.510260436. [DOI] [PubMed] [Google Scholar]
- 21.Shiffman ML, Hofmann CM, Thompson EB, et al. Relationship between biochemical, virological, and histological response during interferon treatment of chronic hepatitis C. Hepatology. 1997;26(3):780–785. doi: 10.1002/hep.510260335. [DOI] [PubMed] [Google Scholar]
- 22.Causse X, Godinot H, Chevallier M, et al. Comparison of 1 or 3 MU of interferon alfa-2b and placebo in patients with chronic non-A, non-B hepatitis. Gastroenterology. 1991;101(2):497–502. doi: 10.1016/0016-5085(91)90030-o. [DOI] [PubMed] [Google Scholar]
- 23.Ware JE, Jr, Kosinski M, Keller S. SF-36 Physical and Mental Health Summary Scales: A User's Manual. The Health Institute, New England Medical Center; Boston, MA: 1994. [Google Scholar]
- 24.Younossi ZM, Guyatt G, Kiwi M, Boparai N, King D. Development of a disease-specific questionnaire to measure health-related quality of life in patients with chronic liver disease. Gut. 1999;45(2):295–300. doi: 10.1136/gut.45.2.295. [DOI] [PMC free article] [PubMed] [Google Scholar]
- 25.Radloff LS. The CES-D Scale: a self-report depression scale for research in the general population. Appl Psychol Meas. 1977;1:385–401. [Google Scholar]
- 26.Conjeevaram HS, Fried MW, Jeffers LJ, et al. Virahep-C Study Group Peginterferon and ribavirin treatment in African American and Caucasian American patients with hepatitis C genotype 1. Gastroenterology. 2006;131(2):470–477. doi: 10.1053/j.gastro.2006.06.008. [DOI] [PubMed] [Google Scholar]
- 27.Little RJA, Rubin DB. Statistical Analysis With Missing Data. John Wiley & Sons Inc; New York, NY: 1987. [Google Scholar]
- 28.Wen Z, Dumas TE, Schrieber SJ, Hawke RL, Fried MW, Smith PC. Pharmacokinetics and metabolic profile of free, conjugated, and total silymarin flavonolignans in human plasma after oral administration of milk thistle extract. Drug Metab Dispos. 2008;36(1):65–72. doi: 10.1124/dmd.107.017566. [DOI] [PubMed] [Google Scholar]
- 29.Schandalik R, Gatti G, Perucca E. Pharmacokinetics of silybin in bile following administration of silipide and silymarin in cholecystectomy patients. Arzneimittelforschung. 1992;42(7):964–968. [PubMed] [Google Scholar]
- 30.Miranda SR, Lee JK, Brouwer KL, Wen Z, Smith PC, Hawke RL. Hepatic metabolism and biliary excretion of silymarin flavonolignans in isolated perfused rat livers: role of multidrug resistance–associated protein 2 (Abcc2) Drug Metab Dispos. 2008;36(11):2219–2226. doi: 10.1124/dmd.108.021790. [DOI] [PMC free article] [PubMed] [Google Scholar]
- 31.Morazzoni P, Magistretti MJ, Giachetti C, Zanolo G. Comparative bioavailability of silipide, a new flavanolignan complex, in rats. Eur J Drug Metab Pharmacokinet. 1992;17(1):39–44. doi: 10.1007/BF03189986. [DOI] [PubMed] [Google Scholar]
- 32.Morazzoni P, Montalbetti A, Malandrino S, Pifferi G. Comparative pharmacokinetics of silipide and silymarin in rats. Eur J Drug Metab Pharmacokinet. 1993;18(3):289–297. doi: 10.1007/BF03188811. [DOI] [PubMed] [Google Scholar]
- 33.Polyak SJ, Morishima C, Shuhart MC, Wang CC, Liu Y, Lee DY. Inhibition of T-cell inflammatory cytokines, hepatocyte NF-kappaB signaling, and HCV infection by standardized silymarin. Gastroenterology. 2007;132(5):1925–1936. doi: 10.1053/j.gastro.2007.02.038. [DOI] [PubMed] [Google Scholar]
- 34.Ahmed-Belkacem A, Ahnou N, Barbotte L, et al. Silibinin and related compounds are direct inhibitors of hepatitis C virus RNA–dependent RNA polymerase. Gastroenterology. 2010;138(3):1112–1122. doi: 10.1053/j.gastro.2009.11.053. [DOI] [PubMed] [Google Scholar]
- 35.Wagoner J, Negash A, Kane OJ, et al. Multiple effects of silymarin on the hepatitis C virus lifecycle. Hepatology. 2010;51(6):1912–1921. doi: 10.1002/hep.23587. [DOI] [PMC free article] [PubMed] [Google Scholar]
- 36.Magdalan J, Piotrowska A, Gomułkiewicz A, Sozański T, Szela̧g A, Dziegiȩl P. Influence of commonly used clinical antidotes on antioxidant systems in human hepatocyte culture intoxicated with alpha-amanitin. Hum Exp Toxicol. 2011;30(1):38–43. doi: 10.1177/0960327110368418. [DOI] [PubMed] [Google Scholar]
- 37.Patel K, Friedrich-Rust M, Lurie Y, et al. Fibro-SURE and FibroScan in relation to treatment response in chronic hepatitis C virus. World J Gastroenterol. 2011;17(41):4581–4589. doi: 10.3748/wjg.v17.i41.4581. [DOI] [PMC free article] [PubMed] [Google Scholar]
- 38.Ferenci P, Scherzer TM, Kerschner H, et al. Silibinin is a potent antiviral agent in patients with chronic hepatitis C not responding to pegylated interferon /ribavirin therapy. Gastroenterology. 2008;135(5):1561–1567. doi: 10.1053/j.gastro.2008.07.072. [DOI] [PubMed] [Google Scholar]