

Abstract
The Alzheimer’s Disease Neuroimaging Initiative (ADNI) measures abilities broadly related to executive function (EF), including WAIS-R Digit Symbol Substitution, Digit Span Backwards, Trails A and B, Category Fluency, and Clock Drawing. This study investigates whether a composite executive function measure based on these multiple indicators has better psychometric characteristics than the widely used individual components. We applied item response theory methods to 800 ADNI participants to derive an EF composite score (ADNI-EF) from the above measures. We then compared ADNI-EF with component measures in 390 longitudinally-followed participants with mild cognitive impairment (MCI) with respect to: (1) Ability to detect change over time; (2) Ability to predict conversion to dementia; (3) Strength of cross-sectional association with MRI-derived measures of structures involved in frontal systems, and (4) Strength of baseline association with cerebrospinal fluid (CSF) levels of amyloid β1-42, total tau, and phosphorylated tau181P. ADNI-EF showed the greatest change over time, followed closely by Category Fluency. ADNI-EF needed a 40 % smaller sample size to detect change. ADNI-EF was the strongest predictor of AD conversion. ADNI-EF was the only measure significantly associated with all the MRI regions, though other measures were more strongly associated in a few of the regions. ADNI-EF was associated with all the CSF measures. ADNI-EF appears to be a useful composite measure of EF in MCI, as good as or better than any of its composite parts. This study demonstrates an approach to developing a psychometrically sophisticated composite score from commonly-used tests.
Keywords: Executive function, Mild cognitive impairment, Item response theory, Composite scores
Introduction
Decline in executive function (EF) is often a debilitating feature of Alzheimer’s disease (AD) and can be a symptom in mild cognitive impairment (MCI) as well (Mohs et al. 1997; Ewers et al. 2010; Tabert et al. 2006; Mungas et al. 2010). Poor EF has been shown to be related to decline in activities of daily living (Farias et al. 2009; Cahn-Weiner et al. 2002) and to predict conversion from MCI to dementia (Nordlund et al. 2010; Gomar et al. 2011; Marra et al. 2011; Tabert et al. 2006). For these reasons, there is considerable interest in assessing EF in older adults.
Numerous neuropsychological tests measuring EF exist. Composite measures may be more powerful than their constituent parts for detecting change (Crane et al. 2008). The use of a composite increases measurement precision, helps avoid idiosyncratic features of a particular test that may capitalize on chance, and limits the number of statistical tests needed compared to analyzing each of the constituent parts separately. Another advantage is the possibility of increasing the range of underlying EF ability that is assessed well. If one constituent test has good precision for people with high levels of EF ability, and another has good precision for people with poor EF ability, combining them can result in a test that is good for people with both high and low levels of ability. Such a test would be more suitable for populations characterized by both high and low performers, or for looking at change from high to low function. In studies of cognitive aging, EF composites have proven to be useful for investigating change over time (Mungas et al. 2010) and for characterizing relationships between EF and measures derived from brain imaging (Carmichael et al. 2010a; Farias et al. 2011; Cardenas et al. 2011; Mungas et al. 2005; Parks et al. 2011; Smith et al. 2011; Chang et al. 2010) and cerebrospinal fluid (CSF) (Rolstad et al. 2011).
The AD Neuroimaging Initiative (ADNI) study provides a good opportunity to construct and validate an EF composite using standard, widely used neuropsychological assessment instruments. The ADNI protocol includes neuropsychological assessment at each study visit, with a test battery that includes several measures of different aspects of executive function, including the Digit Symbol Substitution (Wechsler 1981) and Digit span backwards tests (Wechsler 1987) from the Wechsler Adult Intelligence Scale-Revised (WAIS R), the Trail Making Test parts A and B (Reitan and Wolfson 1985), animal and vegetable Category Fluency (Morris et al. 1989), and the Clock Drawing test (Goodglass and Kaplan 1983). These individual tests are commonly used in clinical neuropsychological assessment, including evaluation of EF. Whether these tests can be combined into an EF composite score that has psychometric advantages over its individual components is the focus of this study.
A 2006 meta-analysis documents a strong relationship between EF and the frontal lobe of the brain (Alvarez and Emory 2006). Recent cognitive aging research has found associations between single and composite measures of EF and imaging-derived indices of structures in frontal regions (Cardenas et al. 2011; McDonald et al. 2010), thickness of the cortex in the prefrontal and posterior cingulate regions (Chang et al. 2010), and the total volume of white matter hyperintensities (Smith et al. 2011; Parks et al. 2011; Farias et al. 2011; Carmichael et al. 2010a; Cardenas et al. 2011; Grambaite et al. 2011). Based on these data, we hypothesized that an EF composite from the ADNI neuropsychological battery should have strong relationships with relevant imaging parameters. Examining the relationship between a composite measure of EF and cortical thickness and other MRI results may further our understanding of relationships between brain structure and function in older adults.
CSF biomarkers associated with higher risk of conversion from MCI to AD have been identified (De Meyer et al. 2010; Ewers et al. 2010; Trojanowski et al. 2010), but little is known about the relationship between these biomarkers and EF. In the Gothenburg study of people with MCI, a speed/executive function composite was associated with levels of total tau and levels of amyloid β1-42 among people with MCI (Rolstad et al. 2011). However, in an earlier study of people with MCI, performance on 5 individual EF tests was not significantly different between 2 groups defined by levels of total tau and amyloid β1-42 (Nordlund et al. 2008). It is possible that a composite score would have shown a greater effect. Here we compare side-by-side, within a single study, associations between a psychometrically sophisticated composite EF score and its individual components and CSF fluid biomarkers.
In this paper we formed an EF composite, ADNI-EF, using modern psychometric theory (R. P. McDonald 1999). We compared ADNI-EF to the individual measures that were included in the composite with four sets of analyses, among ADNI participants with MCI at baseline: (1) Ability to detect differences in rates of change; (2) Ability to predict conversion to dementia; (3) Strength of baseline association with seven MRI-derived measures specified a priori as related to frontal systems, and (4) Strength of baseline association with CSF levels of amyloid β1-42, total tau, and phosphorylated tau181P. Our hypotheses were that ADNI-EF would be as able as its constituent tests to detect change and to predict conversion to dementia, and that it would be as strongly associated with the indices of brain structure derived from MRI data. Since little is known about CSF patterns, the fourth set of analyses was more exploratory. Finally, we examined rates of change and relationships to MRI and CSF in those with normal cognition (NC) and those with AD as additional exploratory analyses.
Methods
Participants
Participants were volunteers from the Alzheimer’s Disease Neuroimaging Initiative (ADNI) database (adni.loni.ucla.edu). The ADNI was launched in 2003 by the National Institute on Aging (NIA), the National Institute of Biomedical Imaging and Bioengineering (NIBIB), the Food and Drug Administration (FDA), private pharmaceutical companies and non-profit organizations, as a $60 million, 5-year public-private partnership. The primary goal of ADNI has been to test whether serial magnetic resonance imaging (MRI), positron emission tomography (PET), other biological markers, and clinical and neuropsychological assessment can be combined to measure the progression of mild cognitive impairment (MCI) and early Alzheimer’s disease (AD). Determination of sensitive and specific markers of very early AD progression is intended to aid researchers and clinicians to develop new treatments and monitor their effectiveness, as well as lessen the time and cost of clinical trials. The Principal Investigator of this initiative is Michael W. Weiner, MD, VA Medical Center and University of California – San Francisco. ADNI is the result of efforts of many co-investigators from a broad range of academic institutions and private corporations, and subjects have been recruited from over 50 sites across the U.S. and Canada. The initial goal of ADNI was to recruit 800 adults, ages 55 to 90, to participate in the research, approximately 200 cognitively normal older individuals who were followed for up to 3 years, 400 people with MCI who were followed for up to 3 years and 200 people with early AD who were followed for up to 2 years. Full ADNI inclusion and exclusion criteria and up-to-date information are online at www.adni-info.org.
Of the 819 participants enrolled, 229 had normal cognition, 397 had MCI, and 193 had Alzheimer’s disease. Classification criteria for MCI and AD can be found elsewhere (Petersen et al. 2010). This study used 800 participants who had complete data for the EF measures at one or more study visits (Table 1).
Table 1.
Demographic, clinical, CSF and MRI data by baseline diagnosis (n=800 with complete EF data)
| Normal | MCI | AD | p-valuec | |
|---|---|---|---|---|
| Sample size | ||||
| N Baseline | 229 | 390 | 181 | |
| N 6 months | 220 | 367 | 163 | |
| N 12 months | 209 | 352 | 132 | |
| N 18 months | 0 | 310 | 0 | |
| N 24 months | 197 | 286 | 93 | |
| N 36 months | 182 | 221 | 0 | |
| Demographics | ||||
| Female | 48 % | 36 % | 48 % | .003 |
| Age (years), mean±SDa | 76.0±5.0 | 74.9±7.5 | 75.7±7.4 | <.001 |
| Education (years), mean±SD | 16.0±2.9 | 15.7±3.0 | 14.7±3.2 | <.001 |
| Any APOE ε4 alleles | 27 % | 54 % | 65 % | <.001 |
| Baseline clinical data: mean ±SD | ||||
| ADNI-EF | 0.70±0.67 | −0.03±0.77 | −0.86±0.80 | <.001 |
| Category Fluency (Animals + Vegetables) | 34.6±8.1 | 26.7±7.3 | 20.5±7.5 | <.001 |
| Clock Drawing | 4.7±0.6 | 4.2±1.0 | 3.5±1.3 | <.001 |
| WAIS-R Digit Symbol | 45.7±10.2 | 36.9±11.2 | 27.5±12.4 | <.001 |
| Digit Span Backwards | 7.4±2.2 | 6.2±2.0 | 5.0±1.8 | <.001 |
| Trails A | 36.4±13.2 | 44.3±21.7 | 64.7±34.5 | <.001 |
| Trails B | 89.2±44.3 | 131.0±73.5 | 198.0±86.9 | <.001 |
| Trails B–Trails A | 52.8±38.8 | 86.7±63.3 | 133.6±75.1 | <.001 |
| Baseline MRI datab | ||||
| White matter hyperintensities (cm3) | 0.68±2.34 | 0.60±1.09 | 0.79±1.16 | 0.660 |
| Cortical thicknesses (mm): | ||||
| Caudal middle frontal | 2.3±0.2 | 2.2±0.2 | 2.2±0.2 | <.001 |
| Rostral middle frontal | 2.2±0.1 | 2.1±0.2 | 2.1±0.2 | <.001 |
| Superior middle frontal | 2.5±0.2 | 2.4±0.2 | 2.4±0.2 | <.001 |
| Lateral orbito-frontal | 2.5±0.2 | 2.5±0.2 | 2.4±0.2 | <.001 |
| Medial orbito-frontal | 2.3±0.1 | 2.3±0.2 | 2.2±0.2 | <.001 |
| Pars-triangularis | 2.2±0.2 | 2.2±0.2 | 2.1±0.2 | <.001 |
| N complete data for MRI measurements above |
152 | 216 | 77 | |
| Baseline CSF datac | ||||
| Total tau>93 pg/ml | 18 % | 44 % | 66 % | <.001 |
| Aβ1-42<192 pg/ml | 38 % | 75 % | 90 % | <.001 |
| PTau181P>23 pg/ml | 35 % | 70 % | 87 % | <.001 |
| AD cluster | 36 % | 73 % | 94 % | <.001 |
| N complete CSF data for CSF measurements above |
114 | 190 | 94 |
SD = Standard Deviation
Only MRI assessments with an overall quality control of “Pass” were included
Fisher’s exact test for categorical variables, ANOVA for continuous variables
Total protein (tau), beta amyloid 1-42 (Aβ1-42), and phosphorylated-tau protein 181 (pTau181p) dichotomized as in Shaw et al. 2009. AD Cluster from de Meyer et al. 2010
MRI
The imaging methods utilized by the ADNI have been described in detail previously (Jack et al. 2008). ADNI used calibration techniques to maintain consistent protocols across scanners and sites. Raw dicom data of T1-weighted MP-RAGE scans acquired from 1.5 Tesla scanners at baseline visits from all participants were obtained via the ADNI database (http://www.loni.ucla.edu/ADNI/). Images were processed through FreeSurfer version 4.0.3 (a software program freely available at http://surfer.nmr.mgh.harvard.edu/) to obtain measurements of frontal lobe thickness. In our analyses we utilized mean thickness data for the following cortical regions of the left and right frontal lobes: caudal middle frontal, rostral middle frontal, superior middle frontal, lateral orbito-frontal, medial orbito-frontal, and pars triangularis.
White matter hyperintensities (WMH) were detected on co-registered T1-, T2-, and PD-weighted images using an automated method described previously (Schwarz et al. 2009; Carmichael et al. 2010b). WMH were detected in MDT space at each voxel based on corresponding PD, T1, and T2 intensities there, the prior probability of WMH there, and the conditional probability of WMH there based on the presence of WMH at neighboring voxels. The resulting map of WMH voxels across the brain is summarized by an estimate of total WMH volume. WMH volumes estimated with this method agreed strongly with WMH volumes estimated from fluid-attenuated inversion recovery (FLAIR) MRI in a large, diverse elderly sample (Schwarz et al. 2009).
CSF
A subset of the participants (n=415, of whom n=190 had MCI) received at least one lumbar puncture to obtain CSF for assays of amyloid β1-42 (Aβ), total tau (tau), and phosphorylated tau181P (ptau). Sample collection and analysis procedures are described in detail in Shaw et al. (2009). We also used a CSF-based “AD signature” classification developed by de Meyer et al. (2010), which is based on Aβ and p-tau.
Conversion to dementia
Conversion from normal or MCI to AD was a primary outcome for ADNI and so was tracked very closely. Complete methods for identifying dementia cases can be found in the ADNI protocol available at the ADNI web site http://www.adni-info.org.
Executive function measure development
We used baseline data from all three groups (NC, MCI, AD) to develop ADNI-EF. ADNI participants completed an extensive neuropsychological battery. Several of the authors (PKC, AC, and DM) reviewed the battery to pick items which could be considered indicators of EF. EF is not a unitary construct. Tasks involving planning and organization, working memory, response generation, and response inhibition are most frequently associated with frontal lobe mediated executive function, but component tasks are also highly correlated with general cognitive abilities related to reasoning and processing speed (Salthouse 2005). Given the items available in ADNI and our goal of capturing the range of impairment associated with AD, we opted for a relatively broad and inclusive measure of EF, rather than a pure measure that might specifically relate to frontal lobe subregions of specific frontal-subcortical systems. The items we used were Category Fluency—animals, Category Fluency—vegetables, Trails A and B, Digit span backwards, WAIS-R Digit Symbol Substitution, Number Cancellation, and 5 Clock Drawing items (circle, symbol, numbers, hands, time). We were able to incorporate all these items into our composite, refining our model structure using an iterative process in which we constructed a model using confirmatory factor analysis, reviewed findings as a small group, and then constructed a revised model. Our criteria for model fit were the confirmatory fit index (CFI), the Tucker Lewis Index (TLI) and the root mean squared error of approximation (RMSEA), where criteria for excellent fit include CFI> 0.95, TLI >0.95, and RMSEA<0.05 (Reeve et al. 2007). We used Mplus (version 5) (Muthén and Muthén 1998–2007) using the theta parameterization and the WLSMV estimator. All the items listed above, except for Number Cancellation, were included in the final model for the EF composite score (ADNI-EF) (Fig. 1).
Fig. 1.
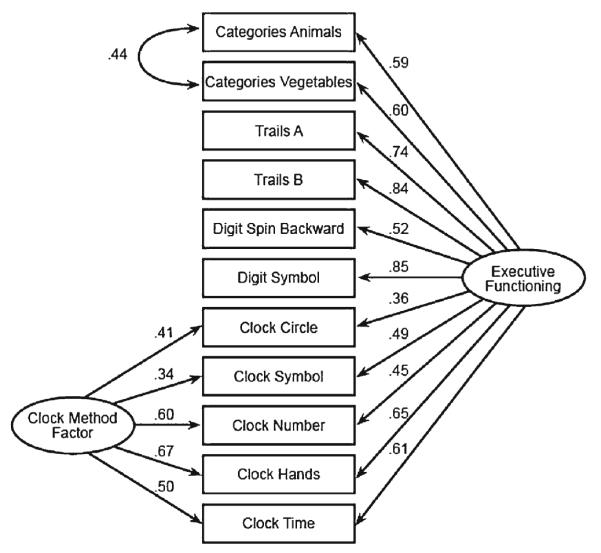
ADNI-EF bi-factor model of executive function. There are two secondary domains, one for the Category Fluency items and one for the Clock Drawing items
These EF indicators utilized a variety of response formats that present challenges for constructing summary or composite measures. These include counts in a pre-specified time span (Category Fluency, WAIS-R Digit Symbol), times to completion (Trails), number of items completed correctly (Digit Span Backwards), and dichotomous correct/incorrect (clock drawing). We developed ordered categorical transformations of the raw data to facilitate development of composite scores that did not make strong assumptions about the distributions of scores. We recoded the raw scores into ordinal scales with 10 categories, the maximum allowed by Mplus for ordinal variables. For example, Trails A had a time limit of 150 s and Trails B had a time limit of 5 min. We treated these right-censored values as the lowest (worst EF) category of the transformed categorical variable. For Trails A we assigned times to the remaining categories based on time of completion, with 118–150 s the lowest category, 94–117 next, 73–93, 53–72, etc. Our categorical transformations were based on the empirically observed distributions of the raw data, with a goal of maintaining variability in the tails at the expense of maintaining variability in the middle of the distributions. Specifics on how Category Fluency, WAIS-R Digit Symbol, Digit Span Backwards and Trails A and B were transformed are given in Online Appendix 1.
Bi-factor confirmatory factor analysis models have been found to be useful in a variety of contexts (R. P. McDonald 1999) and played an important role in ADNI-EF development. The bi-factor model employed here is related to the testlet response theory extension of item response theory scores (Wainer et al. 2007). In particular, because we allowed flexible loadings on the secondary domains, the bi-factor model we used is analogous to the flexible testlet model employed by Li and colleagues (Li et al. 2006). In this case, the single factor model was not a good representation of the data (Online Appendix 2). Specifically, as shown in Fig. 1, a bi-factor structure that included secondary domain structure for correlations between Category Fluency items and that included a methods factor for the Clock Drawing items produced much improved measures of model fit. We considered additional secondary structure, such as a residual correlation for the Trails tasks or for the two tests involving digits, but these residual correlations had a negligible impact on model fit and did not influence the loadings of other indicators on the primary factor (Online Appendix 2). These considerations resulted in our final confirmatory factor analysis bi-factor model, shown in Fig. 1.
We defined the metric for ADNI-EF to have a mean of 0, and standard deviation of 1, based on the 800 participants with complete EF data at baseline. We used item parameters (loadings and thresholds) for the global factor from the baseline model to compute scores at each follow-up visit. The resulting ADNI-EF scores are available in the ADNI data base [http://adni.loni.ucla.edu/]. Item parameters are available from the authors on request, as is a script file for analyzing the bi-factor model data.
A test information curve indicates how precisely EF is measured at each ability level. Including multiple indicators of EF that discriminate among a wide range of EF abilities will result in higher test information and a more precise measure of EF. Because we used a bi-factor model to compute ADNI-EF, the assumptions underlying the typical formulas for computing test information (Baker and Kim 2004) are not valid. Therefore, to compute test information for the ADNI-EF, we simulated multiple response patterns based on a range of underlying true values of the latent trait represented by ADNI-EF. We computed the maximum likelihood estimates (MLE) of ADNI-EF for each of the simulated response patterns. The inverse of the variance of the MLEs at each of the underlying values forms a measure of how precisely the collection of ADNI items can measure an individual’s EF. Further information on the methods is available from the authors.
Measure validation
We conducted all validation and exploratory analyses in Stata 12 (StataCorp 2011). We compared ADNI-EF with the sum of the Category Fluency items, the sum of the Clock Drawing items, WAIS-R Digit Symbol Substitution total correct score, Digit Span Backwards total score, Trails A and B separately, and Trails B minus Trails A. If Trails B was less than Trails A, we set the difference to zero. The Trails A and B times, and their difference, were multiplied by −1 so that a higher score represented better cognition for all measures.
We conducted three sets of validation analyses in which we compared ADNI-EF with other measures of EF. We limited our primary validation analyses to participants with MCI at baseline, because we were interested in conversion to dementia and because there were only minor EF deficits in the NC. We converted visit month to years for use as the measure of time. For direct comparison, we standardized all EF measures to a mean of zero and a SD of one.
For our first validation analysis, we assessed the ability of the measures to detect change in cognition over time. We used mixed models with random intercepts and slopes and an unstructured covariance matrix, controlling for age, education, sex and the presence of one or more APOE ε4 alleles. We compared the resulting z-statistics (coefficient/standard error) for year. Residual graphs were used to indicate potential problems with model fit. We used the coefficient for year and the adjusted residual standard deviation from each model to determine sample sizes needed to detect a 25 % reduction in the average rate of decline in 12 months, with 80 % power and alpha=0.05, two-sided. This approach answers the question: If the estimated average rate of annual decline, given other covariates, is 1 unit per year, how many participants per group would be needed to detect an average decline of only 0.75 units/year?
Second, we assessed the ability of the EF measures to predict conversion from MCI to AD. We used accelerated failure time models of time to AD, with a Weibull distribution. We controlled for age, education, sex and the presence of one or more APOE ε4 alleles. We evaluated baseline EF as a predictor of any subsequent AD, and we also evaluated EF from the preceding visit as a predictor of AD at the current visit. We assessed model fit using graphical methods based on Cox-Snell residuals.
Third, we assessed the association of baseline EF with MRI parameters derived from selected brain regions. We used regression models predicting EF, controlling for age, education, sex, one or more APOE ε4 alleles, and intracranial volume, comparing z-statistics for the MRI predictor. White matter hyperintensities were transformed to the log scale. Robust standard errors were used in all models, as the assumption of homoscedastic residuals was not met for some models
Exploratory analyses
We assessed the association of EF measures with measures of Aβ, tau, p-tau, and the CSF-derived AD-signature at baseline in regression models for EF, controlling for age, education, sex, and presence of any APOE ε4 alleles, with robust standard errors. The CSF measures were dichotomized as in Shaw (Shaw et al. 2009). We compared z-statistics for the CSF measures.
We also performed analyses of rates of change and of strength of association with imaging and CSF signatures among the NC and AD. We considered these exploratory rather than validation analyses because we did not expect all of the analyses to be significant in these groups.
Results
Fit for the final bifactor model shown in Fig. 1 was excellent. The CFI was 0.99, the TLI was 0.99, and the RMSEA was 0.049. The test information for ADNI-EF is shown in Fig. 2. The curve indicates that there is measurement precision across a broad spectrum of EF ability. The curve peaks just above 7, which corresponds to a reliability of about 0.85 for those levels of EF, and is above 4 (reliability of 0.75) for all but the most extreme levels of EF.
Fig. 2.
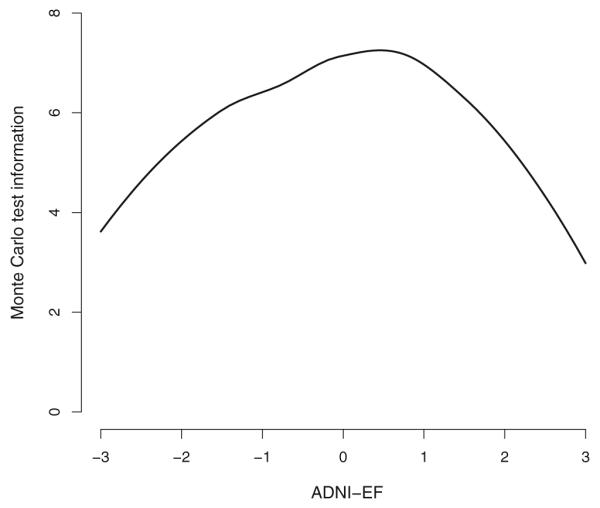
ADNI-EF test information, derived using a Monte Carlo approximation. The curve indicates that there is measurement precision across a broad spectrum of EF ability
No individual measure out-performed ADNI-EF in the three sets of validation analyses. ADNI-EF showed the most change over time, followed by Category Fluency (Table 2). All models had acceptable fit. Sample sizes required to detect a 25 % decrease in average annual change ranged from 2218 per group for the ADNI-EF to over 40,000 for Clock Drawing.
Table 2.
Z-statistics for time from mixed models for the EF outcomes, controlling for age, education, gender, and any APOE-ε4 alleles. Sample size needed per group to detect a 25 % decrease in average annual change, with 80 % power and alpha=0.05, two-sided
| EF score | Time | N per groupb |
|---|---|---|
| ADNI-EF | −9.77 | 2218 |
| Category Fluency | −9.15 | 3808 |
| Clock Drawing | −3.42 | 41,884 |
| WAIS-R Digit Symbol | −6.85 | 6095 |
| Digit Span Backwards | −4.13 | 32,162 |
| Trails Aa | −6.59 | 7798 |
| Trails Ba | −8.17 | 5082 |
| Trails B–Trails Aa | −6.23 | 11,187 |
Trails scores were reversed so higher scores are better for all outcomes
Sample size calculations are based on the coefficient for year and the adjusted residual standard deviation from the full model. As such, they do not directly correspond to the z-statistics
ADNI-EF and WAIS-R Digit Symbol were the strongest baseline predictors of conversion to AD (Table 3). Clock Drawing, WAIS-R Digit Symbol Substitution, and Trails A, B and the difference between Trails A and B also had significant effects. ADNI-EF was also the strongest previous-visit predictor of conversion, though several other scores were nearly as strong. All models had acceptable fit.
Table 3.
Standardized time ratios (TR), with 95 % confidence intervals (CI), for predicting conversion to dementia, controlling for age, education, gender and any APOE-ε4 alleles. Ratios greater than one indicate a longer survival time
| EF score | Baseline TR (95 % CI) |
Previous Visit TR (95 % CI) |
|---|---|---|
| ADNI-EF | 1.30 (1.16, 1.45) | 1.36 (1.22, 1.50) |
| Category Fluency | 1.13 (1.01, 1.26) | 1.27 (1.14, 1.41) |
| Clock Drawing | 1.18 (1.09, 1.29) | 1.21 (1.11, 1.32) |
| WAIS-R Digit Symbol | 1.26 (1.14, 1.40) | 1.26 (1.15, 1.39) |
| Digit Span Backwards | 1.02 (0.92, 1.12) | 1.05 (0.95, 1.15) |
| Trails Aa | 1.16 (1.06, 1.28) | 1.14 (1.05, 1.24) |
| Trails Ba | 1.20 (1.09, 1.32) | 1.29 (1.18, 1.41) |
| Trails B–Trails Aa | 1.17 (1.06, 1.29) | 1.28 (1.17, 1.39) |
Trails scores were reversed so higher scores are better for all outcomes.
ADNI-EF was the only measure significantly associated with each of the MRI measures, and was the most strongly associated with thickness of the lateral orbito-frontal cortex (Table 4). WAIS-R Digit Symbol had the strongest association with WMH, and Clock Drawing had the strongest association with the thickness of the caudal middle frontal region. The difference between Trails A and B had somewhat stronger associations than ADNI-EF with the thickness of the rostral and superior middle frontal regions and of the pars-triangularis.
Table 4.
Z-statistics for MRI white matter hyper-intensities volume and cortical thickness measures from regression models for the EF outcomes, controlling for age, education, gender, any APOE-ε4 alleles, and intracranial volume. Bolded coefficients indicate p-values <0.05
| EF score | White Matter Hyper-intensities |
Caudal Middle Frontal |
Rostral Middle Frontal |
Superior Middle Frontal |
Lateral Orbito-frontal |
Medial Orbito-Frontal |
Pars- triangularis |
|---|---|---|---|---|---|---|---|
| ADNI-EF | −2.09 | 2.29 | 3.52 | 2.88 | 3.80 | 2.34 | 2.61 |
| Category Fluency | −0.58 | 1.14 | 2.01 | 1.91 | 3.24 | 2.58 | 2.19 |
| Clock Drawing | 1.00 | 3.14 | 3.12 | 2.97 | 2.49 | 1.66 | 1.73 |
| WAIS-R Digit Symbol | −2.31 | 1.23 | 2.52 | 2.23 | 2.94 | 1.88 | 1.30 |
| Digit Span Backwards | −1.61 | 0.05 | 1.47 | −0.11 | 1.44 | 1.29 | 0.61 |
| Trails Aa | −0.56 | 1.20 | 1.05 | 0.24 | 1.20 | 0.36 | 0.82 |
| Trails Ba | −1.71 | 2.83 | 3.56 | 2.85 | 3.14 | 1.47 | 3.01 |
| Trails B–Trails Aa | −1.77 | 2.88 | 3.73 | 3.14 | 3.21 | 1.56 | 3.03 |
Trails scores were reversed so higher scores are better for all outcomes
ADNI-EF was most strongly associated with two of the four CSF measures (Table 5), and was significantly associated with all four. The only other measures to have significant associations with all four measures were WAIS-R Digit Symbol and Trails A. Clock Drawing and Digit Span Backwards were not significantly associated with any of the CSF measures.
Table 5.
Z-statistics for baseline CSF measures from regression models for the EF outcomes, controlling for age, education, gender and any APOE-ε4 alleles. Bolded coefficients indicate p-values <0.05
| EF score | Aβ<192 | Total tau<93 | P-tau<23 | AD Signature |
|---|---|---|---|---|
| ADNI-EF | −4.47 | −2.65 | −3.72 | −4.39 |
| Category Fluency | −1.94 | −1.14 | −2.04 | −2.15 |
| Clock Drawing | −1.06 | −1.00 | −0.82 | −0.77 |
| WAIS-R Digit Symbol | −4.64 | −2.46 | −3.19 | −4.51 |
| Digit Span Backwards | −1.17 | −0.24 | −0.20 | −0.47 |
| Trails Aa | −3.92 | −1.94 | −2.98 | −3.85 |
| Trails Ba | −3.09 | −0.95 | −2.32 | −3.05 |
| Trails B–Trails Aa | −2.16 | −0.33 | −1.49 | −2.11 |
Trails scores were reversed so higher scores are better for all outcomes
Results for the NC and AD are shown in Online Appendix 3. In NC, none of the EF measures declined over time; many actually appeared to show improvement over time. Only one of the measures was significantly associated with any of the MRI regions, fewer than would be expected by chance. ADNI-EF, WAIS-R Digit Symbol, Trails B, and Trails difference all had one or two significant associations with the CSF measures, but none was clearly superior.
In AD, all of the EF measures declined over time. ADNI-EF showed the greatest change over time, reflected in sample sizes needed to detect 25 % reductions in average annual change in EF that were one-third less than the next largest sample size. Trails A had significant relationships with 5 of the 7 MRI measures, while ADNI-EF and Category Fluency had four, and WAIS-R Digit Symbol and Trails B had one (Caudal Middle Frontal). None of the CSF relationships was significant.
Discussion
We developed ADNI-EF, a composite measure of EF, using modern psychometric theory. We performed three sets of primary analyses to compare the validity of our composite score with respect to other measures of EF, among people with MCI. ADNI-EF performed as well as or better than all of the other measures of EF in detecting change over time and predicting dementia, and was the only measure significantly associated with WMH and the cortical thickness all of the frontal lobe regions we evaluated.
The items composing ADNI-EF were chosen based on neuropsychological theory, and handled with careful statistical consideration. We did not use strength of association with external criteria either to select the indicators included in ADNI-EF or to provide weights for the items (Llano et al. 2011); only the covariation of the EF indicators themselves had any role in determining the scoring weights. A practical benefit of constructing a composite using psychometric theory is that the score lends itself well to data analysis. Unlike any of the individual tests that make up ADNI-EF, ADNI-EF scores are normally distributed, with interval scaling properties such that a one point change means the same thing at any ability level. This is especially useful for change over time analyses. In contrast, for example, Trails B has a skewed distribution, with a ceiling effect at 300 s, and it is unknown if a change from 60 to 90 s represents the same decrement as a change from 90 to 120 s.
While the shape of the information curve for ADNI-EF is good, ideally we would like a higher degree of measurement precision throughout. An ideal information curve for measuring change over time would be above 12 (reliability 0.92) for all levels of EF. Additional items would be needed to achieve that precision, but the ADNI neuropsychological battery did not include the EF items that would be needed to develop such a test. Achieving better reliability would require an expanded item pool.
One of the benefits of using a composite is that it combines elements from each of its constituent parts. Based on our analyses, it would be difficult to pick an individual component test as the “best” measure of EF for all purposes. In many cases, results were very similar across the component tests. Nevertheless, of the individual tests, Category Fluency was most responsive to change over time, WAIS-R Digit Symbol was the strongest baseline predictor of dementia, Trails B was the strongest previous-visit predictor of dementia, and Trails Difference, Clock Drawing, and Category Fluency were most strongly associated with the MRI parameters. The ADNI-EF composite was a more robust measure, allowing a 40 % reduction in sample size, doing slightly better than any of the individual tests at predicting dementia, and being most consistently associated with thickness of frontal lobe cortical regions measured by MRI. Taken together, these analyses provide strong support for the use of ADNI-EF among people with MCI.
A potential concern about ADNI-EF is that it includes components that may not be pure measures of frontal system-mediated executive function. This raises an important question about construct validity. Is the ADNI-EF composite a theoretically valid alternative to more specific, widely-used tests like Trails B? The range of analyses we performed suggests that ADNI-EF is at least as good as other measures in detecting AD-related changes in individuals with MCI. This may be a reflection of the relatively diffuse impairment associated with AD, and it is possible that this composite measure might not be ideal for other disorders such as focal frontal lobe lesions.
A model by Jack et al. proposed, in brief, that progression towards dementia would be picked up first in the CSF biomarkers, next in brain structure, and lastly in clinical measures (Jack et al. 2010). However, to date, a single study has assessed the relationship between CSF and EF using a composite score (Rolstad et al. 2011). Consistent with this model and with our results, they found cross-sectional associations between a speed/EF composite and both tau and Aβ among people with MCI. In our study, associations with the CSF biomarkers were weaker across the board for NC and especially for people with AD, which again is what might be expected based on Jack et al.
The Jack et al. model is also useful in interpreting the other NC and AD exploratory analyses. As would be expected, we did not see decline in EF among people with NC, nor was there much of an association between EF and the MRI parameters, whether EF was assessed with ADNI-EF or with any of its components. We would expect decline among people with AD, and all of the EF measures showed large and statistically significant rates of decline in that group, with ADNI-EF showing the greatest responsiveness to change. The relationships with MRI were of similar but slightly lower magnitude to those found among people with MCI. Additional points about the NC and AD results are discussed in Appendix 3.
Several limitations should be noted. First, the ADNI sample was selected to mimic a clinical trial for MCI, so results may not generalize to groups of people not included in the study, such as people with higher degrees of vascular burden or people with more profound levels of cognitive impairment. Second, in the validation analyses, we repeatedly found that ADNI-EF had the strongest associations, but other tests were sometimes nearly as strong, and may have performed differently in another sample. No tests were done to establish any test as significantly better than any other using a statistical threshold. It should also be noted that we were limited to the neuropsychological tests included in the ADNI battery. A better measure of EF could likely be developed with a test battery arising from a theory (Miyake et al. 2000) or derived from an empirical perspective focused on increasing test information.
In conclusion, ADNI-EF appears to be a valid measure of EF among people with MCI in ADNI. In addition, ADNI-EF is better suited to most data analyses than any of the tests that comprise it. ADNI-EF scores are available online for analyses when a single, robust EF composite is needed in ADNI, and item parameters are available for use in other studies as well.
Supplementary Material
Acknowledgments
Els Coart and Hugo Vanderstichele provided data classifying ADNI subjects by the CSF-based AD signature of de Meyer et al. (2010).
Elizabeth Sanders made Fig. 1 and assisted with manuscript preparation.
Supported by grants R01 AG 029672 (P Crane), P50 AG05136 (Raskind), and R13 AG030995 (Mungas) from the National Institute on Aging, and K08MH081065 (Mackin) from the National Institute of Mental Health.
Data collection and sharing for this project was funded by the Alzheimer’s Disease Neuroimaging Initiative (ADNI) (National Institutes of Health Grant U01 AG024904). ADNI is funded by the National Institute on Aging, the National Institute of Biomedical Imaging and Bioengineering, and through generous contributions from the following: Abbott; Alzheimer’s Association; Alzheimer’s Drug Discovery Foundation; Amorfix Life Sciences Ltd.; AstraZeneca; Bayer HealthCare; BioClinica, Inc.; Biogen Idec Inc.; Bristol-Myers Squibb Company; Eisai Inc.; Elan Pharmaceuticals Inc.; Eli Lilly and Company; F. Hoffmann-La Roche Ltd and its affiliated company Genentech, Inc.; GE Healthcare; Innogenetics, N.V.; Janssen Alzheimer Immuno-therapy Research & Development, LLC.; Johnson & Johnson Pharmaceutical Research & Development LLC.; Medpace, Inc.; Merck & Co., Inc.; Meso Scale Diagnostics, LLC.; Novartis Pharmaceuticals Corporation; Pfizer Inc.; Servier; Synarc Inc.; and Takeda Pharmaceutical Company. The Canadian Institutes of Health Research is providing funds to support ADNI clinical sites in Canada. Private sector contributions are facilitated by the Foundation for the National Institutes of Health (www.fnih.org). The grantee organization is the Northern California Institute for Research and Education, and the study is coordinated by the Alzheimer’s Disease Cooperative Study at the University of California, San Diego. ADNI data are disseminated by the Laboratory of Neuro Imaging at the University of California, Los Angeles. This research was also supported by NIH grants P30 AG010129, K01 AG030514, and the Dana Foundation.
Footnotes
Conflict of interest The authors declare that they have no conflict of interest.
Electronic supplementary material The online version of this article (doi:10.1007/s11682-012-9176-1) contains supplementary material, which is available to authorized users.
Contributor Information
Laura E. Gibbons, Harborview Medical Center, University of Washington, Box 359780, 325 Ninth Avenue, Seattle, WA 98104, USA
Adam C. Carle, Cincinnati Children’s Hospital Medical Center, University of Cincinnati School of Medicine and University of Cincinnati College of Arts and Sciences, 3333 Burnet Avenue, MLC 7014, Cincinnati, OH 45229, USA
R. Scott Mackin, Center for Imaging of Neurodegenerative Diseases (CIND), San Francisco VA Medical Center, 4150 Clement Street, San Francisco, CA 94121, USA.
Danielle Harvey, Division of Biostatistics, Department of Public Health Sciences, University of California, One Shields Avenue, Davis, CA 95616, USA.
Shubhabrata Mukherjee, Harborview Medical Center, University of Washington, Box 359780, 325 Ninth Avenue, Seattle, WA 98104, USA.
Philip Insel, Center for Imaging of Neurodegenerative Diseases (CIND), San Francisco VA Medical Center, 4150 Clement Street, San Francisco, CA 94121, USA.
S. McKay Curtis, Harborview Medical Center, University of Washington, Box 359780, 325 Ninth Avenue, Seattle, WA 98104, USA.
Dan Mungas, Department of Neurology, UC Davis Medical Center, 4860 Y Street, Sacramento, CA 95817, USA.
Paul K. Crane, Harborview Medical Center, University of Washington, Box 359780, 325 Ninth Avenue, Seattle, WA 98104, USA
References
- Alvarez JA, Emory E. Executive function and the frontal lobes: a meta-analytic review. Neuropsychology Review. 2006;16(1):17–42. doi: 10.1007/s11065-006-9002-x. doi:10.1007/s11065-006-9002-x. [DOI] [PubMed] [Google Scholar]
- Baker FB, Kim S-H. Item response theory: Parameter estimation techniques. 2nd ed CRC Press; New York: 2004. [Google Scholar]
- Cahn-Weiner DA, Boyle PA, Malloy PF. Tests of executive function predict instrumental activities of daily living in community-dwelling older individuals. Applied Neuropsychology. 2002;9(3):187–191. doi: 10.1207/S15324826AN0903_8. doi:10.1207/S15324826AN0903_8. [DOI] [PubMed] [Google Scholar]
- Cardenas VA, Chao LL, Studholme C, Yaffe K, Miller BL, Madison C, et al. Brain atrophy associated with baseline and longitudinal measures of cognition. Neurobiology of Aging. 2011;32(4):572–580. doi: 10.1016/j.neurobiolaging.2009.04.011. doi:10.1016/j.neurobiolaging.2009.04.011. [DOI] [PMC free article] [PubMed] [Google Scholar]
- Carmichael O, Mungas D, Beckett L, Harvey D, Tomaszewski Farias S, Reed B, et al. MRI predictors of cognitive change in a diverse and carefully characterized elderly population. Neurobiology of Aging. 2010 doi: 10.1016/j.neurobiolaging.2010.01.021. doi:10.1016/j.neurobiolaging.2010.01.021. [DOI] [PMC free article] [PubMed] [Google Scholar]
- Carmichael O, Schwarz C, Drucker D, Fletcher E, Harvey D, Beckett L, et al. Longitudinal changes in white matter disease and cognition in the first year of the Alzheimer disease neuroimaging initiative. Archives of Neurology. 2010;67(11):1370–1378. doi: 10.1001/archneurol.2010.284. doi:10.1001/archneurol.2010.284. [DOI] [PMC free article] [PubMed] [Google Scholar]
- Chang YL, Jacobson MW, Fennema-Notestine C, Hagler DJ, Jr., Jennings RG, Dale AM, et al. Level of executive function influences verbal memory in amnestic mild cognitive impairment and predicts prefrontal and posterior cingulate thickness. Cerebral Cortex. 2010;20(6):1305–1313. doi: 10.1093/cercor/bhp192. doi:10.1093/cercor/bhp192. [DOI] [PMC free article] [PubMed] [Google Scholar]
- Crane PK, Narasimhalu K, Gibbons LE, Pedraza O, Mehta KM, Tang Y, et al. Composite scores for executive function items: demographic heterogeneity and relationships with quantitative magnetic resonance imaging. Journal of the International Neuropsychological Society: JINS. 2008;14(5):746–59. doi: 10.1017/S1355617708081162. doi:10.1017/S1355617708081162. [DOI] [PMC free article] [PubMed] [Google Scholar]
- De Meyer G, Shapiro F, Vanderstichele H, Vanmechelen E, Engelborghs S, De Deyn PP, et al. Diagnosis-independent Alzheimer disease biomarker signature in cognitively normal elderly people. Archives of Neurology. 2010;67(8):949–956. doi: 10.1001/archneurol.2010.179. doi:10.1001/archneurol.2010.179. [DOI] [PMC free article] [PubMed] [Google Scholar]
- Ewers M, Walsh C, Trojanowski JQ, Shaw LM, Petersen RC, Jack CR, Jr., et al. Prediction of conversion from mild cognitive impairment to Alzheimer’s disease dementia based upon biomarkers and neuropsychological test performance. Neurobiology of Aging. 2010 doi: 10.1016/j.neurobiolaging.2010.10.019. doi:10.1016/j.neurobiolaging.2010.10.019. [DOI] [PMC free article] [PubMed] [Google Scholar]
- Farias ST, Mungas D, Reed BR, Harvey D, DeCarli C. Progression of mild cognitive impairment to dementia in clinic- vs community-based cohorts. Archives of Neurology. 2009;66(9):1151–1157. doi: 10.1001/archneurol.2009.106. doi:10.1001/archneurol.2009.106. [DOI] [PMC free article] [PubMed] [Google Scholar]
- Farias ST, Mungas D, Reed B, Carmichael O, Beckett L, Harvey D, et al. Maximal brain size remains an important predictor of cognition in old age, independent of current brain pathology. Neurobiology of Aging. 2011 doi: 10.1016/j.neurobiolaging.2011.03.017. doi:10.1016/j.neurobiolaging.2011.03.017. [DOI] [PMC free article] [PubMed] [Google Scholar]
- Gomar JJ, Bobes-Bascaran MT, Conejero-Goldberg C, Davies P, Goldberg TE. Utility of combinations of biomarkers, cognitive markers, and risk factors to predict conversion from mild cognitive impairment to Alzheimer disease in patients in the Alzheimer’s disease neuroimaging initiative. Archives of General Psychiatry. 2011;68(9):961–969. doi: 10.1001/archgenpsychiatry.2011.96. doi:10.1001/archgenpsychiatry.2011.96. [DOI] [PubMed] [Google Scholar]
- Goodglass H, Kaplan D. The assessment of aphasia and related disorders. 2nd ed Lea & Febiger; Philadelphia: 1983. [Google Scholar]
- Grambaite R, Selnes P, Reinvang I, Aarsland D, Hessen E, Gjerstad L, et al. Executive Dysfunction in Mild Cognitive Impairment is Associated with Changes in Frontal and Cingulate White Matter Tracts. Journal of Alzheimer’s Disease: JAD. 2011 doi: 10.3233/JAD-2011-110290. doi:10.3233/JAD-2011-110290. [DOI] [PubMed] [Google Scholar]
- Jack CR, Jr., Bernstein MA, Fox NC, Thompson P, Alexander G, Harvey D, et al. The Alzheimer’s Disease Neuroimaging Initiative (ADNI): MRI methods. J Magn Reson Imaging. 2008;27(4):685–691. doi: 10.1002/jmri.21049. doi:10.1002/jmri.21049. [DOI] [PMC free article] [PubMed] [Google Scholar]
- Jack CR, Jr., Knopman DS, Jagust WJ, Shaw LM, Aisen PS, Weiner MW, et al. Hypothetical model of dynamic biomarkers of the Alzheimer’s pathological cascade. Lancet Neurology. 2010;9(1):119–128. doi: 10.1016/S1474-4422(09)70299-6. doi:10.1016/S1474-4422(09)70299-6. [DOI] [PMC free article] [PubMed] [Google Scholar]
- Li Y, Bolt DM, Fu J. A comparison of alternative models for testlets. Applied Psychological Measurement. 2006;30(1):3–21. [Google Scholar]
- Llano DA, Laforet G, Devanarayan V. Derivation of a new ADAS-cog composite using tree-based multivariate analysis: prediction of conversion from mild cognitive impairment to Alzheimer disease. Alzheimer Disease and Associated Disorders. 2011;25(1):73–84. doi: 10.1097/WAD.0b013e3181f5b8d8. doi:10.1097/WAD.0b013e3181f5b8d8. [DOI] [PubMed] [Google Scholar]
- Marra C, Ferraccioli M, Vita MG, Quaranta D, Gainotti G. Patterns of cognitive decline and rates of conversion to dementia in patients with degenerative and vascular forms of MCI. Current Alzheimer Research. 2011;8(1):24–31. doi: 10.2174/156720511794604552. [DOI] [PubMed] [Google Scholar]
- McDonald RP. Test theory: a unified treatment. Lawrence Erlbaum; Mahwah: 1999. [Google Scholar]
- McDonald CR, Gharapetian L, McEvoy LK, Fennema-Notestine C, Hagler DJ, Jr., Holland D, et al. Relationship between regional atrophy rates and cognitive decline in mild cognitive impairment. Neurobiology of Aging. 2010 doi: 10.1016/j.neurobiolaging.2010.03.015. doi:10.1016/j.neurobiolaging.2010.03.015. [DOI] [PMC free article] [PubMed] [Google Scholar]
- Miyake A, Friedman NP, Emerson MJ, Witzki AH, Howerter A, Wager TD. The unity and diversity of executive functions and their contributions to complex “Frontal Lobe” tasks: a latent variable analysis. Cognit Psychol. 2000;41(1):49–100. doi: 10.1006/cogp.1999.0734. [DOI] [PubMed] [Google Scholar]
- Mohs RC, Knopman D, Petersen RC, Ferris SH, Ernesto C, Grundman M, et al. Development of cognitive instruments for use in clinical trials of antidementia drugs: additions to the Alzheimer’s Disease Assessment Scale that broaden its scope. The Alzheimer’s Disease Cooperative Study. Alzheimer Disease and Associated Disorders. 1997;11(Suppl 2):S13–21. [PubMed] [Google Scholar]
- Morris JC, Heyman A, Mohs RC, Hughes JP, van Belle G, Fillenbaum G, et al. The Consortium to Establish a Registry for Alzheimer’s Disease (CERAD) Part I. Clinical and neuropsychological assessment of Alzheimer’s disease. Neurology. 1989;39(9):1159–1165. doi: 10.1212/wnl.39.9.1159. [DOI] [PubMed] [Google Scholar]
- Mungas D, Harvey D, Reed BR, Jagust WJ, DeCarli C, Beckett L, et al. Longitudinal volumetric MRI change and rate of cognitive decline. Neurology. 2005;65(4):565–571. doi: 10.1212/01.wnl.0000172913.88973.0d. doi:10.1212/01.wnl.0000172913.88973.0d. [DOI] [PMC free article] [PubMed] [Google Scholar]
- Mungas D, Beckett L, Harvey D, Farias ST, Reed B, Carmichael O, et al. Heterogeneity of cognitive trajectories in diverse older persons. Psychology and Aging. 2010;25(3):606–619. doi: 10.1037/a0019502. doi:10.1037/a0019502. [DOI] [PMC free article] [PubMed] [Google Scholar]
- Muthén LK, Muthén BO. Mplus: statistical analysis with latent variables. 5.1 ed Muthén & Muthén; Los Angeles, CA: 1998–2007. [Google Scholar]
- Nordlund A, Rolstad S, Klang O, Lind K, Pedersen M, Blennow K, et al. Episodic memory and speed/attention deficits are associated with Alzheimer-typical CSF abnormalities in MCI. Journal of the International Neuropsychological Society: JINS. 2008;14(4):582–590. doi: 10.1017/S135561770808079X. doi:10.1017/S135561770808079X. [DOI] [PubMed] [Google Scholar]
- Nordlund A, Rolstad S, Gothlin M, Edman A, Hansen S, Wallin A. Cognitive profiles of incipient dementia in the Goteborg MCI study. Dementia and Geriatric Cognitive Disorders. 2010;30(5):403–410. doi: 10.1159/000321352. doi:10.1159/000321352. [DOI] [PubMed] [Google Scholar]
- Parks CM, Iosif AM, Farias S, Reed B, Mungas D, DeCarli C. Executive function mediates effects of white matter hyperintensities on episodic memory. Neuropsychologia. 2011;49(10):2817–2824. doi: 10.1016/j.neuropsychologia.2011.06.003. doi:10.1016/j.neuropsychologia.2011.06.003. [DOI] [PMC free article] [PubMed] [Google Scholar]
- Petersen RC, Aisen PS, Beckett LA, Donohue MC, Gamst AC, Harvey DJ, et al. Alzheimer’s Disease Neuroimaging Initiative (ADNI): clinical characterization. Neurology. 2010;74(3):201–209. doi: 10.1212/WNL.0b013e3181cb3e25. doi:10.1212/WNL.0b013e3181cb3e25. [DOI] [PMC free article] [PubMed] [Google Scholar]
- Reeve BB, Hays RD, Bjorner JB, Cook KF, Crane PK, Teresi JA, et al. Psychometric evaluation and calibration of health-related quality of life item banks: plans for the Patient-Reported Outcomes Measurement Information System (PROMIS) Medical Care. 2007;45(5 Suppl 1):S22–31. doi: 10.1097/01.mlr.0000250483.85507.04. [DOI] [PubMed] [Google Scholar]
- Reitan RM, Wolfson D. The Halstead-Reitan neuropsychological test battery. Neuropsychology Press; Tucson: 1985. [Google Scholar]
- Rolstad S, Berg AI, Bjerke M, Blennow K, Johansson B, Zetterberg H, et al. Amyloid-beta is associated with cognitive impairment in healthy elderly and subjective cognitive impairment. Journal of Alzheimer’s Disease: JAD. 2011;26(1):135–142. doi: 10.3233/JAD-2011-110038. doi:10.3233/JAD-2011-110038. [DOI] [PubMed] [Google Scholar]
- Salthouse TA. Relations between cognitive abilities and measures of executive functioning. Neuropsychology. 2005;19(4):532–545. doi: 10.1037/0894-4105.19.4.532. [DOI] [PubMed] [Google Scholar]
- Schwarz C, Fletcher E, DeCarli C, Carmichael O. Fully-automated white matter hyperintensity detection with anatomical prior knowledge and without FLAIR. Information Processing in Medical Imaging. 2009;21:239–251. doi: 10.1007/978-3-642-02498-6_20. [DOI] [PMC free article] [PubMed] [Google Scholar]
- Shaw LM, Vanderstichele H, Knapik-Czajka M, Clark CM, Aisen PS, Petersen RC, et al. Cerebrospinal fluid biomarker signature in Alzheimer’s disease neuroimaging initiative subjects. Annals of Neurology. 2009;65(4):403–413. doi: 10.1002/ana.21610. doi:10.1002/ana.21610. [DOI] [PMC free article] [PubMed] [Google Scholar]
- Smith EE, Salat DH, Jeng J, McCreary CR, Fischl B, Schmahmann JD, et al. Correlations between MRI white matter lesion location and executive function and episodic memory. Neurology. 2011;76(17):1492–1499. doi: 10.1212/WNL.0b013e318217e7c8. doi:10.1212/WNL.0b013e318217e7c8. [DOI] [PMC free article] [PubMed] [Google Scholar]
- StataCorp . Stata statistical software: release 12. StataCorp LP; College Station: 2011. [Google Scholar]
- Tabert MH, Manly JJ, Liu X, Pelton GH, Rosenblum S, Jacobs M, et al. Neuropsychological prediction of conversion to Alzheimer disease in patients with mild cognitive impairment. Archives of General Psychiatry. 2006;63(8):916–924. doi: 10.1001/archpsyc.63.8.916. doi:10.1001/archpsyc.63.8.916. [DOI] [PubMed] [Google Scholar]
- Trojanowski JQ, Vandeerstichele H, Korecka M, Clark CM, Aisen PS, Petersen RC, et al. Update on the biomarker core of the Alzheimer’s Disease Neuroimaging Initiative subjects. Alzheimer’s & Dementia: The Journal of the Alzheimer’s Association. 2010;6(3):230–238. doi: 10.1016/j.jalz.2010.03.008. doi:10.1016/j.jalz.2010.03.008. [DOI] [PMC free article] [PubMed] [Google Scholar]
- Wainer H, Bradlow ET, Wang X. Testlet response theory and its applications. Cambridge UP; NY: 2007. [Google Scholar]
- Wechsler D. Wechsler adult intelligence scale-revised. Psychological Corporation; San Antonio: 1981. [Google Scholar]
- Wechsler D. Wechsler memory scale-revised. Psychological Corporation; San Antonio: 1987. [Google Scholar]
Associated Data
This section collects any data citations, data availability statements, or supplementary materials included in this article.