

Abstract
Fragile X syndrome (FXS) is a debilitating neurodevelopmental disorder thought to arise from disrupted synaptic communication in several key brain regions, including the amygdala, a central processing center for information with emotional and social relevance. Recent studies reveal defects in both excitatory and inhibitory neurotransmission in mature amygdala circuits in Fmr1−/y mutants, the animal model of FXS. However, whether these defects are the result of altered synaptic development or simply faulty mature circuits remains unknown. Using a combination of electrophysiological and genetic approaches, we show the development of both presynaptic and postsynaptic components of inhibitory neurotransmission in the FXS amygdala is dynamically altered during critical stages of neural circuit formation. Surprisingly, we observe that there is a homeostatic correction of defective inhibition, which, despite transiently restoring inhibitory synaptic efficacy to levels at or beyond those of control, ultimately fails to be maintained. Using inhibitory interneuron-specific conditional knock-out and rescue mice, we further reveal that fragile X mental retardation protein function in amygdala inhibitory microcircuits can be segregated into distinct presynaptic and postsynaptic components. Collectively, these studies reveal a previously unrecognized complexity of disrupted neuronal development in FXS and therefore have direct implications for establishing novel temporal and region-specific targeted therapies to ameliorate core amygdala-based behavioral symptoms.
Introduction
Defects underlying neurodevelopmental disorders, including fragile X syndrome (FXS), are widely believed to lie at the level of the synapse (Zoghbi, 2003; Ebert and Greenberg, 2013). In FXS, these profound changes include alterations in both excitatory and inhibitory neurotransmission across multiple brain regions, including the amygdala (Huber et al., 2002; Bear et al., 2004; Olmos-Serrano et al., 2010). Excitatory synaptic transmission in FXS is strongly altered by misregulated metabotropic glutamate receptor signaling, a phenomenon observed widely throughout the brain (Desai et al., 2006; Wilson and Cox, 2007; Pilpel et al., 2009; Zhang et al., 2009; Suvrathan et al., 2010). In addition to these defects, a growing body of evidence has revealed complementary and profound defects in inhibitory neurotransmission (Centonze et al., 2008; Gibson et al., 2008). In the amygdala, our previous work revealed significant decreases in GABA production and the numbers of inhibitory synapses (Olmos-Serrano et al., 2010).
Defects in neuronal communication in the FXS brain most likely stem from altered processes of synaptogenesis and circuit formation. This is supported by studies of Fmr1−/y knock-out (KO) mice. For example, in the cerebral cortex, the morphological immaturity that characterizes adult excitatory neurons suggests alterations in synaptic maturation and pruning (Comery et al., 1997). Indeed, dynamic analysis of spine formation in mutant layer V barrel cortex pyramidal neurons revealed similar abnormalities at critical periods of synaptogenesis (Nimchinsky et al., 2001). Consistent with these developmental defects, critical period barrel cortex plasticity is altered in Fmr1−/y mutants and coincides with a persistence in the number of NMDA-receptor-dominated silent synapses, an indicator that this circuit may fail to properly mature (Harlow et al., 2010). Together, these studies suggest that fragile X mental retardation protein (FMRP) plays a crucial role in processes required for the maturation of excitatory neurons.
However, the processes that lead to the establishment of synaptic defects with regard to inhibitory neurotransmission and in relevant regions, such as the amygdala, remain unexplored. In this study, we directly address this question by examining the developmental progression of GABAergic inhibitory neurotransmission in the basolateral nucleus of the amygdala (BLA) during the critical window of synaptogenesis. We find that the development of inhibitory neurotransmission in the Fmr1−/y mutant BLA is dramatically altered in a complex manner. Underlying these changes are deficiencies in both key presynaptic and postsynaptic developmentally regulated processes, including production of synaptic GABA and GABAA receptor (GABAAR) maturation. Most strikingly, we find that, although GABA neurotransmission is initially decreased during early periods of synaptogenesis, at later times there is a transient increase in specific components of inhibitory synaptic function. Ultimately, however, this temporally restricted upregulation of inhibitory synaptic mechanisms fails to be maintained and inhibitory neurotransmission returns to deficient levels. Moreover, these defects can be genetically segregated into presynaptic and postsynaptic components based on whether or not FMRP expression is either specifically conditionally knocked out or rescued in inhibitory neurons. Together, these data reveal novel mechanisms of altered trajectories of abnormal development of amygdala inhibitory networks in FXS and also provide insight into the most efficacious therapeutic strategies for treating amygdala-based symptoms at different pediatric stages.
Materials and Methods
Animal use.
All experiments were performed under protocols approved by the Institutional Animal Care and Use Committee at Children's National Medical Center. Control Fmr1 and Fmr1−/y KO mice on the congenic FVB background were obtained from The Jackson Laboratory (stock #4828 and #4624). Conditional KO (Fmr1cKO) and conditional rescue (Fmr1cON) animals were maintained on the C57BL/6 background and generated by crossing male Dlx5/6Cre mice to female mice containing either a floxed portion of the Fmr1 gene to generate conditional KOs or a floxed Neo cassette interrupting the Fmr1 gene for conditional rescues (Mientjes et al., 2006). For conditional analyses, mice were genotyped (Transnetyx), and only males positive for Dlx5/6Cre and the conditional mutant alleles were selected for experiments. Male littermates positive only for Dlx5/6Cre and that did not contain the conditional mutant allele were used to rule out any effect of Cre expression alone.
Slice preparation.
Male mice were deeply anesthetized with CO2. Brains were removed and placed in oxygenated ice-cold sucrose slicing solution (in mm: 234 sucrose, 11 glucose, 26 Na2HCO4·H2O, 2.5 KCl, 1.25 NaH2PO4·H2O, 10 MgSO4·7H2O, and 0.5 CaCl2·H2O) for 1–2 min. Coronal slices (300 μm) containing the BLA were then incubated for 45–60 min in prewarmed (35°C) artificial CSF (aCSF) containing the following (in mm): 126 NaCl, 26 NaHCO3, 10 glucose, 2.5 KCl, 1.25 NaH2PO4·H2O, 2 MgCl2·7H2O, and 2 CaCl2·H2O. Slices were allowed to equilibrate to room temperature for ∼25 min after incubation.
Electrophysiology.
Slices were visualized using a fixed-stage upright microscope (Olympus BX61WI) outfitted with 4× air and 60× water-immersion objectives. Cells were identified under bright-field illumination with the aid of a CCD camera (Hamamatsu) and Slidebook imaging software package (Intelligent Imaging Innovations). All recordings were performed at room temperature (21–22°C), and slices were continuously perfused with oxygenated aCSF. Similar to our previous study, the reason for room temperature experiments is for identification and proper decay analysis of isolated IPSCs during periods of high frequency and in the presence of agonists that elongate IPSCs (Olmos-Serrano et al., 2010). Whole-cell patch-clamp recordings were made using pipettes with resistances in the range of 2.0–3.5 MΩ. Recordings were made using a Multiclamp 700A amplifier (Molecular Devices). Data were collected at a sampling frequency of 10 kHz, digitized, and acquired using custom-written programs in pClamp10 (Molecular Devices). Principal excitatory neurons in the BLA were initially identified visually by their large cell bodies. When not in the presence of tetrodotoxin (TTX), cell identification was confirmed by injecting short, 600 ms hyperpolarizing and depolarizing pulses while in current-clamp mode as described previously (Olmos-Serrano et al., 2010). Spontaneous IPSCs (sIPSCs) and miniature IPSCs (mIPSCs) were recorded using an intracellular solution containing the following (in mm): 70 K-gluconate, 70 KCl, 10 HEPES, 10 EGTA, 2 MgCl2, 4 Mg-ATP, and 0.3 Na-GTP, equilibrated to pH 7.3 (290 mOsm). Inhibitory currents from principal cells were voltage clamped at −70 mV and isolated by blocking ionotropic glutamatergic synaptic transmission by inclusion of 20 μm 6,7-dinitroquinoxaline-2,3-dione and 50 μm dl-2-amino-5-phosphonopentanoic acid (both obtained from Tocris Biosciences) to the continuously circulating aCSF. The perfusion rate was ∼2 ml/min. For recordings of mIPSCs, 1 μm TTX (Alomone Labs) was added to the bath to block sodium action potentials. In some cases, the frequency of mIPSCs were not lower than sIPSC frequency because the slices are typically quiescent and recordings were obtained at room temperature. Additional drugs used when indicated included the following (final concentrations): 200 nm zolpidem, 100 nm clonazepam, 1 μm NO-711 (1-[2([(diphenylmethylene)imino]oxy)ethyl]-1,2,5,6-tetrahydro-3-pyridinecarboxylic acid hydrochloride), and 100 μm (1,2,5,6-tetrahydropiridin-4-yl) methylphosphonic acid (TPMPA), all acquired from Tocris Biosciences. All recordings were continuous with 5 min predrug, 5 min drug wash-in, and 5 min washout. A wash-in time of 3 min was observed before “drug IPSCs” were collected for analysis. For analyses of biophysical recordings, each distribution of values was first tested for normality using the Shapiro–Wilk test. Based on these results, a parametric two-tailed heteroscedastic t test or a nonparametric Mann–Whitney U test were used to determine the statistical significance between normally and non-normally distributed groups, respectively. The Bonferroni's method was used to adjust the α values in these tests to correct for multiple comparisons of cells across different ages/conditions.
Data analyses.
Individual synaptic events were identified visually using prewritten routines in pClamp10 (Molecular Devices). Averaged sIPSCs or mIPSCs were fitted using a double exponential: f(t) = Afaste−t/τfast − Aslowe−t/τslow. Fitted traces were used to determine the weighted decay time constant: τd,w = [(Afast × τfast) + (Aslow × τslow)]/(Afast + Aslow). Drug “enhancement” measures were calculated by taking the difference between the decay constant measured before drug application and that measured during drug application and are expressed as the percentage difference.
For mIPSC quantal analysis (see Fig. 5), amplitudes were binned into 5 pA bins and plotted as histograms. The fitting function was determined using a least-squares algorithm (Edwards et al., 1990). Fifty to 60 iterations of the algorithm were run to identify the fitting with the minimum error function between the histogram peaks and fitting function (>1.5%). The resulting function was deconvolved into separate underlying Gaussian functions. The number of Gaussian functions was determined for each cell, and differences in the average number of Gaussians between mutant and control at each different age were assessed using two-sample Mann–Whitney U test. Peak-scaled nonstationary noise analysis was conducted as described previously (De Koninck and Mody, 1994). Briefly, the average of all mIPSC events was calculated and normalized to the peak of each individual event. These normalized averages were subtracted from the individual event waveforms, and the remaining current amplitudes were binned into 5 pA bins. The mean current (Im) and variance (σ2) were calculated for each bin. The variance was plotted versus the mean current, and the resulting distribution was fitted using the parabolic equation: σ2 = iIm − Im2/N, where i is the unitary current, and N is the number of postsynaptic receptors. All fitting and statistical analyses were performed using custom-written routines in MATLAB (MathWorks).
Figure 5.
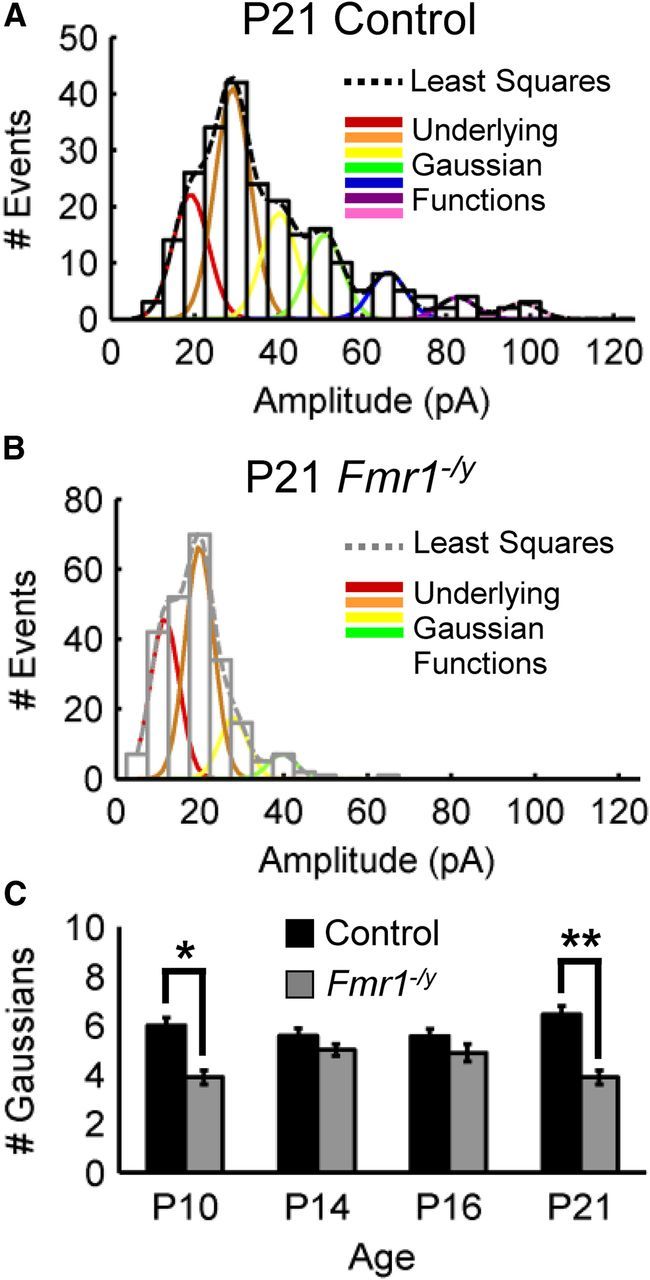
mIPSC quantal analysis reveals smaller postsynaptic GABAAR patch sizes in Fmr1−/y inhibitory synapses. A, B, Representative mIPSC amplitude histograms for control (A) and Fmr1−/y (B) at P10, P14, P16, and P21. Dashed lines demarcate the least-squares best-fit function. Underlying Gaussian functions are shown in colored lines. C, Summary of the number of deconvolved Gaussians across cells for control and Fmr1−/y at each corresponding age. Note that the average number of Gaussians was only significantly different between genotypes at P10 (*p < 0.05) and P21 (**p < 0.01).
Immunohistochemistry.
Mice were transcardially perfused with 4% paraformaldehyde. Brains were fixed overnight, and coronal sections of brains embedded in 4% agar (Thermo Fisher Scientific) were cut using a vibratome (Leica). For immunohistochemistry, the following antibodies were used: GAT1 (1:200; Abcam) and secondary antibodies for immunofluorescence (Cy3 at 1:1000; Jackson ImmunoResearch).
Results
Alterations in the development of inhibitory neurotransmission in the Fmr1−/y mutant amygdala
The biophysical properties of GABAAR-mediated inhibitory neurotransmission follow a stereotypical progression of changes over the course of the first 3 postnatal weeks that have been observed across several brain regions, including the cerebellum (Tia et al., 1996; Vicini et al., 2001), the hippocampus (Hollrigel and Soltesz, 1997), and the thalamus (Huntsman and Huguenard, 2000). During this time, sIPSCs recorded in rodent brain slices decrease in amplitude, increase in frequency, and exhibit faster decay kinetics. To determine whether this developmental pattern is similar in the amygdala and to test whether it is altered in Fmr1−/y mutant animals, sIPSCs were recorded from excitatory principal neurons in the BLA using the whole-cell patch-clamp technique at postnatal day 10 (P10), P14, P16, and P21, four key time points during this critical postnatal period of development. The developmental trajectory of sIPSCs in the control BLA follows that which has been observed in other brain regions (Fig. 1A; Table 1). However, sIPSCs from Fmr1−/y mutant neurons displayed dramatic differences compared with control at a number of ages explored. At P10, which represents earlier stages of synaptogenesis, sIPSC amplitude was decreased (Fig. 1B), as is sIPSC frequency (Fig. 1C). However, these alterations did not remain constant as development progresses, and sIPSC amplitude and frequency were surprisingly increased at P14 in Fmr1−/y mutants. In contrast, at P16, sIPSC amplitude returned to that observed in control, but frequency remained high. By P21, both sIPSC amplitude and frequency returned to below-control levels. The decay constant did not differ significantly from control at P14 and P16, yet it was increased at P10 and again at P21 (Fig. 1D).
Figure 1.

The development of inhibitory neurotransmission is dynamically altered in the Fmr1−/y mutant BLA. A, Recordings of sIPSCs recorded from BLA excitatory neurons. B–D, Histograms of pooled data for sIPSC biophysical parameters: amplitude (B), frequency (C), and decay constant (D). Mean ± SEM, sample sizes, and p values (Student's two-tailed t test vs control) are given in Table 1. *p < 0.05; **p < 0.01. E–G, Histograms of pooled data for mIPSC biophysical parameters: amplitude (E), frequency (F), and decay constant (G). Mean ± SEM, sample sizes, and p values are given in Table 1. Note that dynamic fluctuations in inhibitory function are observed over development.
Table 1.
Summary sIPSC/mIPSC amplitude, frequency, and decay values
| Genotype (n sIPSC/n mIPSC) | sIPSCs |
mIPSCs |
||||
|---|---|---|---|---|---|---|
| Amplitude (mean ± SEM pA) | Frequency (mean ± SEM Hz) | Decay constant (mean ± SEM ms) | Amplitude (mean ± SEM pA) | Frequency (mean ± SEM Hz) | Decay constant (mean ± SEM ms) | |
| P10 | ||||||
| Control (24/5) | 54.9 ± 3.1 | 1.1 ± 0.1 | 34.2 ± 1.3 | 43.1 ± 4.2 | 1.1 ± 0.2 | 29.5 ± 3.0 |
| Fmr1−/y (24/8) | 38.4 ± 3.6 | 0.65 ± 0.7 | 41.8 ± 2.7 | 30.9 ± 2.2 | 0.77 ± 0.2 | 30.6 ± 1.3 |
| p = 0.0006 | p = 0.0092 | p = 0.012 | p = 0.0095 | p = 0.0097 | p = 0.815 | |
| P14 | ||||||
| Control (30/7) | 38.3 ± 1.8 | 1.4 ± 0.2 | 35.2 ± 1.4 | 33.3 ± 0.2 | 1.8 ± 0.2 | 24.1 ± 1.1 |
| Fmr1−/y (14/9) | 53.3 ± 7.1 | 3.1 ± 0.6 | 34.2 ± 1.4 | 32.3 ± 3.2 | 1.8 ± 0.2 | 23.0 ± 0.8 |
| p = 0.0093 | p = 0.0010 | p = 0.689 | p = 0.831 | p = 0.889 | p = 0.401 | |
| P16 | ||||||
| Control (20/9) | 46.7 ± 2.1 | 1.1 ± 0.09 | 27.7 ± 1.0 | 24.7 ± 1.0 | 2.2 ± 0.2 | 20.7 ± 1.2 |
| Fmr1−/y (17/8) | 44.4 ± 3.0 | 2.0 ± 0.3 | 28.0 ± 1.0 | 28.1 ± 1.9 | 2.2 ± 0.3 | 20.1 ± 1.3 |
| p = 0.517 | p = 0.0036 | p = 0.831 | p = 0.126 | p = 0.919 | p = 0.710 | |
| P21 | ||||||
| Control (20/6) | 52.1 ± 4.9 | 3.5 ± 0.4 | 19.6 ± 0.9 | 19.0 ± 1.2 | 4.3 ± 0.6 | 17.8 ± 0.7 |
| Fmr1−/y (21/6) | 37.1 ± 3.0 | 2.5 ± 0.2 | 27.8 ± 0.8 | 13.5 ± 1.2 | 2.0 ± 0.1 | 17.8 ± 1.0 |
| p = 0.012 | p = 0.031 | p = 2.2 × 10⁻⁸ | p = 0.010 | p = 0.001 | p = 0.900 | |
Summary of sIPSC/mIPSC amplitude, frequency, and decay values. The number of cells (n) is listed in the first column with control cells and Fmr1−/y mutant cells. The values (mean ± SEM) for sIPSC/mIPSC amplitude, frequency, and decay constant are listed for P10, P14, P16, and P21 time points. A Student's two-tailed t test was performed, and p values are listed below the averaged value for each time point. p < 0.05 are shown in bold.
These dramatic differences in sIPSCs at different time points could be the result of alterations in processes dependent on and/or independent of action potential firing. To examine this, mIPSCs were examined in the presence of TTX (1 μm), which blocks action potentials. mIPSCs in control neurons exhibit the stereotypical developmental progression of decreased amplitude, increased frequency, and faster decay kinetics (Fig. 1E–G; Table 1). Similar to sIPSCs, at P10, mIPSC amplitude and frequency were significantly lower in Fmr1−/y mutant neurons compared with control. At P14, however, these differences were no longer observed. Similarly, no change was observed in either of these parameters at P16. By P21, mIPSC amplitude and frequency returned to levels below those of control. Similar to our previous studies (Olmos-Serrano et al., 2010), at P21, the mIPSC decay constant did not differ between the genotypes. Additionally, we see no differences at the other three time points, indicating that both receptor- and non-receptor-based alterations likely affect decay kinetics.
Collectively, these analyses also revealed that defects in inhibitory neurotransmission are present at P10, but this is followed by a transient restoration of inhibitory synaptic activity at P14–P16. At these ages, action-potential-independent Fmr1−/y mutant mIPSC frequencies are indistinguishable from control, whereas action-potential-dependent sIPSCs frequencies are increased, suggesting that the transient increase in inhibitory efficacy is at least in part attributable to increased firing of action potentials. By P21, however, both the activity-dependent and activity-independent increases are no longer present and inhibitory synaptic transmission in Fmr1−/y mutants is again reduced.
Alterations in presynaptic mechanisms affecting the amount of synaptic GABA production and release could also contribute to the dramatic changes in inhibitory neurotransmission that we observe in Fmr1−/y mutants. Relative levels of synaptic GABA can be examined using the competitive GABAAR antagonist TPMPA. The efficacy of this antagonist is inversely proportional to the concentration of GABA at the synapse (Barberis et al., 2005). Thus, a stronger decrease in mIPSC amplitude in the presence of TPMPA signifies a decreased level of synaptic GABA. In the presence of 100 μm TPMPA, a greater attenuation of mIPSC amplitude was observed in principal neurons from Fmr1−/y mutants at age P10 compared with control percentage change in mIPSC amplitude (Fig. 2; Table 2). Interestingly, this difference was not observed at P14 or P16 at which TPMPA reduced mIPSC amplitudes to the same degree in mutant and control. By P21, however, mIPSC amplitudes in Fmr1−/y cells were again more sensitive to TPMPA than control. Thus, at P10 and P21, there was a decrease in the concentration of GABA in the synapse in Fmr1−/y mutants, but, between P14 and P16, GABA levels transiently recovered to that of control.
Figure 2.
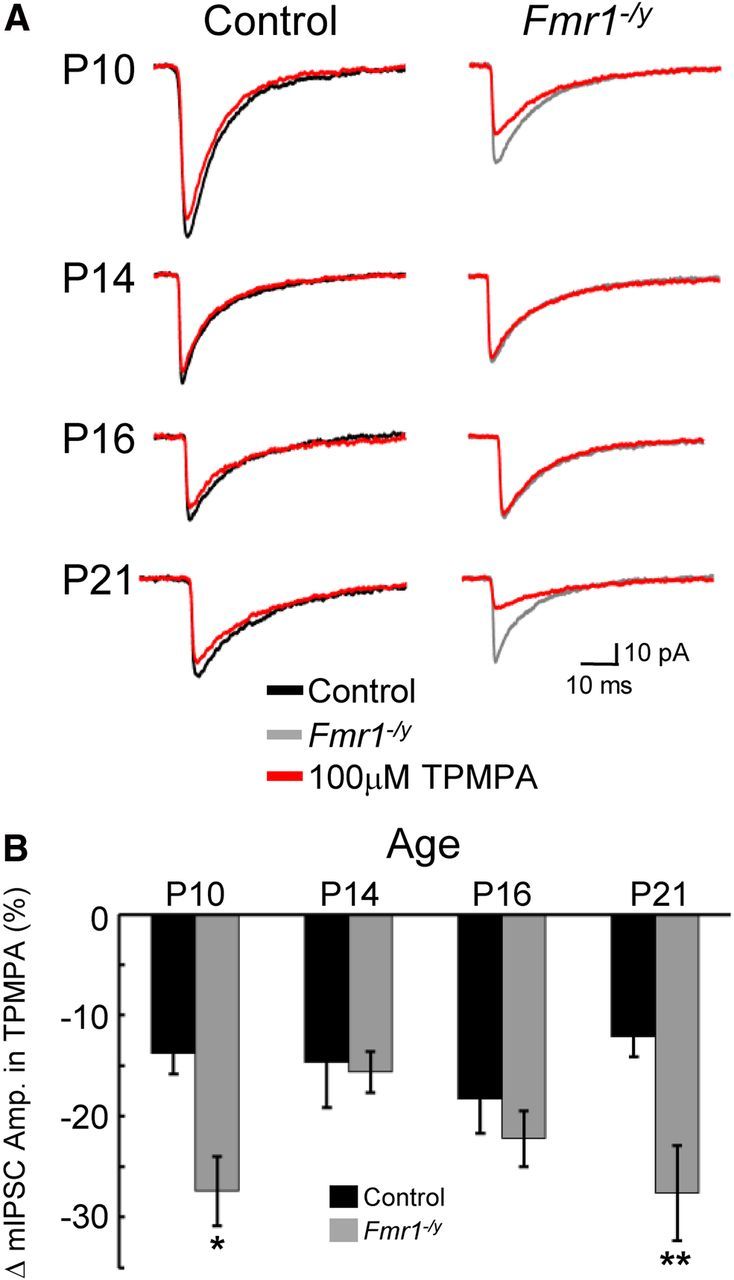
Dynamic changes in the levels of synaptic GABA concentration at inhibitory synapses in the Fmr1−/y BLA. The ability of TPMPA to attenuate the amplitude of mIPSCs is inversely proportional to the concentration of GABA localized to the synapse. A, Averages of >150 mIPSC events recorded in the absence (black sweeps for control; gray sweeps for Fmr1−/y) or presence (red traces) of 100 mm TPMPA. B, Histogram of pooled data of changes in mIPSC amplitude in the presence of TPMPA. Note that TPMPA has a significantly greater efficacy at P10 (*p < 0.05) and P21 (**p < 0.01) but not at P14 or P16 in Fmr1−/y. Mean ± SEM change in mIPSC amplitude, sample sizes, and p values are given in Table 2.
Table 2.
Pharmacological assessment of IPSCs using TPMPA, NO-711, zolpidem, and clonazepam
| Control (n)/Fmr1−/y (n) | TPMPA efficacy (mean ± SEM %Δ mIPSC amplitude) | NO-711 enhancement (mean ± SEM %) | Zolpidem enhancement (mean ± SEM %) | Clonazepam enhancement (mean ± SEM %) |
|---|---|---|---|---|
| P10 | −13.8 ± 2.1 (5)/−27.4 ± 3.4 (7) | 2.8 ± 6.1 (9)/5.0 ± 10.6 (4) | 6.4 ± 9.1 (5)/16.2 ± 2.7 (6) | 54.8 ± 7.8 (11)/13.8 ± 6.3 (10) |
| p = 0.012 | p = 0.911 | p = 0.230 | p = 0.0005 | |
| P14 | −14.7 ± 4.4 (5)/−15.7 ± 2.0 (7) | ND/ND | 15.0 ± 4.0 (6)/3.0 ± 0.5 (6) | 45.2 ± 7.0 (8)/30.5 ± 3.9 (7) |
| p = 0.834 | p = 0.100 | p = 0.102 | ||
| P16 | −18.4 ± 3.4 (5)/−22.2 ± 2.8 (5) | ND/ND | 21.6 ± 2.3 (5)/1.0 ± 11.6 (7) | 34.9 ± 4.2 (5)/43.1 ± 12.0 (8) |
| p = 0.401 | p = 0.045 | p = 0.490 | ||
| P21 | −12.2 ± 2.0 (5)/−27.6 ± 4.7 (6) | 27.9 ± 10.8 (5)/57.5 ± 5.2 (7) | 50.3 ± 1.7 (8)/11.3 ± 4.5 (8) | 2.1 ± 4.8 (12)/ 20.6 ± 7.3 (14) |
| p = 0.018 | p = 0.022 | p = 0.027 | p = 0.048 |
Pharmacological assessment of IPSCs using TPMPA, NO-711, zolpidem, and clonazepam. TPMPA efficacy is defined as the mean ± SEM of the change in mIPSC amplitude in the presence of 100 μm TPMPA. NO-711 enhancement values (defined as the percentage change in decay constant with drug application) are given for control (roman text) and Fmr1−/y (bold text) at each of the ages tested. Zolpidem and clonazepam enhancement values (defined as the percentage change in decay constant with drug application) are given for wild-type (roman text) and Fmr1−/y (bold text) at each of the ages tested. The number of cells in each group is indicated in parentheses. A Student's two-tailed t test was performed for all conditions. The p values are listed below the averaged value, and p < 0.05 are shown in bold. ND, Not determined.
The expression of the major presynaptic GABA reuptake transporter GAT1 is developmentally regulated and increases as animals age (Swanwick et al., 2006). An increase in GAT1 function could lead to the lower levels of synaptic GABA we observed in Fmr1−/y mutants at P10 and P21. To assess any possible changes in GAT1-mediated GABA reuptake, Fmr1−/y mutant sIPSCs were recorded from control and mutant BLA principal neurons in the presence and absence of 1 μm NO-711, a GABA reuptake blocker that acts specifically on GAT1 (Fig. 3A–C; Table 2). Blockage of GAT1 with NO-711 leads to an increase in the decay constant, indicating a greater efficacy of NO-711 and thus a likely increase in GAT1 function. Consistent with previous findings that GAT1 expression is very low in younger animals (Avila et al., 2011), no significant increase in decay constant was observed with NO-711 application in either control or Fmr1−/y mutant sIPSCs recorded at P10 (Fig. 3A–C). At P21, however, significant increases in decay constant were observed in both control and mutant sIPSCs (Fig. 3B,C), but this change was significantly greater in Fmr1−/y mutants than in control, suggesting increased GAT1-mediated GABA reuptake in these neurons (Fig. 3C). To determine whether increased GAT1 function at P21 is related to transporter protein levels, we compared GAT1 expression in control and Fmr1−/y mutant animals (Fig. 3D,E). Qualitative immunohistochemical detection of GAT1 protein indicated an increase in BLA GAT1 expression in P21 Fmr1−/y mutants.
Figure 3.
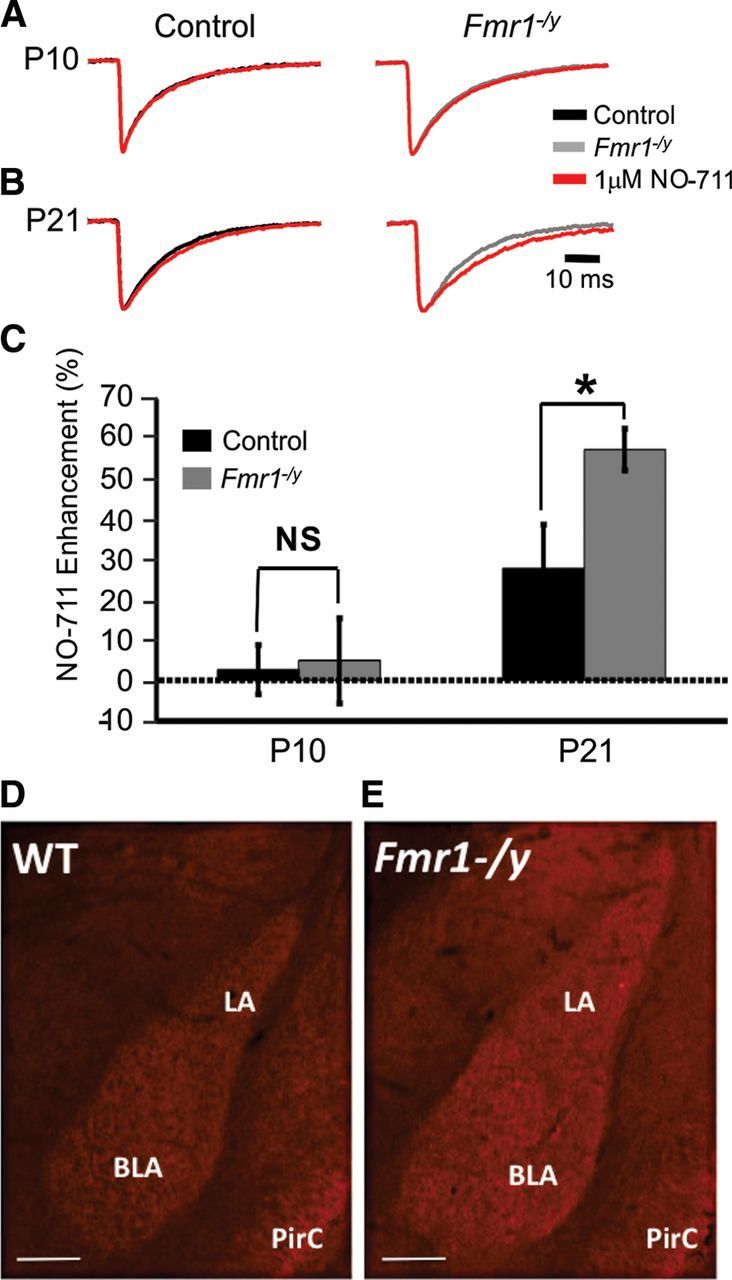
Developmental increase of GABA transporter function and expression. A, B, Averages of >150 sIPSC events normalized for amplitude before (black and gray traces for control and Fmr1−/y, respectively) and after (red traces) the application of 1 μm NO-711. A, At P10, no significant differences in decay constant were observed in either genotype in the presence of NO-711. B, NO-711 significantly increased the decay constants of both control and Fmr1−/y mutant sIPSCs at P21. C, NO-711 enhancement as a measure of the percentage difference in decay constant before and after treatment with NO-711. Note that NO-711 significantly increased the decay constant of P21 Fmr1−/y sIPSCs to a greater degree than in control sIPSCs (*p < 0.05). All decay constant and NO-711 enhancement values ± SEM, sample sizes, and p values are listed in Table 2. Immunohistochemical detection of GAT1 expression in control (D) and Fmr1−/y KOs (E). LA, Lateral amygdala; PirC, piriform cortex. Scale bars, 250 μm.
In addition to these GABAAR-independent changes, alterations in the number and/or subtype specification of GABAARs could also contribute to changes in inhibitory neurotransmission. Toward this goal, we first examined the development of the postsynaptic GABAARs using subunit-selective pharmacology. Previous studies have revealed that the subunit composition of postsynaptic GABAARs changes in several brain regions during the first 2 postnatal weeks (Paysan et al., 1994; Tia et al., 1996; Huntsman and Huguenard, 2000; Vicini et al., 2001). Typically, the population of GABAARs transitions from one dominated by those containing α2/α3 subunits early in postnatal development to mostly α1-subunit-containing receptors at more mature ages. A major determinant of decay kinetics of IPSCs depends primarily on GABAAR subunit composition, and, because early α2/α3 GABAARs have slower kinetics than mature α1 GABAARs, IPSC decay constants normally decrease over development (Verdoorn, 1994; Hollrigel and Soltesz, 1997; Rudolph et al., 1999; Fig. 1D,G). The activity of these two different subtypes of GABAARs can be distinguished pharmacologically using the benzodiazepine site agonists zolpidem and clonazepam, which act to increase IPSC decay constants by selectively targeting α1 or α2/α3 GABAARs, respectively (Huntsman and Huguenard, 2006; Galanopoulou, 2008). We therefore examined the status of developmental GABAAR subtype specification in the Fmr1−/y mutant BLA by recording sIPSCs from principal excitatory neurons in the presence of either 100 nm zolpidem or 200 nm clonazepam across developmental time.
Consistent with the normal developmental increase in the prevalence of α1 GABAARs observed in other brain regions, sIPSC sensitivity to zolpidem steadily increased across the four developmental time points in control cells (Fig. 4A, black symbols; Table 2). However, in Fmr1−/y principal neurons, this profile was severely disrupted, with zolpidem sensitivity remaining low throughout development (Fig. 4A, gray symbols). With clonazepam, as expected for control cells, sensitivity decreased as development progresses (Fig. 4B, black symbols). This normal pattern of clonazepam sensitivity was also altered in Fmr1−/y mutant neurons (Fig. 4B, gray symbols) in which sensitivity was initially lower than control at P10, increased to control levels at P14 and P16, and then remained higher than control at P21. These data indicate probable alterations in subunit density early in development (P10) and altered receptor subunit composition later (P21) in the FXS amygdala.
Figure 4.
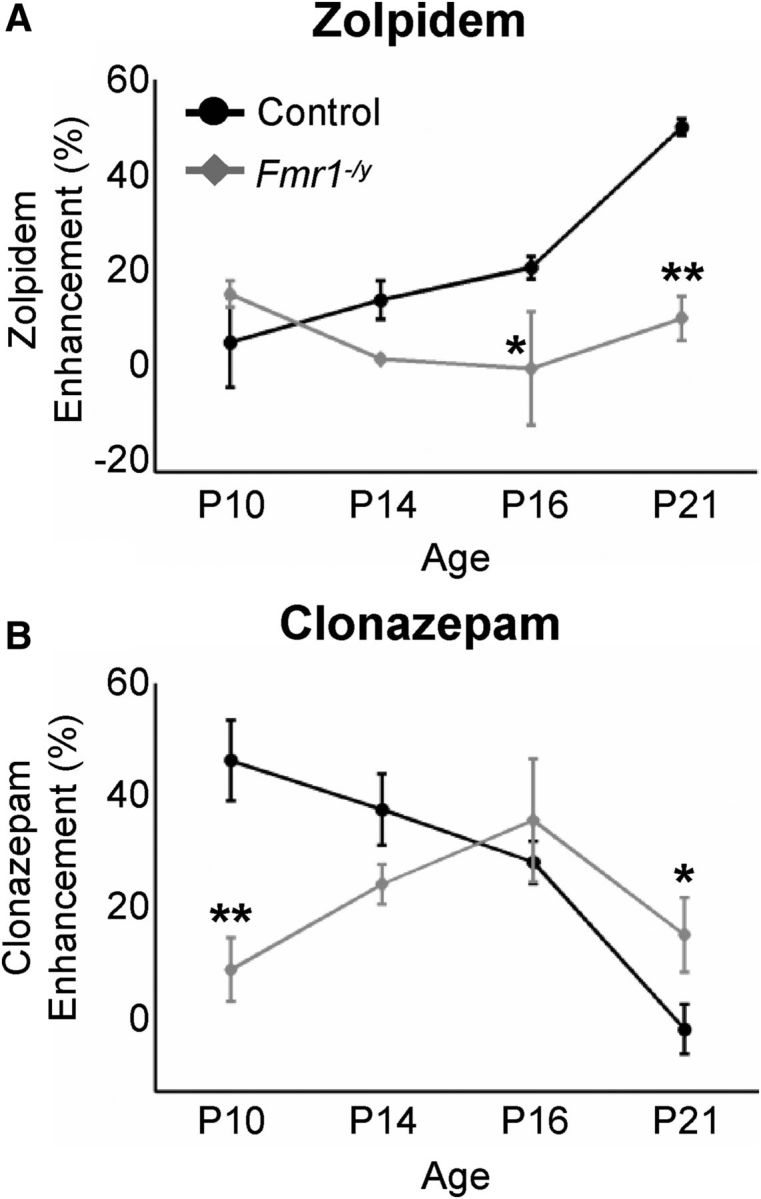
GABAAR subunit-selective pharmacology of sIPSCs is disrupted in the Fmr1−/y mutant BLA. A, Sensitivity to the α1 GABAAR agonist zolpidem is reduced in Fmr1−/y mutants at postnatal ages. sIPSCs were recorded in the presence of 200 nm zolpidem, an α1 GABAAR agonist that acts to lengthen the decay constant. “Zolpidem Enhancement” measures the percentage difference between the decay constant in the presence of zolpidem and that measured in the absence of the drug. Control responses to zolpidem increased steadily throughout development, consistent with the developmentally regulated increase in α1 GABAARs (black line). In contrast, sIPSCs from Fmr1−/y mutant principal neurons showed no increase in zolpidem sensitivity (gray line). *p < 0.05; **p < 0.01. B, The developmental profile of clonazapam-induced pharmacological changes is also disrupted. Overall, clonazepam sensitivity decreases throughout development in control, consistent with the developmental decrease in α3-containing GABAARs. Note that this trend is disrupted in Fmr1−/y. *p < 0.05; **p < 0.01. All values ± SEM, sample sizes, and p values are given in Table 2.
Additional information regarding the density and efficacy of postsynaptic GABAAR populations can be obtained from examination of mIPSC amplitude distributions. Variability in mIPSC amplitudes is directly correlated with the number of postsynaptic GABAARs (Nusser et al., 1997). Furthermore, the shape of these distributions suggest that the number of GABAARs at different synapses (GABAAR patch size) may be quantally distributed (Edwards et al., 1990). As such, the overall structure of these distributions can best be described by the sum of underlying Gaussian functions in which each underlying function corresponds to a different GABAAR patch size. To examine putative differences in the population of GABAAR patch sizes between control and Fmr1−/y, mIPSC amplitudes were first binned into 5 pA subgroups (Fig. 5). These distributions were then best fit using a least-squares algorithm to determine the function best describing them (Edwards et al., 1990). The number of underlying Gaussian functions indicates the number of different GABAAR patch sizes. Overall, mIPSC distributions from Fmr1−/y mutant cells were best fit by fewer Gaussian functions at all ages tested (Fig. 5). However, when examined across cells, the difference in the number of best-fit Gaussians between control and mutant mIPSC distributions was only significant at P10 and P21 (Fig. 5C). This suggests that, at these ages, there was significantly less variability in the size of postsynaptic GABAAR patch sizes in Fmr1−/y mutant cells with smaller patch sizes dominating. To more directly assess the average number of GABAARs per synapse in mutant versus control at different ages, peak-scaled nonstationary noise analysis was performed on the mIPSC amplitudes (De Koninck and Mody, 1994). This type of analysis provides accurate estimations of the average number of GABAARs per synapse. When performed using mIPSC amplitudes pooled from neurons within each age and genotype, this analysis suggested that there were significantly fewer GABAARs per synapse for Fmr1−/y compared with control at P10 and P21 but not at P14 or P16 (Fig. 6). In combination with the finding that mutant neurons have a smaller variety of GABAARs numbers per synapse (Fig. 5), this result suggested that Fmr1−/y principal neurons have a preponderance of small postsynaptic GABAAR populations per synapse. Given that the number of postsynaptic GABAARs was directly correlated with overall synapse size (Nusser et al., 1997), these results suggested that, at P10 and P21, inhibitory synapses onto principal excitatory neurons in the Fmr1−/y BLA are smaller and therefore contain less GABAARs than control neurons. Interestingly, the number of postsynaptic GABAARs per synapse did not significantly differ at P14 and P16 (Fig. 6D), possibly explaining, in part, the finding that inhibitory synaptic efficacy at these ages was comparable with control, at least in the absence of action potential firing.
Figure 6.
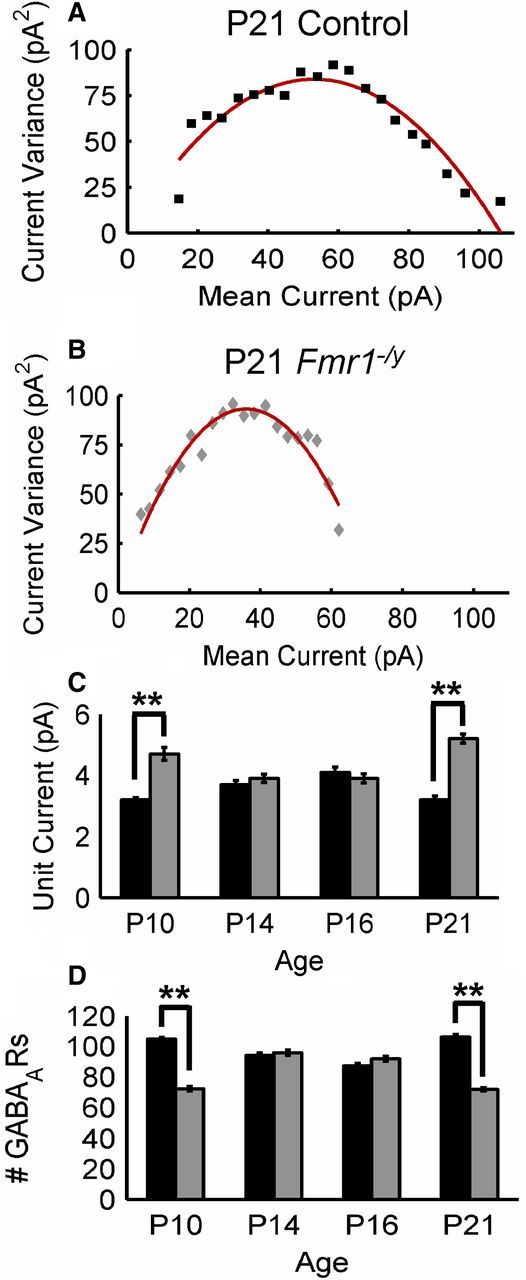
Peak-scaled nonstationary noise analysis suggests significantly higher unit currents and lower numbers of GABAARs in Fmr1−/y at P10 and P21 but not at P14 or P16. A, B, Current variance (σ2) and mean current (Im) plots for control (A) and Fmr1−/y (B) mIPSCs at P21. Solid lines indicate the best fit of the parabolic function σ2 = iIm − Im2/N. C, D, Mean estimated values for unit current (i; C) and the number of GABAARs (N; D) over development. **p < 0.01, Kolmorogov–Smirnoff test.
Together, these results show that both presynaptic and postsynaptic mechanisms involved in inhibitory neurotransmission, including synaptic GABA production, GABA reuptake mechanisms, GABAAR subtype specification, and numbers, are significantly and dynamically disrupted in the Fmr1−/y BLA. In addition, between P14 and P16, numerous components of inhibitory neurotransmission are upregulated, including action potential firing, synaptic GABA concentration, and receptor number, as well as changes in the predominance of specific GABAAR subtypes.
Inhibitory cell-autonomous and non-cell-autonomous mechanisms contribute to inhibitory neurotransmission deficits
The above results reveal a complex pattern of altered inhibitory synaptic development in which an initial defect in inhibition is transiently corrected by the upregulation of specific presynaptic and postsynaptic mechanisms critical to GABAergic synaptic function. However, these changes in inhibition may or may not critically depend on the cell-autonomous function of FMRP in inhibitory neurons. To investigate the contribution of the lack of FMRP in inhibitory neurons compared with the lack of FMRP in all other cells except inhibitory neurons on inhibitory synaptic defects, we used previously generated mice in which Fmr1 expression can be conditionally knocked out (Fmr1cKO) or restored (Fmr1cON) (Mientjes et al., 2006). To conditionally knock out or restore FMRP specifically in inhibitory interneurons, Fmr1cKO and Fmr1cON mice were separately crossed to Dlx5/6Cre mice, which drives Cre recombinase expression solely in forebrain inhibitory neurons starting at mid-neurogenesis (Stenman et al., 2003). In this analyses, we compared sIPSCs recorded from BLA principal neurons at P10, P14, and P21 across five groups of mice: (1) wild-type control; (2) Fmr1−/y (full KO); (3) Dlx5/6cre (cre control); (4) Dlx5/6cre;Fmr1cKO; and (5) Dlx5/6cre;Fmr1cON (Fig. 7; Table 3). For each age and genotype, we measured sIPSC amplitude, frequency, decay constant, and zolpidem enhancement of conditional genotypes compared with Dlx5/6cre controls. Significant changes were observed in a number of criteria and varied across time and genotype. At P10 and P21, Dlx5/6cre;Fmr1cKO mice did not show significant changes in sIPSC amplitude, frequency, decay constant, or zolpidem enhancement. At P14, however, Dlx5/6cre;Fmr1cKO mice exhibited an increase in frequency but no change in amplitude, decay constant, or zolpidem enhancement. In contrast, Dlx5/6cre;Fmr1cON rescue animals displayed a greater number of significant changes in sIPSC characteristics at all ages. These included changes in frequency and decay constant at all ages (P10, P14, and P21), as well as changes in amplitude and zolpidem enhancement at P21.
Figure 7.

Comparison of biophysical parameters for sIPSCs in conditional KO and rescue animals to control and full KO animals. Histograms of pooled data of sIPSCs recorded from P10 (A), P14 (B), and P21 (C) time points. Amplitude, frequency, and decay constant of sIPSCs recorded from control (black bars), full KO (Fmr1−/y; gray bars), control animals with cre driver (Dlx5/6Cre; purple bars), conditional KOs (Dlx5/6Cre;Fmr1cKO; red bars), and conditional rescues (Dlx5/6Cre;Fmr1cON; green bars) cells. Sensitivity to zolpidem assessment as a measure of percentage enhancement indicates that Dlx5/6Cre;Fmr1cKO BLA principal neurons show no preference at all ages. *p < 0.05; **p < 0.001; ***p < 0.001, significantly different from control.
Table 3.
Development of sIPSC characteristics in BLA principal neurons from inhibitory cell-specific conditional Fmr1 KO and rescue animals
| Genotype (n) | Amplitude (mean ± SEM pA) | Frequency (mean ± SEM Hz) | Decay constant (mean ± SEM ms) | Zolpidem enhancement (mean ± SEM %) |
|---|---|---|---|---|
| P10 | ||||
| Dlx5/6Cre (6) | 50.2 ± 1.3 | 1.1 ± 0.09 | 31.5 ± 1.4 | 10.7 ± 4.3 |
| Dlx5/6Cre;Fmr1cKO (6) | 48.2 ± 2.8 | 1.4 ± 0.2 | 34.2 ± 1.0 | 12.0 ± 5.2 |
| p = 0.55 | p = 0.24 | p = 0.15 | p = 0.67 | |
| Dlx5/6Cre;Fmr1cON (5) | 35.6 ± 3.7 | 3.5 ± 0.3 | 40.1 ± 2.0 | 4.4 ± 4.1 |
| p = 0.93 | p = 0.0005 | p = 0.009 | p = 0.0522 | |
| P14 | ||||
| Dlx5/6Cre (6) | 37.7 ± 1.5 | 1.6 ± 0.1 | 34.1 ± 1.2 | 19.5 ± 1.2 |
| Dlx5/6Cre;Fmr1cKO (5) | 35.8 ± 3.3 | 3.0 ± 0.4 | 32.8 ± 1.3 | 22.0 ± 3.7 |
| p = 0.616 | p = 0.022 | p = 0.466 | p = 0.674 | |
| Dlx5/6Cre;Fmr1cON (8) | 42.5 ± 2.7 | 4.5 ± 0.3 | 39.7 ± 0.8 | 5.3 ± 4.4 |
| p = 0.200 | p = 0.00002 | p = 0.006 | p = 0.0521 | |
| P21 | ||||
| Dlx5/6Cre (5) | 49.1 ± 2.2 | 3.3 ± 0.2 | 18.0 ± 0.7 | 54.5 ± 7.3 |
| Dlx5/6Cre;Fmr1cKO (6) | 42.4 ± 2.4 | 3.2 ± 0.2 | 19.9 ± 0.7 | 48.0 ± 4.2 |
| p = 0.058 | p = 0.91 | p = 0.073 | p = 0.46 | |
| Dlx5/6Cre;Fmr1cON (9) | 33.5 ± 2.4 | 6.1 ± 0.6 | 27.8 ± 0.7 | 5.9 ± 4.4 |
| p = 0.00018 | p = 0.0013 | p = 1.0 × 10⁻⁸ | p = 1.0 × 10⁻⁴ |
Development of sIPSC biophysical characteristics in BLA principal neurons from inhibitory cell-specific conditional Fmr1 KO and rescue animals. The mean ± SEM values for amplitude, frequency, decay constant, and zolpidem enhancement are given for sIPSCs recorded from excitatory BLA principal neurons from control Cre driver (Dlx5/6Cre), conditional Fmr1 KO (Dlx5/6Cre;Fmr1cKO), and conditional Fmr1 rescue (Dlx5/6Cre;Fmr1cON) animals. sIPSCs were sampled from animals at ages P10, P14, and P21. Sample sizes for sIPSC amplitude, frequency, and decay constant for each group are given in parentheses in the first column. Student's two-tailed t test performed for conditional Fmr1 KO (Dlx5/6Cre;Fmr1cKO) and conditional Fmr1 rescue (Dlx5/6Cre;Fmr1cON) mice were individually compared with control mice (Dlx5/6Cre). The p values are listed below the averaged value, and p < 0.05 are shown in bold.
Combined, the results of sIPSC recordings in conditional Fmr1 mutants show that both inhibitory cell-autonomous and non-cell-autonomous mechanisms are disrupted in the full Fmr1−/y KO. Conditional KO of FMRP solely in interneurons (Dlx5/6Cre;Fmr1cKO) results in a normalization across ages of postsynaptic responses as evidenced by normal amplitude, decay, and zolpidem enhancement. The latter finding reveals that restoration of FMRP in excitatory neurons can rescue the postsynaptic α1 GABAAR defect observed in the full Fmr1−/y KO. In contrast, conditional rescue of FMRP solely in interneurons (Dlx5/6cre;Fmr1cON) results in enhanced frequency, without postsynaptic rescue of decay constant or zolpidem enhancement. This suggests that restoration of FMRP in interneurons causes an enhancement of inhibitory neuronal efficacy above and beyond that of control. Interestingly, in both conditional KO and conditional rescue genotypes, frequency is increased at P14. Together with P14 analyses of the full Fmr1−/y KO (Fig. 1), this suggests a transient increase in the number of synapses, neurotransmitter release, and/or firing rate of inhibitory neurons and represents restorative mechanisms that can still occur whether FMRP is expressed solely in inhibitory neurons or excitatory neurons.
Discussion
The most striking finding presented here is that the state of inhibitory neurotransmission varies dramatically at different points in the first few weeks of postnatal life in the FXS amygdala. Quite interestingly, initial inhibitory defects are transiently corrected during the postnatal period of increased synaptogenesis in the second postnatal week (Jacobson, 1991). The drastic differences in inhibitory synaptic function over time are correlated with different levels of specific presynaptic and postsynaptic defects, the most profound being alterations in the functional maturation of α1 GABAARs, GABAAR numbers, and amount of synaptic GABA. These alterations act in concert to define the status of inhibitory synaptic efficacy overall, and transient increases in synaptic GABA and the upregulation of α2/3 GABAARs appear to be part of homeostatic responses that temporarily restores inhibition to normal levels at P14–P16. This transient restoration importantly demonstrates that, at least during periods of development characterized by significant synaptogenesis, in the FXS amygdala, the machinery necessary for normal inhibitory neurotransmission is at least partially intact or can be compensated for. Although the exact mechanism of this transient increase in inhibition remains unknown, our data suggest that this compensation occurs via a transient increase in interneuron firing. However, increased GABA release and/or overabundance of inhibitory connections may also play a role. Furthermore, Fmr1 conditional analyses demonstrate that amygdala inhibitory dysfunction in Fmr1−/y mutants comprises distinct presynaptic and postsynaptic components.
Homeostasis and the dynamic nature of synaptic defects
Normally, levels of synaptic input are globally regulated throughout a network by means of “synaptic scaling” (Turrigiano, 1999). Such homeostatic modifications act to maintain a specific level of synaptic input onto a given neuron in a manner dependent on the amount of activity in the entire network (Turrigiano et al., 1998; Desai et al., 2002; Kilman et al., 2002). Here, we observe a dramatic, developmentally dependent transient increase in inhibitory synaptic input onto excitatory principal neurons in the FXS amygdala that is reminiscent of homeostatic changes observed when global network activity is increased in normal networks (Gonzalez-Islas and Wenner, 2006; Hartman et al., 2006; Peng et al., 2010). This compensatory upregulation of inhibition (reported as frequency and amplitude) appears to occur in response to the decreased overall inhibitory activity present earlier at P10.
Our data suggest that at least five critical mechanisms appear to contribute to this homeostasis (Fig. 8). First, the increase in the frequency of GABAergic synaptic inputs to principal neurons in the developing FXS BLA between P14 and P16 could be the result of an increased number of functional inhibitory synapses. This is consistent with the finding that enhanced excitatory activity, as might be present at early postnatal stages in the FXS BLA, signals the upregulation of factors, such as brain-derived neurotrophic factor, that have been shown to promote inhibitory synapse formation and stabilization (Peng et al., 2010). Second, the frequency of GABAergic inputs increases to levels beyond normal when action potentials are not blocked. We interpret this result as a homeostatic increase in inhibitory interneuron firing. Third, immature α2/3 GABAARs, although deficient early in postnatal development in Fmr1−/y, rise to normal levels and remain higher than normal in mature circuits. It is possible that these immature α2/3 GABAARs compensate for the absence of α1 GABAARs. Fourth, the overall relative number of postsynaptic GABAARs also temporarily increases to normal levels as determined by quantal analysis. Fifth, we demonstrate that the concentration of GABA at the synapse is similarly temporarily restored during the same window of time. This suggests that presynaptic mechanisms governing GABA synthesis, packaging into vesicles, and/or vesicle release may also be enhanced homeostatically. Therefore, we suggest that both an increase in inhibitory interneuron activity (and/or synapse number) and the enhancement of basic mechanisms involved in inhibitory synaptic formation and function contribute to the transient developmental correction of inhibitory defects in the FXS amygdala. However, despite retaining the ability to achieve normal levels of inhibition in the absence of FMRP, this apparent homeostatic response is unable to maintain proper inhibitory function as the BLA network matures and ultimately returns to diminished levels at P21.
Figure 8.

Summary of altered developmental inhibitory synaptic processes in FXS. The top row depicts development across the four postnatal time points in the wild-type BLA, and the bottom row shows the case of FXS. Our results suggest that at least five processes are dynamically disrupted in the development of inhibitory neurotransmission in the FXS BLA. First, changes in IPSC frequency suggest that there may be alterations in the number of synapses throughout development, with more synapses becoming active at P14 and P16. Second, because the frequency of inhibitory synaptic inputs is elevated beyond control levels at P14–P16 only when action potentials are not blocked, BLA interneurons in Fmr1−/y may have higher firing rates. Third, presynaptic mechanisms governing the amount of GABA in the synapse are transiently upregulated, restoring the amount of synaptic GABA to control levels at P14–P16. Fourth, there is a severe defect in the process of GABAAR maturation in the FXS BLA, in which mature α1 GABAARs fail to become functional, whereas immature α3 GABAARs are retained at mature ages. Finally, the number of GABAARs increases to control levels at P14–P16. However, these compensatory changes fail to be maintained, and inhibitory defects are again present in the mature FXS BLA.
Inhibitory cell-autonomous and non-cell-autonomous mechanisms of reduced GABAergic efficacy
It has been shown recently that several FMRP target mRNAs are involved in the formation and function of key presynaptic and postsynaptic elements (Darnell et al., 2011). Consistent with this, we observe that several functional components of GABAergic synaptic transmission, both presynaptic and postsynaptic, are disrupted in the FXS BLA. These defects may be affected differentially based on whether or not FMRP is expressed solely in inhibitory neurons. To address this, we generated conditional Fmr1 animals in which FMRP expression is either specifically knocked out or restored in inhibitory neurons.
Our results reveal that GABAAR maturation appears to be entirely independent of FMRP expression in interneurons. When FMRP expression is knocked out in inhibitory cells only, sIPSC decay constants are normal and exhibit a normal sensitivity to zolpidem. Conversely, restoring FMRP in interneurons only leads to decay constants with values similar to those observed in the full Fmr1 KO. These decay constants are also insensitive to zolpidem. The most likely explanation is that FMRP is critically required in postsynaptic BLA principal cells but is not required in inhibitory neurons for GABAAR maturation. This lack of FMRP in BLA excitatory neurons appears to primarily affect the process leading to the rise in α1-sensitive receptors that characterizes mature BLA inhibitory synapses.
However, the lack of FMRP expression in the full Fmr1 KO affects processes underlying IPSC amplitude and frequency in more complex ways. Although several factors influence IPSC amplitude, the amount of GABA released into the synapse and the number of postsynaptic GABAARs are believed to contribute the most (De Koninck and Mody, 1994). The results of experiments in the full Fmr1 KO demonstrate that both of these are reduced in the FXS amygdala. Measurements from conditional Fmr1 KO animals show that FMRP expression may be affecting the level of synaptic GABA and the number of GABAARs independent of whether or not it is absent in either inhibitory neurons or excitatory principal neurons. This is perhaps not surprising given the dependence of GABAAR expression on neuronal activity (Ives et al., 2002; Kilman et al., 2002). However, the observation that the restoration of FMRP in inhibitory neurons in conditional rescue mice does not rescue GABAAR maturation defects interestingly suggests that FMRP function in inhibitory neurons is not critical for postsynaptic receptor maturation. Thus, importantly, defective inhibitory efficacy in the FXS amygdala comprises genetically separable, distinct presynaptic and postsynaptic components.
Consequences for the treatment of FXS and autism-related developmental disorders
With regard to considering treatment for FXS, the results presented here suggest that developmental age should be given significant consideration. Because our studies focused on the amygdala, they are particularly relevant with regard to the treatment of core behavioral symptoms, such as heightened anxiety, disrupted responses to fearful stimuli, and abnormal social functioning (Olmos-Serrano and Corbin, 2011; Martin and Huntsman, 2012). Differences in the gross anatomy of certain regions of the brain in boys with FXS have been detected as early as 1 year of age and change as development progresses (Hoeft et al., 2011). Our results suggest that the maturation of neural circuitry on a fine scale in the amygdala has similar developmental differences.
Second, the data we present have implications regarding the types of pharmacological agents that may or may not be helpful, with regard to either their efficacy or their propensity for causing prohibitive side effects in patients with FXS. Clonazepam, for instance, is often prescribed to treat epilepsy, which has a high rate of comorbidity with FXS (Leung and Ring, 2013). However, it has been observed that clonazepam treatment can increase the severity of some autistic symptoms or have otherwise enhanced side effects in individuals with FXS (Gillberg, 1995). Our results suggest a possible explanation for these outcomes: GABAAR maturation may be defective in FXS patients, and, as such, there may be a preponderance of immature, clonazepam-sensitive α2/α3-containing GABAA receptors. If this is the case, clonazepam would have increased effects in FXS patients compared with the neurotypical population. Finally, we show that GABA reuptake is enhanced in the mature FXS amygdala. Therefore, GABA transporters may be viable drug targets for the treatment of FXS symptoms caused by amygdala dysfunction in patients beyond early childhood, when the system has matured. GABA reuptake inhibitors, such as the anti-epileptic drug tiagabine, are well tested and readily available.
In conclusion, we demonstrate that several mechanisms involved in GABAergic synaptic transmission in the amygdala are affected by the absence of FMRP. Overall, it appears that these mechanisms act in concert to reduce the amount of synaptic GABA, as well as decrease the strength of the postsynaptic response mediated by GABAARs. By increasing the amount of synaptic GABA or increasing GABA sensitivity in the amygdala, it may be possible to alleviate some of the more debilitating symptoms of FXS and other developmental disorders. However, the presence or absence of these defects will likely critically depend on the age of the affected individual, highlighting an important additional consideration when developing therapeutic strategies, especially in pediatric cases.
Footnotes
This work was supported by National Institutes of Health/National Institute of Neurological Disorders and Stroke Grant R01 NS053719 (M.M.H.), Autism Speaks (J.G.C. and M.M.H.), Neurodevelopmental Disorders Fund (J.G.C.), FRAXA Research Foundation (J.G.C. and M.M.H.), a National Institute of Child Health and Human Development T32 Training Grant (R.L.V.), and National Institutes of Health Grant HD024064 (D.L.N.). We acknowledge the members of the Huntsman and Corbin laboratories for useful discussions and Stefano Vicini and Vittorio Gallo for advice and critical reading of this manuscript.
The authors declare no competing financial interests.
References
- Avila MA, Real MA, Guirado S. Patterns of GABA and GABA transporter-1 immunoreactivities in the developing and adult mouse brain amygdala. Brain Res. 2011;1388:1–11. doi: 10.1016/j.brainres.2011.02.093. [DOI] [PubMed] [Google Scholar]
- Barberis A, Lu C, Vicini S, Mozrzymas JW. Developmental changes of GABA synaptic transient in cerebellar granule cells. Mol Pharmacol. 2005;67:1221–1228. doi: 10.1124/mol.104.006437. [DOI] [PubMed] [Google Scholar]
- Bear MF, Huber KM, Warren ST. The mGluR theory of fragile X mental retardation. Trends Neurosci. 2004;27:370–377. doi: 10.1016/j.tins.2004.04.009. [DOI] [PubMed] [Google Scholar]
- Centonze D, Rossi S, Mercaldo V, Napoli I, Ciotti MT, De Chiara V, Musella A, Prosperetti C, Calabresi P, Bernardi G, Bagni C. Abnormal striatal GABA transmission in the mouse model for the fragile X syndrome. Biol Psychiatry. 2008;63:963–973. doi: 10.1016/j.biopsych.2007.09.008. [DOI] [PubMed] [Google Scholar]
- Comery TA, Harris JB, Willems PJ, Oostra BA, Irwin SA, Weiler IJ, Greenough WT. Abnormal dendritic spines in fragile X knockout mice: maturation and pruning deficits. Proc Natl Acad Sci U S A. 1997;94:5401–5404. doi: 10.1073/pnas.94.10.5401. [DOI] [PMC free article] [PubMed] [Google Scholar]
- Darnell JC, Van Driesche SJ, Zhang C, Hung KY, Mele A, Fraser CE, Stone EF, Chen C, Fak JJ, Chi SW, Licatalosi DD, Richter JD, Darnell RB. FMRP stalls ribosomal translocation on mRNAs linked to synaptic function and autism. Cell. 2011;146:247–261. doi: 10.1016/j.cell.2011.06.013. [DOI] [PMC free article] [PubMed] [Google Scholar]
- De Koninck Y, Mody I. Noise analysis of miniature IPSCs in adult rat brain slices: properties and modulation of synaptic GABAA receptor channels. J Neurophysiol. 1994;71:1318–1335. doi: 10.1152/jn.1994.71.4.1318. [DOI] [PubMed] [Google Scholar]
- Desai NS, Cudmore RH, Nelson SB, Turrigiano GG. Critical periods for experience-dependent synaptic scaling in visual cortex. Nat Neurosci. 2002;5:783–789. doi: 10.1038/nn878. [DOI] [PubMed] [Google Scholar]
- Desai NS, Casimiro TM, Gruber SM, Vanderklish PW. Early postnatal plasticity in neocortex of Fmr1 knockout mice. J Neurophysiol. 2006;96:1734–1745. doi: 10.1152/jn.00221.2006. [DOI] [PubMed] [Google Scholar]
- Ebert DH, Greenberg ME. Activity-dependent neuronal signalling and autism spectrum disorder. Nature. 2013;493:327–337. doi: 10.1038/nature11860. [DOI] [PMC free article] [PubMed] [Google Scholar]
- Edwards FA, Konnerth A, Sakmann B. Quantal analysis of inhibitory synaptic transmission in the dentate gyrus of rat hippocampal slices: a patch-clamp study. J Physiol. 1990;430:213–249. doi: 10.1113/jphysiol.1990.sp018289. [DOI] [PMC free article] [PubMed] [Google Scholar]
- Galanopoulou AS. GABA(A) receptors in normal development and seizures: friends or foes? Curr Neuropharmacol. 2008;6:1–20. doi: 10.2174/157015908783769653. [DOI] [PMC free article] [PubMed] [Google Scholar]
- Gibson JR, Bartley AF, Hays SA, Huber KM. Imbalance of neocortical excitation and inhibition and altered UP states reflect network hyperexcitability in the mouse model of fragile X syndrome. J Neurophysiol. 2008;100:2615–2626. doi: 10.1152/jn.90752.2008. [DOI] [PMC free article] [PubMed] [Google Scholar]
- Gillberg C. Clinical child neuropsychiatry. Cambridge, UK: Cambridge UP; 1995. Interventions and treatments; pp. 326–339. [Google Scholar]
- Gonzalez-Islas C, Wenner P. Spontaneous network activity in the embryonic spinal cord regulates AMPAergic and GABAergic synaptic strength. Neuron. 2006;49:563–575. doi: 10.1016/j.neuron.2006.01.017. [DOI] [PubMed] [Google Scholar]
- Harlow EG, Till SM, Russell TA, Wijetunge LS, Kind P, Contractor A. Critical period plasticity is disrupted in the barrel cortex of FMR1 knockout mice. Neuron. 2010;65:385–398. doi: 10.1016/j.neuron.2010.01.024. [DOI] [PMC free article] [PubMed] [Google Scholar]
- Hartman KN, Pal SK, Burrone J, Murthy VN. Activity-dependent regulation of inhibitory synaptic transmission in hippocampal neurons. Nat Neurosci. 2006;9:642–649. doi: 10.1038/nn1677. [DOI] [PubMed] [Google Scholar]
- Hoeft F, Walter E, Lightbody AA, Hazlett HC, Chang C, Piven J, Reiss AL. Neuroanatomical differences in toddler boys with fragile x syndrome and idiopathic autism. Arch Gen Psychiatry. 2011;68:295–305. doi: 10.1001/archgenpsychiatry.2010.153. [DOI] [PMC free article] [PubMed] [Google Scholar]
- Hollrigel GS, Soltesz I. Slow kinetics of miniature IPSCs during early postnatal development in granule cells of the dentate gyrus. J Neurosci. 1997;17:5119–5128. doi: 10.1523/JNEUROSCI.17-13-05119.1997. [DOI] [PMC free article] [PubMed] [Google Scholar]
- Huber KM, Gallagher SM, Warren ST, Bear MF. Altered synaptic plasticity in a mouse model of fragile X mental retardation. Proc Natl Acad Sci U S A. 2002;99:7746–7750. doi: 10.1073/pnas.122205699. [DOI] [PMC free article] [PubMed] [Google Scholar]
- Huntsman MM, Huguenard JR. Nucleus-specific differences in GABA(A)-receptor-mediated inhibition are enhanced during thalamic development. J Neurophysiol. 2000;83:350–358. doi: 10.1152/jn.2000.83.1.350. [DOI] [PubMed] [Google Scholar]
- Huntsman MM, Huguenard JR. Fast IPSCs in rat thalamic reticular nucleus require the GABAA receptor beta1 subunit. J Physiol. 2006;572:459–475. doi: 10.1113/jphysiol.2006.106617. [DOI] [PMC free article] [PubMed] [Google Scholar]
- Ives JH, Drewery DL, Thompson CL. Neuronal activity and its influence on developmentally regulated GABA(A) receptor expression in cultured mouse cerebellar granule cells. Neuropharmacology. 2002;43:715–725. doi: 10.1016/S0028-3908(02)00164-8. [DOI] [PubMed] [Google Scholar]
- Jacobson M. Formation of dendrites and development of synaptic connections. In: Rao MS, Jacobson M, editors. Developmental neurobiology. New York: Plenum; 1991. pp. 223–284. [Google Scholar]
- Kilman V, van Rossum MC, Turrigiano GG. Activity deprivation reduces miniature IPSC amplitude by decreasing the number of postsynaptic GABAA receptors clustered at neocortical synapses. J Neurosci. 2002;22:1328–1337. doi: 10.1523/JNEUROSCI.22-04-01328.2002. [DOI] [PMC free article] [PubMed] [Google Scholar]
- Leung HT, Ring H. Epilepsy in four genetically determined syndromes of intellectual disability. J Intellect Disabil Res. 2013;57:3–20. doi: 10.1111/j.1365-2788.2011.01505.x. [DOI] [PubMed] [Google Scholar]
- Martin BS, Huntsman MM. Pathological plasticity in fragile X syndrome. Neural Plast. 2012;2012:1–12. doi: 10.1155/2012/275630. [DOI] [PMC free article] [PubMed] [Google Scholar]
- Mientjes EJ, Nieuwenhuizen I, Kirkpatrick L, Zu T, Hoogeveen-Westerveld M, Severijnen L, Rif é M, Willemsen R, Nelson DL, Oostra BA. The generation of a conditional Fmr1 knock out mouse model to study Fmrp function in vivo. Neurobiol Dis. 2006;21:549–555. doi: 10.1016/j.nbd.2005.08.019. [DOI] [PubMed] [Google Scholar]
- Nimchinsky EA, Oberlander AM, Svoboda K. Abnormal development of dendritic spines in FMR1 knock-out mice. J Neurosci. 2001;21:5139–5146. doi: 10.1523/JNEUROSCI.21-14-05139.2001. [DOI] [PMC free article] [PubMed] [Google Scholar]
- Nusser Z, Cull-Candy S, Farrant M. Differences in synaptic GABA(A) receptor number underlie variation in GABA mini amplitude. Neuron. 1997;19:697–709. doi: 10.1016/S0896-6273(00)80382-7. [DOI] [PubMed] [Google Scholar]
- Olmos-Serrano JL, Corbin JG. Amygdala regulation of fear and emotionality in fragile X syndrome. Dev Neurosci. 2011;33:365–378. doi: 10.1159/000329424. [DOI] [PMC free article] [PubMed] [Google Scholar]
- Olmos-Serrano JL, Paluszkiewicz SM, Martin BS, Kaufmann WE, Corbin JG, Huntsman MM. Defective GABAergic neurotransmission and pharmacological rescue of neuronal hyperexcitability in the amygdala in a mouse model of fragile X syndrome. J Neurosci. 2010;30:9929–9938. doi: 10.1523/JNEUROSCI.1714-10.2010. [DOI] [PMC free article] [PubMed] [Google Scholar]
- Paysan J, Bolz J, Mohler H, Fritschy JM. GABAA receptor alpha 1 subunit, an early marker for area specification in developing rat cerebral cortex. J Comp Neurol. 1994;350:133–149. doi: 10.1002/cne.903500110. [DOI] [PubMed] [Google Scholar]
- Peng YR, Zeng SY, Song HL, Li MY, Yamada MK, Yu X. Postsynaptic spiking homeostatically induces cell-autonomous regulation of inhibitory inputs via retrograde signaling. J Neurosci. 2010;30:16220–16231. doi: 10.1523/JNEUROSCI.3085-10.2010. [DOI] [PMC free article] [PubMed] [Google Scholar]
- Pilpel Y, Kolleker A, Berberich S, Ginger M, Frick A, Mientjes E, Oostra BA, Seeburg PH. Synaptic ionotropic glutamate receptors and plasticity are developmentally altered in the CA1 field of Fmr1 knockout mice. J Physiol. 2009;587:787–804. doi: 10.1113/jphysiol.2008.160929. [DOI] [PMC free article] [PubMed] [Google Scholar]
- Rudolph U, Crestani F, Benke D, Brünig I, Benson JA, Fritschy JM, Martin JR, Bluethmann H, Möhler H. Benzodiazepine actions mediated by specific gamma-aminobutyric acid(A) receptor subtypes. Nature. 1999;401:796–800. doi: 10.1038/44579. [DOI] [PubMed] [Google Scholar]
- Stenman J, Toresson H, Campbell K. Identification of two distinct progenitor populations in the lateral ganglionic eminence: implications for striatal and olfactory bulb neurogenesis. J Neurosci. 2003;23:167–174. doi: 10.1523/JNEUROSCI.23-01-00167.2003. [DOI] [PMC free article] [PubMed] [Google Scholar]
- Suvrathan A, Hoeffer CA, Wong H, Klann E, Chattarji S. Characterization and reversal of synaptic defects in the amygdala in a mouse model of fragile X syndrome. Proc Natl Acad Sci U S A. 2010;107:11591–11596. doi: 10.1073/pnas.1002262107. [DOI] [PMC free article] [PubMed] [Google Scholar]
- Swanwick CC, Murthy NR, Mtchedlishvili Z, Sieghart W, Kapur J. Development of gamma-aminobutyric acidergic synapses in cultured hippocampal neurons. J Comp Neurol. 2006;495:497–510. doi: 10.1002/cne.20897. [DOI] [PMC free article] [PubMed] [Google Scholar]
- Tia S, Wang JF, Kotchabhakdi N, Vicini S. Developmental changes of inhibitory synaptic currents in cerebellar granule neurons: role of GABAA receptor alpha 6 subunit. J Neurosci. 1996;16:3630–3640. doi: 10.1523/JNEUROSCI.16-11-03630.1996. [DOI] [PMC free article] [PubMed] [Google Scholar]
- Turrigiano GG. Homeostatic plasticity in neuronal networks: the more things change, the more they stay the same. Trends Neurosci. 1999;22:221–227. doi: 10.1016/S0166-2236(98)01341-1. [DOI] [PubMed] [Google Scholar]
- Turrigiano GG, Leslie KR, Desai NS, Rutherford LC, Nelson SB. Activity-dependent scaling of quantal amplitude in neocortical neurons. Nature. 1998;391:892–896. doi: 10.1038/36103. [DOI] [PubMed] [Google Scholar]
- Verdoorn TA. Formation of heteromeric gamma-aminobutyric acid type A receptors containing two different alpha subunits. Mol Pharmacol. 1994;45:475–480. [PubMed] [Google Scholar]
- Vicini S, Ferguson C, Prybylowski K, Kralic J, Morrow AL, Homanics GE. GABAA receptor α1 subunit deletion prevents developmental changes of inhibitory synaptic currents in cerebellar neurons. J Neurosci. 2001;21:3009–3016. doi: 10.1523/JNEUROSCI.21-09-03009.2001. [DOI] [PMC free article] [PubMed] [Google Scholar]
- Wilson BM, Cox CL. Absence of metabotropic glutamate receptor-mediated plasticity in the neocortex of fragile X mice. Proc Natl Acad Sci U S A. 2007;104:2454–2459. doi: 10.1073/pnas.0610875104. [DOI] [PMC free article] [PubMed] [Google Scholar]
- Zhang J, Hou L, Klann E, Nelson DL. Altered hippocampal synaptic plasticity in the FMR1 gene family knockout mouse models. J Neurophysiol. 2009;101:2572–2580. doi: 10.1152/jn.90558.2008. [DOI] [PMC free article] [PubMed] [Google Scholar]
- Zoghbi HY. Postnatal neurodevelopmental disorders: meeting at the synapse? Science. 2003;302:826–830. doi: 10.1126/science.1089071. [DOI] [PubMed] [Google Scholar]