Abstract
Background
Clinical and animal data indicate that gut-derived endotoxin and other luminal bacterial products are necessary cofactors for development of alcoholic liver disease (ALD). Although gut leakiness is clearly an important cause of endotoxemia in ALD, it cannot fully explain endotoxemia in all ALD subjects and thus other factors may be involved. One possible factor is a change in gut microbiota composition (dysbiosis). Thus, the aim of our study was to interrogate the gut bacterial microbiota in alcohol-fed rats to see if chronic alcohol consumption affects gut bacteria composition.
Method
Male Sprague-Dawley rats were given either alcohol or dextrose intragastrically by gavage twice daily for up to 10 weeks. A subgroup of rats was also given either a probiotic (lactobacillus GG) or a prebiotic (oats) by gavage. Ileal and colonic mucosal-attached microbiota composition were interrogated by Length Heterogeneity PCR (LH-PCR) fingerprinting.
Results
Bacterial microbiota composition in alcohol-fed rats is not different from dextrose fed rats at weeks 4 and 6. Mucosa-associated microbiota composition in the colon is altered at 10 weeks of daily alcohol gavage. Both LGG and oats prevented alcohol-induced dysbiosis up to 10 weeks of alcohol treatment.
Conclusion
Daily alcohol consumption for 10 weeks alters colonic mucosa- associated bacterial microbiota composition in rats. Our data showed, for the first time, that daily alcohol consumption can affect colonic microbiome composition and suggest that dysbiosis may be an important mechanism of alcohol-induced endotoxemia. Further studies are needed to determine how dysbiotic microbiota contributes to development of ALD and whether therapeutic interventions targeted towards dysbiotic microbiota can prevent complications of alcoholism like ALD.
Keywords: Alcohol, alcoholic liver disease, oxidative stress, intestinal permeability, gut microbiota, bacteria
Introduction
Only a minority of alcoholics (~30%) develop alcoholic liver disease (ALD)(Grant et al., 1988); hence factors other than alcohol (EtOH) may also be involved in the pathogenesis of ALD. Several lines of clinical and animal data demonstrate that gut-derived endotoxemia is a key cofactor in ALD development: 1) Rats with EtOH-induced liver injury have high endotoxin levels in their portal vein, and there is a strong correlation between endotoxin levels and the severity of liver injury(Nanji et al., 1993); 2) Similarly human alcoholics with ALD have high serum endotoxin levels and serum endotoxin levels correlate with ALD severity(Bigatello et al., 1987); 3) Monocytes from alcoholics with ALD are shown to be primed for producing cytokines and oxidants due to endotoxin exposure (Criado-Jimenez et al., 1995; Hunt and Goldin, 1992; McClain and Cohen, 1989); 4) Endotoxemia occurs several weeks before the development of steatohepatitis in EtOH-fed rats (Forsyth et al., 2009) and 5) Lowering serum endotoxin levels by giving non-absorbable antibiotics(Adachi et al., 1995) or lactobacillus(Forsyth et al., 2009; Nanji et al., 1994) attenuate EtOH-induced liver injury in rats. Thus, endotoxin and possibly other gut-derived, pro-inflammatory, bacterial products are involved in the development of liver disease in alcoholics and may help explain why only a subgroup of alcoholics develop ALD.
In normal circumstances, it is believed that small amounts of gut-derived bacterial products like endotoxin can permeate through even a normal gut barrier and pass into the portal circulation and reach the liver where it is eliminated by Kupffer cells. Elevated levels of blood endotoxin (endotoxemia) in alcoholics is therefore due to 3 possible mechanisms: 1) increased production of endotoxin by either abnormal gut microbiota composition (dysbiosis) or bacterial overgrowth, 2) increased permeation of endotoxin through the gut due to gut leakiness, 3) decreased elimination of endotoxin due to either blood shunting away from the liver (as seen with portal hypertension) or defective Kupffer cell function. Decreased elimination can be an important factor for endotoxemia in patients with advanced liver disease but the evidence to date does not suggest that this is a major factor in the initiation of alcoholic steatohepatitis, especially when there is no evidence of portal hypertension and Kupffer cell dysfunction. Disruption of intestinal barrier function appears to be an important mechanism of EtOH-induced endotoxemia since we and others have already demonstrated gut leakiness in both alcoholics with liver disease and in EtOH-fed rats(Enomoto et al., 2000; Fukui et al., 1991; Keshavarzian et al., 2001; Keshavarzian et al., 1999).
Although gut leakiness probably contributes to endotoxemia in ALD, it cannot fully explain endotoxemia in all ALD cases. For example, gut leakiness as assessed by permeability to sugars is present in 80% of actively drinking alcoholics with liver disease(Keshavarzian et al., 1999) and the majority of sober alcoholics with ALD do not have overt baseline leakiness. Specifically, they are only susceptible to leakiness after challenge with aspirin and yet they do have endotoxemia (unpublished observation). This finding suggests a more long-lasting effect of EtOH, beyond the life span (3–5 d) of most gut epithelial cells. One possible long term effect of EtOH that could cause endotoxemia is an alteration in gut microbiota composition (dysbiosis). Dysbiosis can cause endotoxemia by both increasing the production of endotoxin and by chronic deleterious consequences on gut barrier function.
Our knowledge of the gut microbiota in humans has been limited in the past by our inability to culture the majority of bacterial species. With the advent of molecular technologies, it is now known that the gut microbiota are primarily composed of eubacteria with estimates of 500 to 45,000 species in the colon(Frank et al., 2007; Macfarlane, 1999). It is believed that gut microbiota composition is partly due to the environmental factors and partly to genetic background (Ryu et al., 2008; Zoetendal et al., 2004). The effects of EtOH consumption on gut microbiota composition have never been studied. Thus, the aim of this study was to interrogate gut microbiota in EtOH-fed rats to see if chronic EtOH consumption affects gut bacterial microbiota composition.
Materials and Methods
Animal Subjects
We have previously reported on gut permeability, oxidative stress and ALD in rats used for this study (Keshavarzian et al., 2009). Tissues from animals that underwent the following experimental protocol were studied for this present study:
Male Sprague-Dawley rats (Zivic-Miller Laboratories, Zelienople, PA; n = 17; 250–300 g, initial body weight) were acclimated for 6 to 7 days, at 22 ± 1°C with a 12:12-h dark-light cycle. During the acclimatization period, rats were given water and standard laboratory food (rat chow) ad libidum. During the experiment period, EtOH or dextrose were administered intragastrically by gavage twice daily using a 12-gauge gavage needle (Popper & Sons, New Hyde Park, NY), as previously described(Keshavarzian et al., 2009).. EtOH-fed rats received ethanol gavage (~2–3 mL) twice daily starting with an initial dose of 2 g/kg/day. This dose was progressively increased during a 2 week run in phase [weeks 1 and 2] to a maintenance dose of 8 g/kg/day (solutions maximally contained 50–60% EtOH) that was continued for up to 8 more weeks in the experimental period. Thus, each rat received 10 weeks of daily EtOH- 2 weeks of run in and 8 weeks of high dose EtOH. Control rats received an isocaloric amount of dextrose, also by gavage. All rats also had regular rat chow available (ad libidum) throughout the 10-week experimental period. Rats were weighed daily.
The probiotic and prebiotic group received intragastric feedings of a slurry of either powdered rat chow (vehicle) and Lactobacillus rhamnosus Gorbach-Goldin (LGG) (ATCC, #53103) (2.5×10⁷ live/once daily) or oats 10 g/kg(Keshavarzian et al., 2001) as previously described (Forsyth et al., 2009). We chose a dose similar to Nanji et al (Nanji et al., 1994), that was successfully used to attenuate endotoxemia and alcoholic steatohepatitis in a rodent model of ALD.
Five treatment groups were studied: 1) dextrose control (CON) (n = 15 rats; 15 colon samples and 9 ileal samples at 3 different time points- 4,6 and 10 weeks); 2) Alcohol+ vehicle alone (ALC-V) (n = 18 rats; 18 colon samples and 9 ileal samples at 3 different time points -4,6 and 10 weeks); 3) Alcohol + Lactobacillus GG (ALC+LGG) (n = 5 rats; 5 colon samples at 10 weeks); 4) Alcohol + oats (ALC+oats) (n = 2 rats; 2 colon samples at 10 weeks); 5) dextrose + oats (CON+oats) (n =1 rat;1 colon sample at 10 weeks).
At weeks 4, 6 and 10 (which correspond to 2, 4 and 8 weeks of exposure to stable, high dose inhalation, followed immediately of EtOH, respectively), the animals were humanely sacrificed by CO2 by laparotomy for the collection of intestinal (ileum and colon) tissues. Intestine was opened and luminal stool was removed and then intestinal tissues were immediately placed in liquid nitrogen and snapped frozen for microbiota fingerprinting.
All animal protocols and practices were reviewed and approved in advance by the Rush University Institutional Animal Care and Use Committee (IACUC) in accordance with guidelines set forth by the Office of Laboratory Animal Welfare (OLAW), NIH, and the publications: U.S. Government Principles for the Utilization and Care of Vertebrate Animals used in Testing, Research, and Training, and the Guide for the Care and Use of Laboratory Animals (Guide).
Culture of Lactobacillus rhamnosus GG
Lactobacillus rhamnosus Gorbach-Goldin (LGG) (ATCC 531030) strain was cultured in Lactobacillus MRS broth (Difco, BD, Sparks, MD) at 37°C in accordance with ATCC guidelines. Bacteria were harvested from MRS broth by centrifugation and CFU counted by dilution and streaking on MRS agar plates (Difco) at 37°C overnight. LGG were then centrifuged and resuspended at a dilution of 2.5×10⁷/ml in PBS and 1ml gavage was used for once-a-day daily treatment.
Gut bacterial microbiota fingerprinting
Frozen samples from the distal colon (above the anus) and distal ileum (just proximal to the cecum) were used to characterize mucosa-associated bacterial microbiota. DNA extractions were performed using the Bio101 kit from Qbiogene, Inc, Montreal, Quebec. Mucosal samples were placed in individual fastprep tubes and lysed by bead beating in a fast prep instrument and total DNA was extracted as per the manufacturer’s instructions.
Length heterogeneity PCR (LH-PCR) was then used to generate fingerprints of bacterial microbiota composition in the samples:
a) PCR
Purified DNA (10ng) was amplified with PCR by using a fluorescently labeled forward primer 27F (5′-[6FAM] AGAGTTTGATCCTGGCTCA G-3′) and unlabeled reverse primer 355R (5′-GCTGCCTCCCGTAGGAGT-3′). Both these primers are universal 16S rRNA eubacterial primers (Sudo et al., 1997). The reactions are done with 20-ul (final volume) mixtures containing 1 X PCR buffer, 0.01% bovine serum albumin, 2.5 mM MgCI2, 0.2 mM of each deoxynucleoside triphosphate 0.5 uM of each primer, and 0.5 U of Taq Gold DNA polymerase (Applied Biosystems, Inc.). Initial denaturation at 95°C for 11 min is followed by 35 cycles of denaturation at 95°C for 30 sec, annealing at 48°C for 30 s, and extension at 72°C for 2 min and 5 sec/cycle added. There was a final extension step that consists of 72°C for 30 min to ensure the extension of all amplified products. The PCR products were then stored at − 4°C in the dark until used in fingerprinting (usually less than a week).
b) LH-PCR fingerprinting
Duplicate or triplicate PCR reactions were diluted based on the product quantity and mixed with a size standard ILS-600 (Promega) and HiDi formamide, then heated at 95°C to denature and kept at cold ethanol bath until used. The products were separated on the SCE9610 capillary fluorescent sequencer (Spectrumedix LLC, State College, PA) and analyzed with GenoSpectrum software package (Spectrumedix LLC, State College, PA). The software converts fluorescence data into electropherograms. The peaks of the electropherograms represent different taxa of microflora or Operational Taxonomic Units (OTUs) of different sizes.
c) Comparison of LH-PCR Fingerprints
The peak size and peak heights from the GenoSpectrum peak files were extracted using a custom PERL script. The relative peak areas under the curve (abundance) were calculated by dividing an individual peak area by the total peak area. The most informative and reproducible fingerprint profile from the triplicate runs was chosen for analysis and all samples were interleaved into a data matrix that was used in subsequent Principal Coordinate analysis (PCO) and Diversity analysis.
Data Analysis
The primary comparison was between dextrose and EtOH fed rats at week 10 (8 weeks after daily high dose EtOH) at which time the EtOH treated rats developed endotoxemia (Keshavarzian et al., 2009)and steatohepatitis (Forsyth et al., 2009) Secondary analysis included time course of changes in microbiota composition by comparing EtOH and dextrose fed rats at 4, 6, and 10 weeks. The effects of the probiotic Lactobacillus GG (L-GG) and the prebiotic oats on microbiota were assessed by comparing EtOH-fed rats (at week 10) with EtOH+LGG or oats (at week 10). Finally, the effects of the EtOH treatment were compared in the ileum and colon samples.
A) Tools for Analysis of Diversity
Three diversity parameters derived from Information Theory are routinely used to compare ALH patterns (fingerprints): (i) Richness (S) which is equal to the number of peaks in a sample; (ii) the Shannon-Weaver Diversity Index (H) which is equal to Σ (Pi (ln Pi)) where Pi is the peak area; (iii) Evenness (E) which is equal to H/ln(S). For each sample, the mentioned indices were quantitatively assessed and compared between groups and time points. These indices are measures of how complex the community is and indicate changes in the community’s dynamics. A limitation is that they don’t identify which components have changed. T-tests, ANOVA and nonparametric tests such as Mann-Whitney U and Kruskal- Wallis were used to compare diversity indices using SPSS 16.0.
B) Principal Coordinate Analysis (PCO)
The Multi Variate Statistical Package (MVSP), Kovach Computing Services, Wales, UK, was used to perform PCO analysis. Basically, an Eigen analysis is performed on the data matrix using various distance metrics Graphically, PCO is a rotation of a swarm of data points in multidimensional space so that the longest axis (the axis with the greatest variance) is the first principal axis. The second longest axis orthogonal to the first is the second principal axis, and so forth. The first few axes represent the greatest amount of variation in the data set. The first two or three axes are generally expected to account for the largest proportion of the variance.
Results
Diversity of the ileal and colonic bacterial microbiome is different in both dextrose and alcohol-fed rats
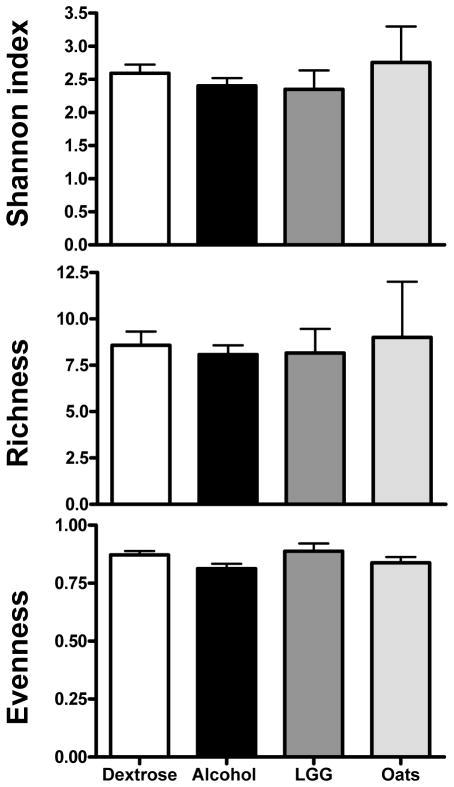
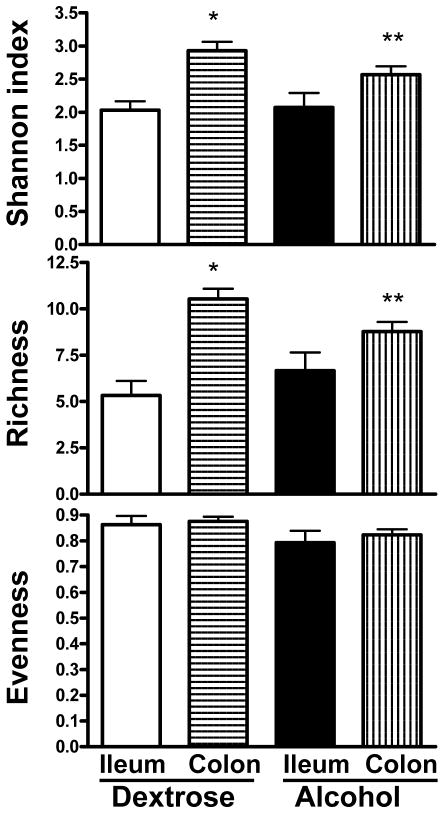
Figure 1 shows the mean diversity indices of the following groups: alcohol, dextrose, LGG and oats. When mean diversity indices for Shannon, richness and evenness at all time points and all locations (i.e. ileum and colon) for the groups (i.e. alcohol, dextrose, LGG and oats) were compared, there was no significant difference (p>0.05 for all three indices, parametric ANOVA for Shannon and richness and Kruskal-Wallis for evenness). When the time points and locations were separated for each group and then the mean diversity indices were compared in all groups (treating each time point as a separate group) using ANOVA, there was a significant difference between the Shannon and richness indices (p=0.01 and p=0.03) respectively. As expected, as shown in Figure 2, when the mean diversity indices of the ileum and colon of dextrose treated animals were compared, there were significant reductions in the Shannon and richness indices in the ileum (p<0.001 for both indices), suggesting that the rat bacterial microbiota composition differs between the ileum and the colon. When the mean diversity indices of the ileum and colon of alcohol treated animals were compared, as shown in Figure 2, there was also a similar significant reduction in the ileal Shannon (p=0.048) and richness indices (p=0.047). Thus, bacterial microbiota composition in the ileum remained different from the colon even after EtOH feeding. However, there was a significant reduction in the magnitude of the difference between the ileal and colonic microbiota diversity indices in EtOH treated animals. Thus, bacterial microbiota composition in the ileum approached colonic composition after alcohol feeding.
Figure 1.
Mean diversity indices for dextrose, alcohol, LGG and oats groups. Dextrose group is given as white bars; alcohol group as black bars; LGG group as dark grey bars; and oats group as light grey bars. Data is combined for the entire group across all time points, as well as for the ileum and colon samples for the dextrose and alcohol groups. Data shown as mean with SEM. There were no statistically significant differences between the four groups by parametric ANOVA for Shannon and richness; and by Kruskal-Wallis for evenness.
Figure 2.
Mean diversity indices for dextrose and alcohol groups in the ileum and the colon. Dextrose group ileal samples are given as white bars, dextrose group colon samples as horizontal stripes, alcohol group ileal samples as black bars, alcohol group colon samples as vertical stripes. Data is combined for the entire group across all time points. Data shown as mean with SEM. * p<0.05 when ileum and colon are compared in the dextrose group by independent samples T test for Shannon and richness; ** p<0.05 when ileum and colon are compared in the alcohol group independent samples T test for Shannon and richness.
Chronic daily alcohol administration causes dysbiosis in the colonic microbiome after 10 weeks of feeding
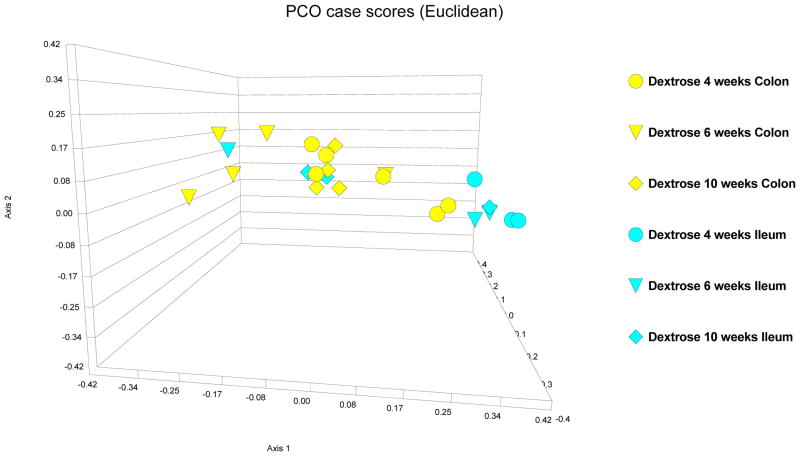
PCO, a multivariate reduction analysis, was performed on all the LH-PCR fingerprint data obtained from all animals. At first, in dextrose-fed rats, the variation in the ileal and colonic bacterial mucosa-associated microbiota were compared over the 10 week course of the experimental treatments: Samples obtained from ileum (in blue color code) and those obtained from the colon (in yellow color code) in the dextrose treated rats are given in Figure 3. Bacterial microbiota composition in the ileum appears distinct from the colon. This result parallels what is seen with the diversity indices, demonstrating a significant difference between the ileal and colonic diversity indices (as described in the above section and shown in Figure 2). In dextrose-treated animals, there is a general pattern where most of the ileal LH-PCR fingerprint data at 4 weeks clusters together toward the right side of the graph, with one ileal sample at 6 weeks and two ileal samples at 10 weeks being distinct from the main ileal cluster. Additionally, there is variation in the LH-PCR data for the colonic microbiota over the course of the dextrose treatment. Despite this variation however, there seems to be a core cluster of samples representing the colonic mucosa-associated bacterial microbiota that is distinct from the ileal cluster with two colonic samples at 4 weeks that are close, but still distinct to the ileal cluster. Dextrose feeding appears to transiently affect the colonic mucosa-associated bacterial microbiota fingerprint in some of the samples, but overall the colonic microbiota pattern seems to return to the core colonic cluster over time. Thus, some of the variations in bacterial microbiota fingerprint patterns over the course of 10 weeks may simply represent the dynamic nature of the gut microbiome.
Figure 3.
PCO case scores [Euclidean] of LH-PCR of the colonic and ileal microbiome in dextrose fed rats. 4 week data is depicted as circles; 8 week data is depicted as triangles; 10 week data is depicted as diamonds. Yellow is dextrose fed microbiome in colon and turquoise is dextrose fed microbiome in ileum. The data demonstrate a distinct microbiome composition in the ileum and colon of dextrose fed rats. There are subtle changes in the microbiome pattern in both ileum and colon over the 10 week course of the experiment. But, the main ileal and colonic clusters appear to remain distinct in most samples.
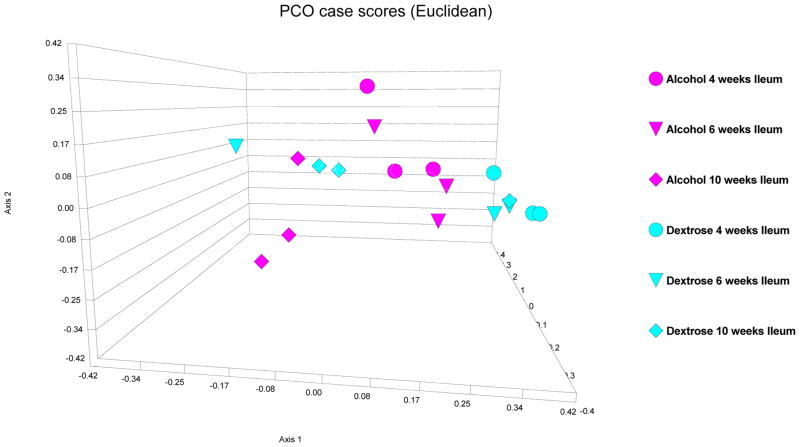
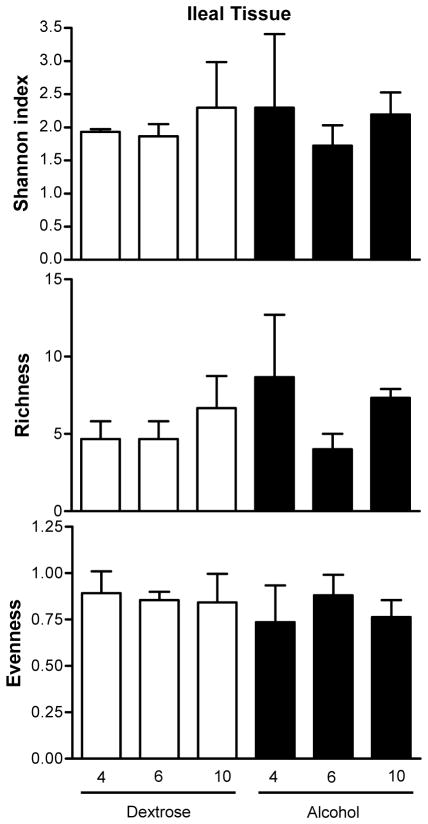
First, in alcohol-fed rats, colonic and ileal bacterial microbiota fingerprint patterns were interrogated at the 10 week time point (i.e. 8 weeks after daily high and stable dose of daily EtOH gavage), because our previous data demonstrated that these rats develop endotoxemia and steatohepatitis by the 10th week of EtOH treatment (Keshavarzian et al., 2009). Then, in order to determine a time course for development of changes in the bacterial microbiota composition (i.e. dysbiosis), ileal and colonic 16s rRNA fingerprint patterns were interrogated in both dextrose-fed and alcohol-fed rats at 4 and 8 weeks. Figures 3 and 4, depict the PCO of LH-PCR bacterial fingerprint data from the dextrose and alcohol treated rat ileal and colon samples. In the ileum, alcohol feeding did not result in a different pattern compared to dextrose feeding (Figure 4). Indeed, in the ileum, there was no significant difference in any of the mean diversity indices between dextrose and alcohol fed rats for all groups and time points (p=0.735, 0.557 and 0.093 by parametric ANOVA, Kruskal-Wallis and parametric ANOVA, for Shannon and evenness and richness, respectively), as shown in Figure 5. In the ileum at any of the three time points (4,6,10 weeks), when Shannon, evenness and richness were compared between the alcohol and dextrose group by independent samples T test (for Shannon and richness) or Mann-Whitney U (for evenness), there was also no difference as expected (p>0.05 for all) (Figure 5).
Figure 4.
PCO case scores [Euclidean] of LH-PCR of the ileal microbiome in dextrose fed [turquoise] and alcohol fed [purple] rats. 4 week data is depicted as circles; 8 week data is depicted as triangles; 10 week data is depicted as diamonds. Alcohol feeding did not result in a distinct pattern compared to dextrose fed rats in the ileum.
Figure 5.
Mean diversity indices in the ileum. Dextrose time points are given as white bars; alcohol time points as black bars. Data shown as mean with SEM. There were no statistically significant differences.
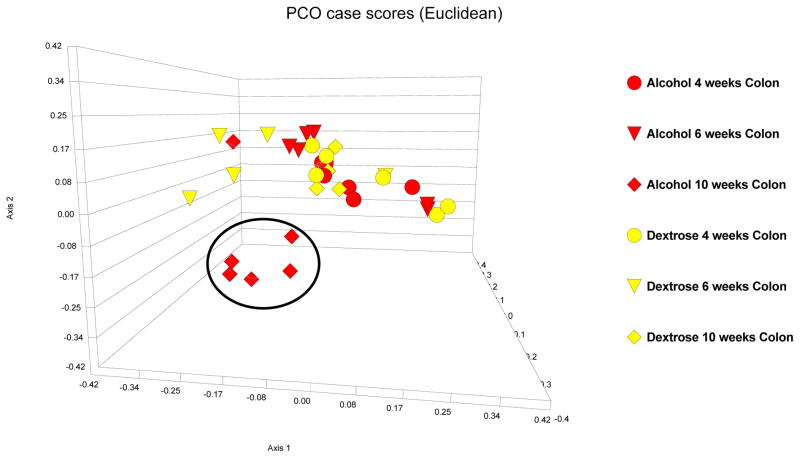
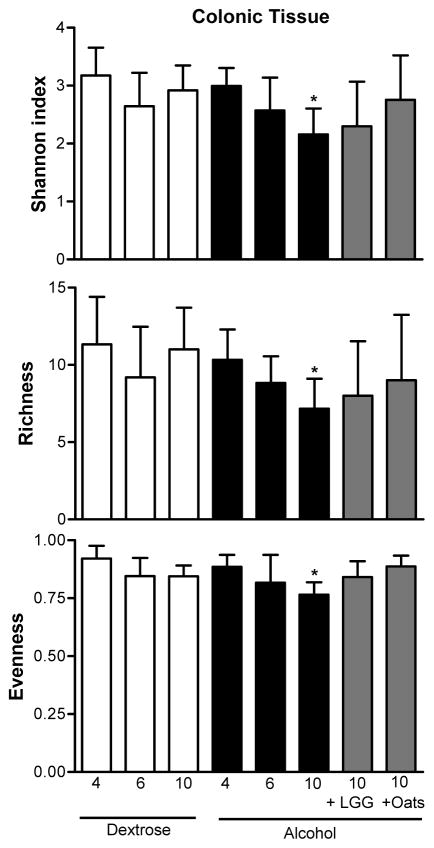
In contrast to the ileal microbiome, after 10 weeks of alcohol feeding, mucosa-associated bacterial microbiota LH-PCR fingerprints in the colon were markedly different (compatible with a dysbiotic mucosa-associated bacterial microbiome) in all but one of the alcohol-fed rats, compared to dextrose-fed rats (Figure 6). Figure 6 also demonstrates that the colonic LH-PCR fingerprints in the alcohol-fed rats initially (i.e. at 4 and 6 weeks) cluster with the dextrose fed rats suggesting that it takes 10 weeks of EtOH treatment (including 8 weeks of daily high dose) to cause dysbiosis in the rat mucosa-associated colonic microbiota. Additionally, in the colon only, when the mean diversity indices were compared in all groups at all time points, as shown in Figure 7, there was a statistically significant difference between the Shannon and evenness (p=0.047 and 0.037, by parametric ANOVA and Kruskal- Wallis respectively). Indeed, alcohol treatment caused a significant change in all mean indices at 10 weeks of daily EtOH feeding in the colon samples when compared to 10 weeks of dextrose feeding (p= 0.028, and 0.05 and 0.030 by independent samples T test or Mann- Whitney U and independent T tests, for Shannon, evenness and richness, respectively) (Figure 7). There was no difference when alcohol and dextrose samples from the colon were compared at weeks 4 and 6 in any of the mean indices (Figure 7).
Figure 6.
PCO case scores [Euclidean] of LH-PCR of the colonic microbiome in Dextrose fed [yellow] and alcohol fed [red] rats. 4 week data is depicted as circles; 8 week data is depicted as triangles; 10 week data is depicted as diamonds. 10 weeks of daily alcohol feeding caused a distinct change in the microbiome pattern compared to the 10 week dextrose feeding [alcohol-induced dysbiosis].
Figure 7.
Mean diversity indices in the colon. Dextrose time points are given as white bars; alcohol time points as black bars. Alcohol and lactobacillus 10 week data as well as alcohol and oats 10 week data are given in grey bars. Data shown as mean with SEM. * p<0.05 when 10 week data point in alcohol and dextrose fed animals were compared using independent samples T test or Mann- Whitney U and independent T tests, for Shannon, evenness and richness, respectively.
Lactobacillus GG and oats supplementation prevented alcohol-induced colonic dysbiosis
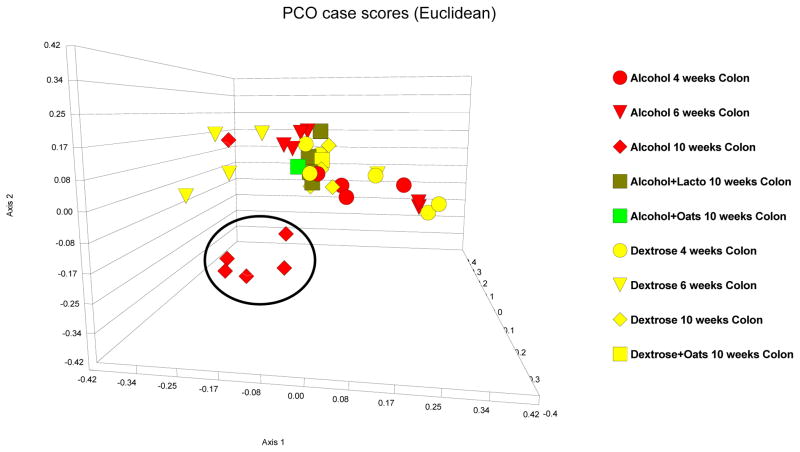
LH-PCR colonic microbiota fingerprints in alcohol-fed rats that also received either a probiotic (lactobacillus GG) or a prebiotic (oats) were next interrogated. Both Lactobacillus GG and oats supplementation appeared to prevent alcohol-induced alteration of the mucosa-associated colonic bacterial microbiota: Colonic bacterial microbiota composition in alcohol-fed rats that also received lactobacillus GG or oats supplementation were similar to the microbiota composition of rats that received 10 weeks of dextrose and these samples clustered within the core colonic cluster by PCO (Figure 8). Furthermore, both Lactobacillus GG and oats prevented alcohol-induced changes in the mean colonic diversity indices (p>0.05 for all three indices by ANOVA and Kruskal-Wallis for a difference when dextrose and LGG and oats are compared) (Figure 7).
Figure 8.
PCO case scores [Euclidean] of LH-PCR of the colonic microbiome in Dextrose fed [turquoise], alcohol fed [purple] rats. 4 week data is depicted as circles; 8 week data is depicted as triangles; 10 week data is depicted as diamonds. Dark green squares are probiotic (Lactobacillus GG) treated rat colon samples and light green squares are prebiotic (oats) treated rat colon samples. 10 weeks of daily alcohol feeding caused a distinct change in the microbiome pattern compared to the 10 week dextrose feeding [alcohol-induced dysbiosis]. Both daily oats and lactobacillus GG gavage prevented alcohol-induced dysbiosis at week 10.
Discussion
Mucosa–associated bacterial microbiota composition of the colon (colonic microbiome) is altered after 10 weeks of daily alcohol administration in rats, when elevated endotoxin levels and steatohepatitis is also present (Keshavarzian et al., 2009). The 10 week time period required for dysbiosis to occur is reflective of chronic alcohol consumption. Administration of probiotic Lactobacillus GG and prebiotic oats that previously prevented alcoholic steatohepatitis also prevents alcohol-induced dysbiosis (Forsyth et al., 2009; Keshavarzian et al., 2001).
It is believed that gut microbiota composition is partly due to the environmental factors such as diet and partly due to genetic influences (Ryu et al., 2008; Zoetendal et al., 2004). One important component of diet, at least in the western societies, is alcoholic beverages. However, the effect of alcohol ingestion on gut microbiota composition is not known. This is the first report that daily alcohol consumption affects colonic mucosa-associated bacterial microbiota composition in alcohol- fed rats.
One of the key questions in studying the gut microbiota is which method is best suited to interrogate the microbiota because our ability to quantify the number and kinds of microorganisms within a community is fundamental to the understanding of the interactions between the microbiome and the homobiome in health and disease states. Molecular methods examine the DNA of 16S ribosomal RNA genes (16S rDNA) used in taxonomical classification of bacteria and have shown a 70% correlation with culture methods (Wilson and Blitchington, 1996) and can go above and beyond the data that can be obtained by culture techniques. Traditionally, one can interrogate a community using fingerprinting methods, which produces a PCR band pattern for the operational taxonomic units (OTU) in the community or, alternatively, one can use cloning and sequencing to identify the components of the community. Length Heterogeneity PCR (LH-PCR) has been validated as a survey tool to monitor the dynamics of microbial communities (Mills et al., 2003). LH-PCR fingerprinting characterizes microorganisms in a community by: 1) amplifying variable regions of genes that code for 16s rRNA, and 2) separating the natural variation in amplicon length on a denaturing gel or using a capillary fluorescent sequencer. The peak area in the profile is proportional to the abundance of that amplicon in the community. LH-PCR has the advantage of being accurate, fast, reliable and inexpensive. Indeed, LH-PCR was used to estimate the diversity present in bacterioplankton (Suzuki et al., 1998). This method was highly reproducible (Dunbar et al., 2001; Mills et al., 2003; Ritchie et al., 2000). We have previously used LH-PCR to study gut microbiota in healthy human subjects and patients with pouchitis (Komanduri et al., 2007). The LH-PCR fingerprinting technique is highly suitable as an initial screening tool to look for differences in gut microbiota composition induced by ETOH. However, while LH-PCR fingerprinting can determine bacterial profiles and abundances, it cannot identify the exact bacterial species in a community. Furthermore, it has been shown that the same size PCR amplicons can come from different species and that different strains of the same species can produce different amplicon sizes (Mills et al., 2003). This problem is similar to T-RFLP and is a major limitation of all fingerprinting technologies. Thus, additional techniques like traditional cloning and sequencing or pyrosequencing methodology (such as our novel Multitag version) are capable of identifying the species in complex communities. Our study now provides the rationale to undertake a more expensive and complex task of sequencing gut microbiota in alcohol-fed rodents and alcoholic subjects with and without liver disease.
Dysbiotic gut microbiota can contribute to the initiation and/or progression of alcoholic steatohepatitis by a variety of mechanisms: These include 1) initiation or worsening of gut leakiness; 2) production of large amounts of proinflammatory factors in the gut lumen that could overwhelm the intestinal barrier; as well as 3) alterations in the liver metabolic pathways that may contribute to steatohepatitis. Indeed, significant cross-talk between intestinal epithelial cells and luminal bacteria have been demonstrated by several investigators (Resta-Lenert and Barrett, 2003; Resta-Lenert and Barrett, 2006; Tao et al., 2006; Zhang et al., 2005) and this constant communication can regulate the intestinal barrier through bacterial derived products: For example, commensal bacteria are actively involved in regulation of intestinal barrier function by interaction of their products with epithelial cells and key paracellular structures (Ismail and Hooper, 2005). Microbiota and their products (e.g. endotoxin) modulate barrier function by affecting epithelial pro-inflammatory responses, protein expression, and mucosal repair functions (Berkes et al., 2003). Although some indigenous bacterial populations provide benefits to their hosts, others remain “unfriendly.” A “normal” “non-dysbiotic” microbiota is expected to keep those “unfriendly” bacteria in check. This system of checks and balances may disappear in dysbiosis, where the composition and phenotypes of bacteria change which subsequently may lead to barrier disruption. Thus, dysbiotic microbiota can potentially initiate or worsen alcohol-induced gut leakiness and contribute to endotoxemia in patients with ALD.
Secondly, in addition to barrier disruption, increased production of endotoxin and other pro-inflammatory products by the dysbiotic microbiota is another possible mechanism of endotoxemia, and liver injury seen in ALD. Endotoxin and other gut-derived bacterial products have been implicated in many inflammatory disorders such as sepsis associated with trauma or burns (Parrillo et al., 1990; Suffredini et al., 1989), non-alcoholic steatohepatitis (NASH) (Farrell and Larter, 2006; Yang et al., 1997), and inflammatory bowel disease (IBD) (Caradonna et al., 2000; Gardiner et al., 1995). Endotoxin can prime and activate Kupffer cells of macrophage lineage in chronically EtOH fed rats, such that these cells overproduce cytokines such as TNF, IL-6, and IL-8 (Bhagwandeen et al., 1987; Hill D, 1997). These cytokines not only injure hepatocytes directly, but they also initiate a hepatic necro-inflammatory cascade (HNIC), which includes migration of other leukocytes, including neutrophils (PMNs), into the liver (Hill D, 1997; Lumeng and Crabb, 2001). Such leukocytes can then produce injurious products, especially oxidants like nitric oxide & peroxynitrite that cause liver cell necrosis. The EtOH-endotoxin synergy and other direct metabolic effects of EtOH on the liver (e.g. hypoxia or perturbation of NO-dependent pathways), can initiate liver injury, and can create a vicious circle that sustains a chronic necro-inflammatory process that hastens the onset of alcoholic steatohepatitis and eventually liver failure. Even if Kupffer cells are made dysfunctional by EtOH, dysbiosis and its associated endotoxemia could still be a key pathogenic factor in ALD: Potential reduction of endotoxemia from dysbiotic bacteria by altering the gut flora might decrease the amount of endotoxin exposure, even in potentially dysfunctional Kupffer cells.
Thirdly, metabolic alterations in the host especially as a direct effect of the gut microbiome have also been described (Backhed et al., 2004; Martin et al., 2009). Specifically, transmethylation pathways that connect phospholipids, phosphocholine, betaine, methionine and homocysteine and their connections to carnitine metabolism as well as changes in hepatic lipogenic enzyme activities as a result of alterations in the bacterial gut microbiome, may also be relevant to the pathogenesis of ALD(Martin et al., 2009). Thus, potential contribution of dysbiotic microbiota for development of alcoholic steatohepatitis is not limited to increase endotoxin production and endotoxemia. Further studies are needed to determine whether changes in microbiota contribute to development of liver injury by their ability to influence lipid metabolism in the liver which could exacerbate alcohol-induced deleterious changes in hepatic lipid homeostasis.
In the present study, we found that there was little to no dysbiosis after 4–6 weeks of daily alcohol feeding and dysbiosis occurred only after 10 weeks of daily alcohol feeding. In contrast, we previously showed that endotoxemia occurs after 4 weeks of daily alcohol feeding in these rats (Keshavarzian et al., 2009). Thus, at least in our current data set, the observed dysbiosis does not appear to be the primary source of initial endotoxemia noted after 4 weeks of daily alcohol feeding. This initial endotoxemia appears to be due to gut leakiness that was present after only 2 weeks of alcohol feeding (Keshavarzian et al., 2009). However, our observed dysbiosis after 10 weeks of alcohol feeding could contribute to more marked and sustained gut leakiness and endotoxemia noted after 8 to 10 weeks of alcohol feeding. Thus, when our prior studies are taken into the context of this study, the findings render support to a hypothesis that endotoxemia in alcoholics is multi-factorial and could be due to both dysbiotic microbiome and gut leakiness. When our findings are put into context with published evidence, it is plausible to suggest that a dysbiotic microbiome could contribute to alcohol-induced endotoxemia in its later stages.
It is important to note that alcohol induced changes in the gut microbiota composition appear to be reversible with LGG and oats in our study. LGG has been shown to attenuate endotoxemia and alcoholic steatohepatitis in a rodent model of ALD (Nanji et al., 1994), but the mechanism underlying the effectiveness of LGG has not been delineated before, and our data indicate alterations in gut microbiota composition could be one mechanism. Similarly, probiotics in another study has been demonstrated to alter liver metabolism favorably in alcohol fed animals (Martin et al., 2009). One limitation of our probiotic and prebiotic data is the relatively small number of rats included in this type of analysis. Therefore, further experiments are needed to confirm these findings.
In summary, our findings demonstrate the first evidence that dysbiosis occurs after chronic alcohol exposure. Such changes in gut microbiota may potentially contribute to the pathogenesis of liver disease by altering gut leakiness, the production of pro-inflammatory factors (such as endotoxin), and/or liver metabolic pathways. These changes add another layer of complexity to the pathogenesis of ALD and open doors to new avenues of research. Now that our report establishes the proof of concept that alcohol feeding can cause dysbiosis, mechanistic studies are needed to comprehensively determine the impact of dysbiotic microbiota in the pathogenesis of ALD. This study also provides rationale to explore gut microbiota in alcoholic humans: Further investigations into gut microbiota composition in alcoholism have the potential to identify new diagnostic as well as therapeutic targets to prevent ALD. More specifically, identification of a specific pattern of dysbiotic microbiota could potentially identify susceptible heavy drinkers who are at risk for ALD and intervene at earlier stages of ALD or to study therapeutic interventions (such as pre- or probiotics) targeted towards dysbiotic microbiota to prevent ALD.
Acknowledgments
We thank Mrs. Jay Rangan, B.Sc. for her technical assistance. The study was supported by grant RO-1 NIAAA #AA013745 (to A.K.), R21s AT001628 and DK071838 (to E.M.). This study has also been supported by a generous special gift to the research program of the Division of Digestive Diseases and Nutrition by Mr. and Mrs. Larry and Barbara Field.
References
- Adachi Y, Moore LE, Bradford BU, Gao W, Thurman RG. Antibiotics prevent liver injury in rats following long-term exposure to ethanol. Gastroenterology. 1995;108(1):218–24. doi: 10.1016/0016-5085(95)90027-6. [DOI] [PubMed] [Google Scholar]
- Backhed F, Ding H, Wang T, Hooper LV, Koh GY, Nagy A, Semenkovich CF, Gordon JI. The gut microbiota as an environmental factor that regulates fat storage. Proc Natl Acad Sci U S A. 2004;101(44):15718–23. doi: 10.1073/pnas.0407076101. [DOI] [PMC free article] [PubMed] [Google Scholar]
- Berkes J, Viswanathan VK, Savkovic SD, Hecht G. Intestinal epithelial responses to enteric pathogens: effects on the tight junction barrier, ion transport, and inflammation. Gut. 2003;52(3):439–51. doi: 10.1136/gut.52.3.439. [DOI] [PMC free article] [PubMed] [Google Scholar]
- Bhagwandeen BS, Apte M, Manwarring L, Dickeson J. Endotoxin induced hepatic necrosis in rats on an alcohol diet. J Pathol. 1987;152(1):47–53. doi: 10.1002/path.1711520107. [DOI] [PubMed] [Google Scholar]
- Bigatello LM, Broitman SA, Fattori L, Di Paoli M, Pontello M, Bevilacqua G, Nespoli A. Endotoxemia, encephalopathy, and mortality in cirrhotic patients. Am J Gastroenterol. 1987;82(1):11–5. [PubMed] [Google Scholar]
- Caradonna L, Amati L, Magrone T, Pellegrino NM, Jirillo E, Caccavo D. Enteric bacteria, lipopolysaccharides and related cytokines in inflammatory bowel disease: biological and clinical significance. J Endotoxin Res. 2000;6(3):205–14. [PubMed] [Google Scholar]
- Criado-Jimenez M, Rivas-Cabanero L, Martin-Oterino JA, Lopez-Novoa JM, Sanchez-Rodriguez A. Nitric oxide production by mononuclear leukocytes in alcoholic cirrhosis. J Mol Med. 1995;73(1):31–3. doi: 10.1007/BF00203616. [DOI] [PubMed] [Google Scholar]
- Dunbar J, Ticknor LO, Kuske CR. Phylogenetic specificity and reproducibility and new method for analysis of terminal restriction fragment profiles of 16S rRNA genes from bacterial communities. Appl Environ Microbiol. 2001;67(1):190–7. doi: 10.1128/AEM.67.1.190-197.2001. [DOI] [PMC free article] [PubMed] [Google Scholar]
- Enomoto N, Ikejima K, Bradford BU, Rivera CA, Kono H, Goto M, Yamashina S, Schemmer P, Kitamura T, Oide H, Takei Y, Hirose M, Shimizu H, Miyazaki A, Brenner DA, Sato N, Thurman RG. Role of Kupffer cells and gut-derived endotoxins in alcoholic liver injury. J Gastroenterol Hepatol. 2000;15(Suppl):D20–5. doi: 10.1046/j.1440-1746.2000.02179.x. [DOI] [PubMed] [Google Scholar]
- Farrell GC, Larter CZ. Nonalcoholic fatty liver disease: from steatosis to cirrhosis. Hepatology. 2006;43(2 Suppl 1):S99–S112. doi: 10.1002/hep.20973. [DOI] [PubMed] [Google Scholar]
- Forsyth CB, Farhadi A, Jakate SM, Tang Y, Shaikh M, Keshavarzian A. Lactobacillus GG treatment ameliorates alcohol-induced intestinal oxidative stress, gut leakiness, and liver injury in a rat model of alcoholic steatohepatitis. Alcohol. 2009;43(2):163–72. doi: 10.1016/j.alcohol.2008.12.009. [DOI] [PMC free article] [PubMed] [Google Scholar]
- Frank DN, St Amand AL, Feldman RA, Boedeker EC, Harpaz N, Pace NR. Molecular-phylogenetic characterization of microbial community imbalances in human inflammatory bowel diseases. Proc Natl Acad Sci U S A. 2007;104(34):13780–5. doi: 10.1073/pnas.0706625104. [DOI] [PMC free article] [PubMed] [Google Scholar]
- Fukui H, Brauner B, Bode JC, Bode C. Plasma endotoxin concentrations in patients with alcoholic and non-alcoholic liver disease: reevaluation with an improved chromogenic assay. J Hepatol. 1991;12(2):162–9. doi: 10.1016/0168-8278(91)90933-3. [DOI] [PubMed] [Google Scholar]
- Gardiner KR, Halliday MI, Barclay GR, Milne L, Brown D, Stephens S, Maxwell RJ, Rowlands BJ. Significance of systemic endotoxaemia in inflammatory bowel disease. Gut. 1995;36(6):897–901. doi: 10.1136/gut.36.6.897. [DOI] [PMC free article] [PubMed] [Google Scholar]
- Grant BF, Dufour MC, Harford TC. Epidemiology of alcoholic liver disease. Semin Liver Dis. 1988;8(1):12–25. doi: 10.1055/s-2008-1040525. [DOI] [PubMed] [Google Scholar]
- Hill DSS, McClain C, Diehl A, Tsukamoto H. Cytokines and Liver Disease. Marcel Dekker, Inc; New York, NY: 1997. [Google Scholar]
- Hunt NC, Goldin RD. Nitric oxide production by monocytes in alcoholic liver disease. J Hepatol. 1992;14(2–3):146–50. doi: 10.1016/0168-8278(92)90150-n. [DOI] [PubMed] [Google Scholar]
- Ismail AS, Hooper LV. Epithelial cells and their neighbors. IV. Bacterial contributions to intestinal epithelial barrier integrity. Am J Physiol Gastrointest Liver Physiol. 2005;289(5):G779–84. doi: 10.1152/ajpgi.00203.2005. [DOI] [PubMed] [Google Scholar]
- Keshavarzian A, Choudhary S, Holmes EW, Yong S, Banan A, Jakate S, Fields JZ. Preventing gut leakiness by oats supplementation ameliorates alcohol-induced liver damage in rats. J Pharmacol Exp Ther. 2001;299(2):442–8. [PubMed] [Google Scholar]
- Keshavarzian A, Farhadi A, Forsyth CB, Rangan J, Jakate S, Shaikh M, Banan A, Fields JZ. Evidence that chronic alcohol exposure promotes intestinal oxidative stress, intestinal hyperpermeability and endotoxemia prior to development of alcoholic steatohepatitis in rats. J Hepatol. 2009;50(3):538–47. doi: 10.1016/j.jhep.2008.10.028. [DOI] [PMC free article] [PubMed] [Google Scholar]
- Keshavarzian A, Holmes EW, Patel M, Iber F, Fields JZ, Pethkar S. Leaky gut in alcoholic cirrhosis: a possible mechanism for alcohol-induced liver damage. Am J Gastroenterol. 1999;94(1):200–7. doi: 10.1111/j.1572-0241.1999.00797.x. [DOI] [PubMed] [Google Scholar]
- Komanduri S, Gillevet PM, Sikaroodi M, Mutlu E, Keshavarzian A. Dysbiosis in pouchitis: evidence of unique microfloral patterns in pouch inflammation. Clin Gastroenterol Hepatol. 2007;5(3):352–60. doi: 10.1016/j.cgh.2007.01.001. [DOI] [PubMed] [Google Scholar]
- Lumeng L, Crabb DW. Alcoholic liver disease. Curr Opin Gastroenterol. 2001;17(3):211–20. doi: 10.1097/00001574-200105000-00004. [DOI] [PubMed] [Google Scholar]
- Macfarlane GT. The human colonic microbiota. Kluwer Academic Publishers; 1999. [Google Scholar]
- Martin FP, Sprenger N, Yap IK, Wang Y, Bibiloni R, Rochat F, Rezzi S, Cherbut C, Kochhar S, Lindon JC, Holmes E, Nicholson JK. Panorganismal Gut Microbiome-Host Metabolic Crosstalk. J Proteome Res. 2009;8(4):2090–2105. doi: 10.1021/pr801068x. [DOI] [PubMed] [Google Scholar]
- McClain CJ, Cohen DA. Increased tumor necrosis factor production by monocytes in alcoholic hepatitis. Hepatology. 1989;9(3):349–51. doi: 10.1002/hep.1840090302. [DOI] [PubMed] [Google Scholar]
- Mills DK, Fitzgerald K, Litchfield CD, Gillevet PM. A comparison of DNA profiling techniques for monitoring nutrient impact on microbial community composition during bioremediation of petroleum-contaminated soils. J Microbiol Methods. 2003;54(1):57–74. doi: 10.1016/s0167-7012(03)00007-1. [DOI] [PubMed] [Google Scholar]
- Nanji AA, Khettry U, Sadrzadeh SM. Lactobacillus feeding reduces endotoxemia and severity of experimental alcoholic liver (disease) Proc Soc Exp Biol Med. 1994;205(3):243–7. doi: 10.3181/00379727-205-43703. [DOI] [PubMed] [Google Scholar]
- Nanji AA, Khettry U, Sadrzadeh SM, Yamanaka T. Severity of liver injury in experimental alcoholic liver disease. Correlation with plasma endotoxin, prostaglandin E2, leukotriene B4, and thromboxane B2. Am J Pathol. 1993;142(2):367–73. [PMC free article] [PubMed] [Google Scholar]
- Parrillo JE, Parker MM, Natanson C, Suffredini AF, Danner RL, Cunnion RE, Ognibene FP. Septic shock in humans. Advances in the understanding of pathogenesis, cardiovascular dysfunction, and therapy. Ann Intern Med. 1990;113(3):227–42. doi: 10.7326/0003-4819-113-3-227. [DOI] [PubMed] [Google Scholar]
- Resta-Lenert S, Barrett KE. Live probiotics protect intestinal epithelial cells from the effects of infection with enteroinvasive Escherichia coli (EIEC) Gut. 2003;52(7):988–97. doi: 10.1136/gut.52.7.988. [DOI] [PMC free article] [PubMed] [Google Scholar]
- Resta-Lenert S, Barrett KE. Probiotics and commensals reverse TNF-alpha- and IFN-gamma-induced dysfunction in human intestinal epithelial cells. Gastroenterology. 2006;130(3):731–46. doi: 10.1053/j.gastro.2005.12.015. [DOI] [PubMed] [Google Scholar]
- Ritchie NJ, Schutter ME, Dick RP, Myrold DD. Use of length heterogeneity PCR and fatty acid methyl ester profiles to characterize microbial communities in soil. Appl Environ Microbiol. 2000;66(4):1668–75. doi: 10.1128/aem.66.4.1668-1675.2000. [DOI] [PMC free article] [PubMed] [Google Scholar]
- Ryu JH, Kim SH, Lee HY, Bai JY, Nam YD, Bae JW, Lee DG, Shin SC, Ha EM, Lee WJ. Innate immune homeostasis by the homeobox gene caudal and commensal-gut mutualism in Drosophila. Science. 2008;319(5864):777–82. doi: 10.1126/science.1149357. [DOI] [PubMed] [Google Scholar]
- Sudo N, Sawamura S, Tanaka K, Aiba Y, Kubo C, Koga Y. The requirement of intestinal bacterial flora for the development of an IgE production system fully susceptible to oral tolerance induction. J Immunol. 1997;159(4):1739–45. [PubMed] [Google Scholar]
- Suffredini AF, Fromm RE, Parker MM, Brenner M, Kovacs JA, Wesley RA, Parrillo JE. The cardiovascular response of normal humans to the administration of endotoxin. N Engl J Med. 1989;321(5):280–7. doi: 10.1056/NEJM198908033210503. [DOI] [PubMed] [Google Scholar]
- Suzuki M, Rappe MS, Giovannoni SJ. Kinetic bias in estimates of coastal picoplankton community structure obtained by measurements of small-subunit rRNA gene PCR amplicon length heterogeneity. Appl Environ Microbiol. 1998;64(11):4522–9. doi: 10.1128/aem.64.11.4522-4529.1998. [DOI] [PMC free article] [PubMed] [Google Scholar]
- Tao Y, Drabik KA, Waypa TS, Musch MW, Alverdy JC, Schneewind O, Chang EB, Petrof EO. Soluble factors from Lactobacillus GG activate MAPKs and induce cytoprotective heat shock proteins in intestinal epithelial cells. Am J Physiol Cell Physiol. 2006;290(4):C1018–30. doi: 10.1152/ajpcell.00131.2005. [DOI] [PubMed] [Google Scholar]
- Wilson KH, Blitchington RB. Human colonic biota studied by ribosomal DNA sequence analysis. Appl Environ Microbiol. 1996;62(7):2273–8. doi: 10.1128/aem.62.7.2273-2278.1996. [DOI] [PMC free article] [PubMed] [Google Scholar]
- Yang SQ, Lin HZ, Lane MD, Clemens M, Diehl AM. Obesity increases sensitivity to endotoxin liver injury: implications for the pathogenesis of steatohepatitis. Proc Natl Acad Sci U S A. 1997;94(6):2557–62. doi: 10.1073/pnas.94.6.2557. [DOI] [PMC free article] [PubMed] [Google Scholar]
- Zhang L, Li N, Caicedo R, Neu J. Alive and dead Lactobacillus rhamnosus GG decrease tumor necrosis factor-alpha-induced interleukin-8 production in Caco-2 cells. J Nutr. 2005;135(7):1752–6. doi: 10.1093/jn/135.7.1752. [DOI] [PubMed] [Google Scholar]
- Zoetendal EG, Cheng B, Koike S, Mackie RI. Molecular microbial ecology of the gastrointestinal tract: from phylogeny to function. Curr Issues Intest Microbiol. 2004;5(2):31–47. [PubMed] [Google Scholar]


