

Abstract
Background
During aging, there is a decreased ability to maintain skeletal muscle mass and function (sarcopenia). Such changes in skeletal muscle are also co-morbidities of diseases including cancer, congestive heart failure and chronic obstructive pulmonary disease. The loss of muscle mass results in decreased strength and exercise tolerance and reduced ability to perform daily activities. Pharmacological agents addressing these pathologies could have significant clinical impact, but their identification requires understanding of mechanisms driving myotube formation (myogenesis) and atrophy and provision of relevant assays. The aim of this study was to develop robust in vitro methods to study human myogenesis.
Methods
Satellite cells were isolated by digestion of post-mortem skeletal muscle and selection using anti-CD56 MicroBeads. CD56+ cell-derived myotubes were quantified by high content imaging of myosin heavy chains. TaqMan-polymerase chain reaction arrays were used to quantify expression of 41 selected genes during differentiation. The effects of activin receptor agonists and tumour necrosis factor alpha (TNFα) on myogenesis and gene expression were characterised.
Results
Large-scale isolation of CD56+ cells enabled development of a quantitative myogenesis assay with maximal myotube formation 3 days after initiating differentiation. Gene expression analysis demonstrated expression of 19 genes changed substantially during myogenesis. TNFα and activin receptor agonists inhibited myogenesis and downregulated gene expression of muscle transcription factors, structural components and markers of oxidative phenotype, but only TNFα increased expression of pro-inflammatory markers.
Conclusions
We have developed methods for large-scale isolation of satellite cells from muscle and quantitative assays for studying human myogenesis. These systems may prove useful as part of a screening cascade designed to identify therapeutic agents for improving muscle function.
Electronic supplementary material
The online version of this article (doi:10.1007/s13539-012-0097-z) contains supplementary material, which is available to authorized users.
Keywords: Myogenesis, Satellite cells, CD56, Myostatin, TNFα, Image analysis
Background
Skeletal muscle mass in humans declines markedly in old age, a process that has been termed sarcopenia [1]. This age-related loss of muscle mass and strength is associated with mortality and disability and is an important aetiological factor in falls in older people. As life expectancy continues to grow, there is an increasing need to address this issue. Loss of skeletal muscle mass and function is also characteristic of muscular dystrophies and is a common co-morbidity of a number of other diseases including cancer, AIDS, congestive heart failure, COPD, sepsis and renal failure [2]. Although disuse atrophy probably explains the majority of the muscle mass loss observed in some of these conditions, other mechanisms such as inflammation and impaired myogenesis may also play a role. Myogenesis is the process by which new myofibres are formed and therefore is important in muscle growth, remodelling and repair. Satellite cells constitute the main myogenic activity in adult muscle and in response to stimuli such as myotrauma become activated, proliferate and express myogenic markers [3]. Ultimately, these cells fuse to existing muscle fibres or fuse together to form new myofibres. Changes in the number and function of satellite cells have been reported in elderly patients [4, 5] and in those suffering from certain muscular dystrophies [6], although similar studies in other diseases have, to our knowledge, not been undertaken. The relative abundance and ease of accessibility of satellite cells has encouraged significant pre-clinical research into this stem cell population and their potential for therapeutic applications in disorders of skeletal muscle. In many instances, such studies have employed satellite cells or myogenic cell lines derived from rodents, although a number of investigators have successfully isolated satellite cells from human skeletal muscle [7–11]. These latter research efforts have largely used small biopsy samples from patients undergoing surgery and focused on the characterisation of the isolated cells. Much less effort has been applied to developing assay systems using these cells to allow investigation of the effects of pharmacological agents on myogenesis and the molecular events underlying this process. Such research will nevertheless be instrumental in identifying new targets and mechanisms that modulate myogenesis and may ultimately lead to new therapeutic treatments for muscle disorders.
The aim of this study was to establish a robust method for isolating sufficiently large numbers of satellite cells from adult post-mortem human skeletal muscle to allow the development of myogenesis assays suitable for the study of pharmacological agents in a quantitative and relatively high-throughput manner. As part of the assay validation procedure, we investigated the effects of activin receptor ligands and tumour necrosis factor alpha (TNFα) both of which have been reported to inhibit the myogenesis process [12] and may be relevant to a number of diseases characterised by loss of muscle mass and function.
Methods
The study was approved by the Nottingham Research Ethics Committee 1 (reference number 08/H0403/132), and informed consent was provided by the patients’ next of kin.
Human skeletal muscle satellite cell isolation and purification
Human skeletal muscle satellite cells were derived from vastus lateralis quadriceps muscle of cadaver tissues at post-mortem. Details of the donors and tissue samples used are summarised in Table 1. Skeletal muscle tissue samples (50–100 g) were shipped and maintained at 4 °C for 2–4 days in Dulbecco’s modified Eagles medium (DMEM). They were trimmed of excess connective tissue and minced into pieces of approximately 1 mm3. The minced muscle was digested in 1 % type II collagenase (Worthington, Lakewood, NJ) at 37 °C for 1 h with intermittent agitation (using 1 ml digestion solution per gram tissue). Digested tissue was sieved through a course sieve and the filtrate removed. Incompletely digested tissue was further digested with 10× Trypsin (Invitrogen) at 37 °C for 2 h with intermittent agitation. Digestion was stopped by addition of DMEM containing 10 % foetal calf serum, and the cell suspension was filtered through a 100 μm filter. Cells were collected and re-suspended in skeletal muscle growth medium (Promocell) and plated into 225 cm2 flasks (Costar) coated with 0.2 % gelatine (using 12 flasks per 100 g of tissue). After 3–5 days incubation, cell debris and non-adherent cells were removed by replacing the skeletal muscle growth medium. Adherent cells were grown to 80 % confluency and recovered from flasks with Accutase (Invitrogen). Skeletal muscle satellite cells were purified using anti-human CD56-conjugated MicroBeads according to standard protocols (Miltenyi Biotec).
Table 1.
Summary of donor characteristics, cell purity and yield
| Donor | Age | Gender | Cause(s) of death | Time of cell isolation after death (h) | CD56 % expression pre-purification | CD56 % expression post-purification | Cell yield per gram tissuea |
|---|---|---|---|---|---|---|---|
| 1 | 55 | Male | Pneumonia, lung abscess | 54 | 85 % | 97 % | 2.9 × 10⁶ |
| 2 | 64 | Male | Congestive heart failure, renal failure | 35 | 77 % | 97 % | 2.4 × 10⁶ |
| 3 | 67 | Male | Multi-organ failure | 74 | 94 % | 99 % | 4.0 × 10⁶ |
| 4 | 58 | Male | Pneumonia, renal cancer | 97 | 84 % | 94 % | 4.0 × 10⁶ |
| 5 | 72 | Female | Myocardial infarction | 66 | 56 % | 98 % | 0.4 × 10⁶ |
| 6 | 62 | Male | Pneumonia, leukaemia | 47 | 37 % | 95 % | 1.2 × 10⁶ |
| 7 | 66 | Female | Renal failure, breast cancer | 50 | 54 % | 96 % | 1.8 × 10⁶ |
| 8 | 66 | Male | Pneumonia, non-small cell lung cancer | 66 | 72 % | 88 % | 0.8 × 10⁶ |
| 9 | 73 | Male | Cerebro-vascular haemorrhage | 73 | 87 % | 98 % | 5.4 × 10⁶ |
| 10 | 77 | Male | Heart failure | 77 | 92 % | 99 % | 0.2 × 10⁶ |
aPost-CD56 purification
Flow cytometry analysis
Cell preparations were re-suspended in phosphate buffered saline (PBS) containing 0.1 % bovine serum albumin (BSA) (flow cytometry (FC) buffer) at 1 × 10⁶ cells/ml and incubated with anti-human CD56-PC5 antibodies (clone 2A3) or IgG1 isotype control antibodies (Beckman Coulter) diluted 1:100 in FC buffer at room temperature for 20 min. Cells were washed twice in FC buffer and re-suspended in 0.3 ml of FC buffer. Percentage CD56 expression in cell preparations before and after CD56 MicroBeads purification were determined by standard methods on a Guava flow cytometer.
Myogenesis assay
The CD56+ purified cells were stored at passages 0 or 1. Each donor was assessed for its CD56+ expression and ability to form myotubes after storage. Assays were performed in black-walled half-well 96-well plates (Greiner) for immunocytochemical staining or clear 12-well plates (Costar) for gene expression studies. Plates were coated with 100–150 μg/ml ECM gel in DMEM (Sigma) for 2–4 h prior to addition of cells. Skeletal muscle satellite cells were used at passages 1–2 and plated at 31,250 cells/cm2 (approximately 90 % confluence) in DMEM/F12 medium containing 10 % horse serum (Lonza) for 24 h. Medium was removed (day 0) and cells incubated in DMEM/F12 (Lonza) containing 2 % horse serum (Lonza) (differentiation medium). Myostatin (Peprotech) and GDF-11 (R&D systems) were reconstituted in sterile double-distilled water (ddH2O) containing 0.1 % BSA and 4 mM HCl; activin A and TNFα (R&D systems) were reconstituted in PBS containing 0.1 % BSA. Ligands were further diluted in differentiation medium prior to addition to cells. Cells were incubated between 1 and 7 days with no replenishment of medium or ligands.
Immunocytochemical staining for myosin heavy chains
Cells were fixed in PBS containing 4 % paraformaldehyde, permeabilised in PBS containing 0.1 % Triton X-100 and blocked in PBS containing 3 % BSA. Cells were immunostained with anti-myosin slow- (clone Q7.5.4D) and fast-chain (clone MY-32) monoclonal antibodies or isotype control IgG1 (Sigma) followed by secondary labelling with an Alexa 488 conjugated anti-mouse IgG antibody (Invitrogen) and Hoescht 33342 dye (H-1399, Invitrogen). Cells were washed three to five times in PBS between fixing, permeabilisation and staining steps and stored in PBS.
Quantification of myotube formation
Immunostained myotubes were imaged by digital microscopy on the automated ImageXpress 5000A high-content platform (Molecular Devices). Images were acquired in two channels (Hoescht and Alexa-488) using a ×4 Plan Fluor objective and a single field of view per well representing approximately 45 % of the well area. The percent area of a field of view covered by myotubes was quantified using the MetaXpress Angiogenesis Tube Formation application module (Molecular Devices). Total nuclei counts per field of view were quantified using the MetaXpress Count Nuclei application module (Molecular Devices) as a measure of cell number and viability. The application modules classified myotubes and nuclei based on minimum and maximum width (micrometers) and intensity above background (gray levels). All treatments were performed in quadruplicate, and analysis was performed using data obtained from experiments with cells from three independent donors.
RNA isolation and cDNA synthesis
RNA was extracted using the RNeasy-96 RNA isolation protocol (Qiagen) that included a DNase incubation step and cDNA synthesised using VILO polymerase (Invitrogen). RNA and cDNA quantity and purity were measured using the Nanodrop ND8000 with sample quality criteria of RNA & cDNA 260/280 ratio >1.9; cDNA 260/230 ratio >1.9.
Gene expression analysis
Two hundred fifty ng of cDNA was assayed on custom-made TaqMan low-density arrays (TLDA; Applied Biosystems) containing 2× qPCR mastermix RT-QPRT-032X (Eurogentec). The genes analysed in TLDA assays are shown in Table 2. Polymerase chain reaction (PCR) conditions used were 94.5 °C for 10 min, followed by 40 cycles of 97 °C for 30 s and 59.7 °C for 1 min. Gene expression was normalised to a geometric mean of the quantification cycles (Cqs) of six reference genes (18S, GAPDH, Ubiquitin, HPRT, RPL13A, HMBS). Although included on the TLDA plates, B2M was not used in the reference gene analysis due to signal instability across samples. Raw Cqs data were analysed following the Minimum Information for Publication of Quantitative Real-Time PCR (MIQE) principles [44] using the delta delta Cq (DDCq) method: DCq is the difference between the target gene Cq and the geometric mean of the reference gene Cqs for the sample of interest. DDCq is the difference between the DCq of the sample of interest and the baseline sample DCq. DDCq (%max) is 100 multiplied by the difference between the DCq of the sample of interest and the sample with the lowest DDCq (the highest relative expression level) per treatment group. For the treated samples, the lowest DDCq is taken from the control (i.e. non-treated) group. Relative quantification is expressed as 2^-(DDCq); RQ(%max) = 2^-(DDCq(%max)). All treatments were performed in duplicate, and analysis was performed using data obtained from experiments with cells from a minimum of three independent donors.
Table 2.
Summary of genes analysed using TaqMan-PCR low-density assays (TLDA)
| Gene name | Official symbol | Gene description | Functional category | TLDA assay number |
|---|---|---|---|---|
| MYOD1 | MYOD1 | Myogenic differentiation 1 | Differentiation marker | Hs00159528_m1 |
| MYF5 | MYF5 | Myogenic factor 5 | Differentiation marker | Hs00271574_m1 |
| Myogenin | MYOG | Myogenin (myogenic factor 4) | Differentiation marker | Hs00231167_m1 |
| PAX7 | PAX7 | Paired box 7 isoform 1 | Differentiation marker | Hs00242962_m1 |
| MEF2A | MEF2A | Myocyte enhancer factor 2A | Differentiation marker | Hs00271535_m1 |
| Creatine kinase | CKM | Creatine kinase, muscle | Differentiation marker | Hs00176490_m1 |
| NCAM1 (CD56) | NCAM1 | Neural cell adhesion molecule 1 | Satellite cell marker | Hs00941833_m1 |
| Syndecan 3 | SDC3 | Syndecan 3 | Satellite cell marker | Hs00206320_m1 |
| Troponin I | TNNI1 | Troponin I type 1 (skeletal, slow) | Skeletal muscle structure | Hs00268531_m1 |
| Troponin II | TNNI2 | Troponin I type 2 (skeletal, fast) | Skeletal muscle structure | Hs00268536_g1 |
| MYH1 | MYH1 | Myosin heavy chain-2 (MYH-1) IIx fast | Skeletal muscle structure | Hs00428600_m1 |
| MYH2 | MYH2 | Myosin heavy chain-2 (MYH-2) IIa fast | Skeletal muscle structure | Hs00430042_m1 |
| MYH3 | MYH3 | Myosin heavy chain-3 (MYH-3) embryonic | Skeletal muscle structure | Hs00159463_m1 |
| MYH4 | MYH4 | Myosin heavy chain-2 (MYH-4) IIb fast | Skeletal muscle structure | Hs00255652_m1 |
| MYH7 | MYH7 | Myosin heavy chain-7 (MYH-7) slow | Skeletal muscle structure | Hs00165276_m1 |
| IGF1 | IGF1 | Insulin-like growth factor 1 (somatomedin C) | Anabolic | Hs01547656_m1 |
| Calpain 1 | CAPN1 | Calpain 1, (mu/I) large subunit | Atrophy | Hs00559804_m1 |
| Calpastatin | CAST | Calpastatin | Atrophy | Hs00156280_m1 |
| FBXO32 | FBXO32 | F-box protein 32 (MAFbx) | Atrophy | Hs00369714_m1 |
| FOXO1 | FOXO1 | Forkhead box O1 | Atrophy | Hs00231106_m1 |
| TRIM63 | TRIM63 | Tripartite motif-containing 63 (MURF-1) | Atrophy | Hs00261590_m1 |
| Myostatin | MSTN | Myostatin | Atrophy | Hs00193363_m1 |
| FRAP1 | FRAP1 | FK506 binding protein 12-rapamycin associated protein 1 (mTOR) | Catabolic | Hs00234522_m1 |
| GSK3β | GSK3B | Glycogen synthase kinase 3 beta | Catabolic | Hs00275656_m1 |
| TNFα | TNFα | Tumour necrosis factor (TNFα superfamily, member 2) | Inflammation | Hs00174128_m1 |
| TWEAK | TNFSF12;TNFSF13 | Tumour necrosis factor (ligand) superfamily, member 12 precursor (TWEAK) | Inflammation | Hs00356411_m1 |
| NOS2A | NOS2 | Nitric oxide synthase 2A (iNOS) | Inflammation | Hs00167257_m1 |
| IL6 | IL6 | Interleukin 6 (interferon, beta 2) | Inflammation | Hs00174131_m1 |
| p38 | MAPK1 | Mitogen-activated protein kinase 1 (p38) | Inflammation | Hs00177066_m1 |
| NFκB | NFKB1 | Nuclear factor of kappa light polypeptide gene enhancer in B-cells 1 (p105) | Inflammation | Hs00231653_m1 |
| IL15 | IL15 | Interleukin 15 preproprotein | Inflammation | Hs99999039_m1 |
| IL15 | CD36 | CD36 molecule (thrombospondin receptor) | Oxidative metabolism | Hs00354519_m1 |
| Citrate synthase | CS | Citrate synthase | Oxidative metabolism | Hs02574374_s1 |
| PPARδ | PPARD | Peroxisome proliferator-activated receptor delta | Oxidative metabolism | Hs00606407_m1 |
| PPARγc1α | PPARGC1A | Peroxisome proliferator-activated receptor gamma, coactivator 1 alpha | Oxidative metabolism | Hs00173304_m1 |
| PPARgc1β | PPARGC1B | Peroxisome proliferator-activated receptor gamma, coactivator 1 beta | Oxidative metabolism | Hs00370186_m1 |
| PEPCK1 | PCK1 | Phosphoenolpyruvate carboxykinase 1 (soluble) | Oxidative metabolism | Hs00159918_m1 |
| PRKAα1 | PRKAA1 | Protein kinase, AMP-activated, alpha 1 catalytic subunit | Oxidative metabolism | Hs01562315_m1 |
| LDHA | LDHA | Lactate dehydrogenase A | Oxidative metabolism | Hs00855332_g1 |
| Pyruvate kinase | PKM2 | Pyruvate kinase, muscle isoform M2 | Oxidative metabolism | Hs00987247_g1 |
| β-HADH | HADH | Beta hydrox acyl CoA dehy | Oxidative metabolism | Hs00193428_m1 |
| 18S | 18S | Ribosomal 18S | Housekeeper | Hs99999901_s1 |
| RPL13A | RPL13A | RPL13A | Housekeeper | Hs03043885_g1 |
| Ubiquitin C | UBC | Ubiquitin C | Housekeeper | Hs00824723_m1 |
| β-2-Microglobulin | B2M | Beta-2-microglobulin | Housekeeper | Hs99999907_m1 |
| GAPDH | GAPDH | GAPDH | Housekeeper | Hs99999905_m1 |
| HPRT1 | HPRT1 | HPRT | Housekeeper | Hs99999909_m1 |
| HMBS | HMBS | Hydroxymethyl-bilane synthase | Housekeeper | Hs00609297_m1 |
Summary of 48 genes included on custom-made TLDA plates showing gene name, official gene symbol, gene description and functional category TLDA assay number. The TLDA included 41 skeletal muscle related genes and seven reference genes for normalisation of gene expression data
Results
Skeletal muscle satellite cell isolation and purification
Human skeletal muscle satellite cells were isolated from vastus lateralis quadriceps muscle of cadaver tissues at post-mortem. The donor characteristics are summarised in Table 1. The time of cell isolation after death ranged from 35–97 h across the ten donors with no apparent correlation to downstream cell viability or yield. Following enzymatic digestion of the muscle tissue and removal of cell debris, morphological analysis of the adherent cultured cells by light microscopy suggested the presence of skeletal muscle satellite cells, endothelial cells and fibroblast-like cells (Fig. 1a–c). Cell preparations were further analysed by flow cytometry before and after purification (an example is shown in Fig. 1d–f). The expression of CD56, a marker of skeletal muscle, satellite cells ranged from 37–94 % in crude adherent cell preparations and increased to 88–99 % following purification using CD56-conjugated MicroBeads (Table 1). The cell yield after purification averaged 2.3 × 10⁶ cells/g tissue across the ten donors. Purified CD56+ cells, but not CD56- cell preparations, formed myotubes expressing myosin heavy chains after 7 days in differentiation medium (Fig. 1g, h). Co-staining of myotubes for myosin heavy chains and cell nuclei demonstrated that myotubes were multi-nucleated (Fig. 1i, j).
Fig. 1.
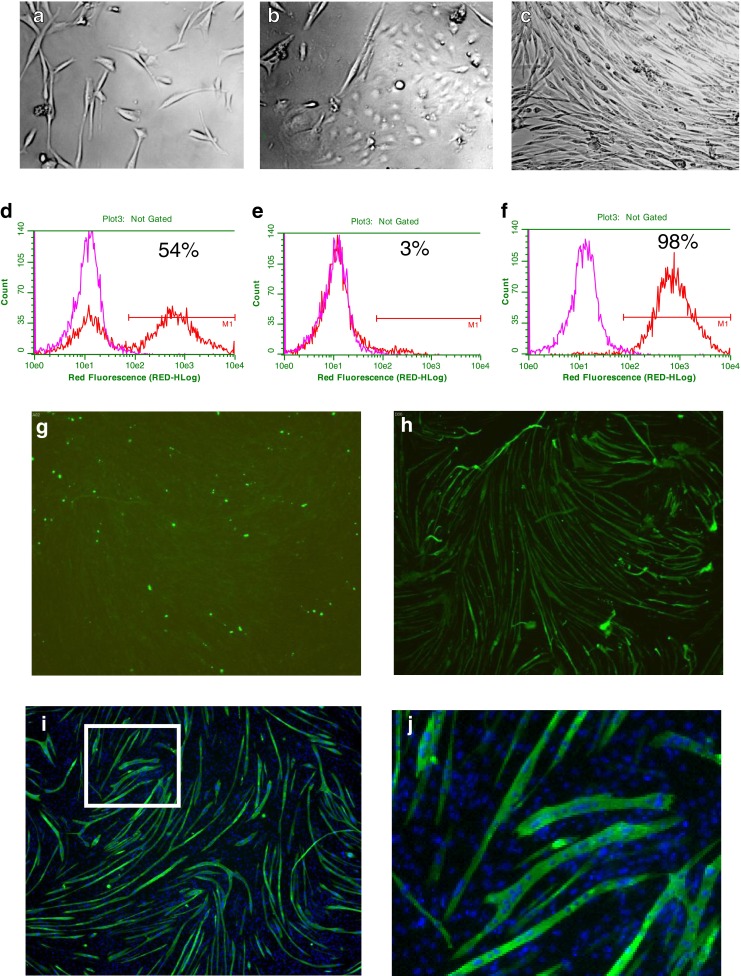
Representative examples of the morphology of adherent cell types in skeletal muscle cell preparations by light microscopy (×200 magnifications): satellite cells (a), endothelial-like cells (b) and fibroblast-like cells (c). Example of CD56 expression on adherent cell preparations pre- (d) and post-purification in CD56- (e) and CD56+ cell fractions (f) by flow cytometry. A comparison of immunostaining with anti-CD56 antibodies (red line) and isotype control antibody (pink lines) is shown. A linear region M1 was drawn at 1 % of cells in the isotype control (background), and cells in this region were determined CD56+. The percentage of CD56+ cells in each cell population is indicated. Representative images illustrating myotubes in CD56- (g) and CD56+ (h) cell fractions 7 days after treatment. Representative images illustrating myotubes co-stained for cell nuclei (i, j) and multi-nucleated myotubes (j). White box in i shows region of image enlarged in j. Myotubes were identified by immunostaining for myosin slow and fast chains
Development of a quantitative myogenesis assay
A 96-well format myogenesis assay was developed to enable characterisation of the myotubes formed from the CD56+-purified cells and to provide a platform for pharmacological screening. Myogenesis was quantified in an automated fashion using image analysis algorithms that classified myotubes based on both skeletal myosin expression (myosin heavy slow and fast chains) and morphology, using intensity and size thresholds, respectively. The percentage area of a field of view covered by myotubes was captured from the image analysis. Only differentiated multinuclear myotubes had significant skeletal myosin expression, and, as such, percentage area covered represented a robust measure of myogenesis (Figs. 1h and 2a). In order to determine the kinetics of myotube formation, a time course was performed. This revealed low-level expression of skeletal myosin at day 1 (24 h after eliciting differentiation) constituting less than 10 % of the area covered. This increased to a maximum coverage of 80 % by day 3 and then plateaued at this level for a further 4 days (Fig. 2b).
Fig. 2.

Representative images illustrating time course of myotube formation 1, 2 and 3 days after initiating myogenic differentiation (a). Quantitative analysis of % area covered (±SEM) with myotubes 0–7 days after initiating myogenic differentiation (b). Results with donors 5, 6 and 7 (Table 1) are shown (pink, blue and brown lines, respectively)
Characterisation of gene expression changes during myogenesis
TLDAs were employed to quantitatively explore the expression of 41 genes during myogenesis. The selected genes, encoding markers of myogenic differentiation, satellite cells, muscle atrophy, catabolism, inflammation, oxidative metabolism and structural components (Table 2) were studied over the 7 days post-induction of differentiation. These data are comprehensively tabulated in Online Resource 1. All data presented is the average percent change in gene expression in cells isolated from donors 2, 3 and 4 (Table 1). The expression of genes encoding the myogenic transcription factors MEF2A, MYOD1 and MYOG were increased during the time course of myogenesis. Gene expression of MYOD1 peaked on day 1, MEF2A on day 2 and MYOG on day 6 (Fig. 3a and Online Resource 1). In contrast, gene expression of myogenic transcription factor MYF5 was expressed at highest levels in myoblasts at the onset of culture and decreased over the time course of myogenesis (Fig. 3a). Expression of CKM, a marker of differentiated myotubes, and PPARGC1A, a marker of oxidative metabolism, increased from days 1 to 3 with high expression maintained from days 4–7 (Fig. 3a, b). Gene expression of CD36, another marker of oxidative metabolism, increased over the time course with highest expression at day 7 (Fig. 3b). Gene expression of structural components of both skeletal muscle slow fibres, e.g. MYH7 and fast fibres, e.g. TNNI2 increased during the time course with highest expression of MYH7 and TNNI2 at day 6 (Fig. 3b). Gene expression of skeletal muscle catabolic markers FBX032 and TRIM63 increased during myogenesis with the highest expression after 3 and 7 days, respectively (see Online Resource file 1).
Fig. 3.

Time course of gene expression during myogenesis 0–7 days after eliciting differentiation. Panel a: MEF2A (purple triangles), MYOD1 (blue circles), MYF5 (red diamonds), CKM (green squares). Panel b: CD36 (light blue diamonds), PPARGC1A (pink circles), MYH7 (orange triangles) and TNNI2 (brown squares). Data values are RQ(% max) for average expression changes with cells from donors 2, 3 and 4 (Table 1). SEM values are omitted for clarity and are shown in Online Resource 1. Gene expression changes for all 41 genes are shown in Online Resource 1
Effect of activin receptor ligands and TNFα on myogenesis
To characterise the myogenesis assay further, we quantified the effects of myostatin, growth and differentiation factor-11 (GDF-11), activin A and TNFα on myotube formation. All ligands inhibited myotube formation in a concentration-dependent manner during 4 days of treatment (Fig. 4b). TNFα was the most potent inhibitor of myogenesis. Average pEC50 values ± SEM from experiments with cells derived from donors 1, 2 and 3 (Table 1) were 11.1 ± 0.2 (EC50 = 7.9 pM) for TNFα, 9.9 ± 0.2 (EC50 = 125.9 pM) for GDF-11, 9.8 ± 0.3 (EC50 = 158.5 pM) for activin A and 9.1 ± 0.1 (EC50 = 794.3 pM) for myostatin. Total cell nuclei count per well were similar across all samples, suggesting no marked change in cell number or viability (Fig. 4c).
Fig. 4.

Representative images illustrating the effect of myostatin, GDF-11, activin A and TNFα on myotube formation 4 days after treatment (a). The vehicle control for myostatin and GDF-11 was ddH2O containing 0.1 % BSA and 4 mM HCl (vehicle control 1); PBS containing 0.1 % BSA was the vehicle control for activin A and TNFα (vehicle control 2). Concentration–effect curves showing the inhibitory effects of myostatin, GDF-11, activin A and TNFα on myotube formation (b) and no marked change in total cell nuclei (c). Concentration–effect curves show data that are the average ± SEM from experiments with cells from donors 1, 2 and 3 (Table 1)
Effect of myostatin and TNFα on gene expression changes during myogenesis
The gene expression changes elicited by myostatin (10 nM) and TNFα (1 nM) during the inhibition of myogenesis were studied over a 4-day time course. These data are comprehensively tabulated in Online Resource 2. All data presented are the average percent change in gene expression in cells isolated from donors 1, 8, 9 and 10 (Table 1). Myostatin and TNFα inhibited the expression of myogenic transcription factors MEF2A, MYOD1 and MYOG (Fig. 5a, b and Online Resource 2). TNFα but not myostatin partially restored the expression of MYF5 (Fig. 5c). Myostatin and TNFα inhibited the expression of CKM and CD36 (Fig. 5d, e); however, myostatin but not TNFα inhibited the expression of PPARGC1A (Fig. 5f). Myostatin and TNFα also inhibited the expression of markers of both skeletal muscle slow fibres MYH7, TNNI1 (Fig. 5g and Online Resource 2) and fast fibres TNNI2, MYH1, MYH2 (Fig. 5h and Online Resource 2). TNFα but not myostatin increased gene expression of inflammatory markers including IL-6, IL-15 and NFKB1, but neither myostatin nor TNFα substantially changed the expression of catabolic or atrophy markers including TRIM63 and FBX032 (see Online Resource 2).
Fig. 5.

Effects of 10 nM myostatin (dark blue diamonds), myostatin vehicle control (light blue triangles), 1 nM TNFα (dark green squares) and TNFα vehicle control (light green circles) on MEF2A (a), MYOD1 (b), MYF5 (c), CKM (d), CD36 (e), PPARGC1A (f), MYH7 (g) and TNNI2 (h) gene expression during myogenesis 0–4 days after treatment. Data values are average RQ(% max) ± SEM for expression changes in cells from donors 1, 8, 9 and 10 (Table 1). Gene expression changes for all 41 genes analysed are shown in Online Resource 2
Discussion
There is a clear unmet medical need for efficacious pharmacological agents to treat sarcopenia and the skeletal muscle dysfunction associated with a range of diseases. One potential therapeutic approach to this end is to identify drugs that promote new myofibre generation either by directly stimulating myogenesis or by blocking the effects of endogenous inhibitors of myogenesis. Such compounds may also help realise the potential therapeutic value of skeletal muscle satellite cells. The identification of such modulators of myogenesis requires the provision of robust and suitably high-throughput assays that can deliver quantitative data. The aim of the present study was therefore to develop methods to isolate large numbers of adult human satellite cells that could subsequently be used in pharmacological studies.
A number of methodologies have been described for isolation of satellite cells from human muscle tissue. These include explant outgrowth [10, 13] and enzymatic digestion [7–9, 14] and have mainly employed small biopsies of fresh tissue (typically 50–100 mg). Stewart and colleagues [11] have previously shown that cells derived from larger samples (approximately 4 g) of post-mortem tissue can also be successfully differentiated into myotubes. Here, we have extended these studies by developing a method for cell isolation from post-mortem muscle tissue that allows the use of much larger samples (50–100 g). Use of large post-mortem tissue samples has obvious advantages in terms of cell yield. However, as tissue processing occurred several hours after death, this raises potential concerns over the utility of such material as the basis for cellular assays. A comparison between the myogenic potential of satellite cells isolated from fresh tissue and post-mortem tissue may be one way to address this concern, but we are unaware of any studies where this has been investigated. This may be due to the difficulty of securing appropriate tissue samples. Even if such samples could be obtained, the different isolation procedures and cell propagation times needed for biopsy versus post-mortem tissue and the inability to compare results within donors makes such a study difficult to control. Encouragingly however, although our tissue samples were processed up to 97 h after death, we were able to successfully isolate viable cells and use these for functional and transcriptional analyses. Initially, we tried the digestion methods employed by other investigators on small-tissue biopsies but were unable to isolate satellite cells. This failure was most likely a consequence of the larger tissue mass relative to the concentration of digestive enzymes used. This assertion is supported by the fact that the method we ultimately used, although based on that of Dellavalle and colleagues [9], employed higher concentrations of collagenase and trypsin and an extended time of digestion. Adaptation of the method allowed for fewer cell manipulations and provided a good cell yield. The cells obtained from this isolation were a mixed population with the main contaminants (as assessed morphologically) being endothelial cells and fibroblasts (Fig. 1a–c). Following the initial preparation, cells were further purified using CD56+ selection, a marker that has been used previously to isolate cells with myogenic potential [9, 15]. This procedure yielded very-high-purity cell samples (Table 1). We also confirmed the observation of Stadler and colleagues [15] that CD56- cells do not form myotubes and will overgrow the CD56+ cells in a mixed culture. In summary, our data suggested that this method can be used to isolate large numbers of cells from post-mortem tissue with robust myogenic potential.
Having isolated CD56+ cell preparations with good myogenic potential, we further developed our assay to allow the investigation of the effects of pharmacological modulators of myogenesis. During this process, we found that cell density was critical and that seeding cells at approximately 90 % confluence and eliciting differentiation within 24 h yielded a robust and reproducible myogenic differentiation in all donor cells (Fig. 2). The extent of myogenic differentiation in cultures was also dependent on the lot of horse serum used, and batch testing of serum was routinely performed. Traditionally, methods to measure myogenesis have involved manual counting of the number of nuclei per tube, to obtain the fusion index of multinucleated myotubes. More recently, automated methods employing immuno- or histological staining [16–18] have been used to measure myogenesis. The multi-parametric imaging algorithms we employed allowed myogenesis (percentage myotube area per field of view) and cell viability/proliferation (total cell nuclei) to be measured simultaneously. These algorithms also have the potential to quantify more sophisticated morphological endpoints such as tube branching or diameter. Measurement of the latter parameter offers the exciting prospect of further developing this system to enable assessment of the atrophying effects of agents on pre-formed myotubes.
In this study, we have also established a robust methodology to study gene expression changes during primary human myogenesis in a high-throughput format. Our gene expression methodology has proven useful as assay sensitivity restricted our development of biochemical assays for skeletal muscle markers in a high-throughput format (unpublished observations). Although TLDA can only analyse 10s–100s of genes, compared with 1,000s by global gene microarrays, they have a particularly high sensitivity and dynamic range [19]. This methodology might ultimately find utility in the diagnosis of skeletal muscle disorders and the evaluation of drug efficacy and/or side effects.
We catalogued quantitative changes in expression of selected genes encoding markers of myogenic differentiation, satellite cells, muscle atrophy, catabolism, inflammation, oxidative metabolism and structural components (Table 2). Consistent with their role as master myogenic transcription factors, MYF5 and MYOD1 were expressed at highest levels in satellite cells and differentiating cells, respectively, before myotube formation [20]. In contrast, expression of MEF2A, another transcription factor controlling muscle-specific gene expression, peaked during myotube formation [21]. Expression of CKM followed the time course of myotube formation consistent with CKM being a marker of differentiated myotubes with an essential role in energy homeostasis [22]. Myotubes expressed structural components of both fast and slow muscle fibres, including MYH7 and TNNI2, respectively, with expression increasing after the peak of myotube formation. In agreement with gene expression data, myotubes immunostained for myosin slow and fast chains individually (unpublished observations) consistent with a previous study [10]. PPARGC1A and CD36, markers of oxidative metabolism, also increased expression after myotube formation plateaued [23, 24]. This suggests that metabolic and structural maturation or remodelling of myotubes continues after their initial formation. Gene expression results for MYOD1, MEF2A, MYOG and MYH are consistent with the expression of their associated proteins during myogenesis [9]. FBX032 and TRIM63 that encode E3 ligases involved in skeletal muscle atrophy increased in expression during myogenesis and extend previous observations [25, 26].
Having established robust myogenesis and gene expression assays, we further characterised their utility by studying the effects of myostatin, the related activin receptor ligands GDF-11 and activin A, and TNFα on myogenesis. These ligands are negative regulators of muscle function that reduce the anabolic activities and increase catabolic activities of muscle cells [27–32]. Consistent with previous findings, we found myostatin, GDF-11, activin A and TNFα inhibited human myogenesis and demonstrated TNFα more potently inhibits myogenesis compared with activin receptor ligands [12, 26, 33]. It is worth noting that inhibition of myogenesis by TNFα might involve upregulation of activin levels [12]. We used our gene expression assay to compare the molecular events regulated by TNFα and myostatin during myogenesis. Consistent with previous studies, both TNFα and myostatin inhibited the expression of myogenic transcription factors including MYOD1, MEF2A and MYOG [26, 34, 35]. Myostatin and TNFα also inhibited expression of structural and functional components of skeletal muscle including slow and fast fibres, e.g. MYH1, 2 and 7, TNNI1 and TNNI2 and CKM, in agreement with previous work [26, 33, 35, 36]. Myostatin inhibited the expression of PPARGC1A, a marker of oxidative metabolism associated with improved endurance performance [37, 38]. This finding is in agreement with a study in mice where inhibition of myostatin signalling increased PPARGC1A expression and exercise performance [39]. TNFα did not inhibit the expression of PPARGC1A contrasting previous studies in mice that showed TNFα could suppress PPARGC1A levels and contribute to impaired muscle performance [40, 41]. TNFα but not myostatin substantially increased the expression of inflammatory markers NFKB1, IL-15 and IL-6. This supports previous reports suggesting TNFα can signal via the NFкB pathway to induce inflammation in muscle cells whereas myostatin acts through an NFкB-independent and non-inflammatory mechanism [30, 34, 36]. Neither TNFα nor myostatin regulated the expression of the atrophy markers TRIM63 and FBX032 [25]. This contrasts other studies that showed myostatin reduced TRIM63 and FBX032 levels during human myogenesis but increased their expression during mouse myogenesis [26, 34]. TNFα increased TRIM63 and FBX032 expression in rat L6 myotubes and TRIM63 was shown to be required for TNFα induced loss of muscle function in mice [42, 43]. In summary, TNFα and myostatin inhibit human myogenesis and regulate an overlapping but distinct set of genes involved in muscle cell differentiation, structural and metabolic functions.
In conclusion, we have developed a robust methodology for isolating human skeletal muscle satellite cells from large samples of post-mortem tissue. The cell yield was sufficient to allow the development of relatively high-throughput and highly quantitative assays for the measurement of myogenesis and the associated changes in gene expression. Such assays should enhance our understanding of myogenesis and could be employed as part of a drug-screening cascade aimed at identifying new therapeutic agents for treating muscle disorders.
Electronic supplementary material
(DOC 80 kb)
(DOC 165 kb)
Acknowledgements
For the supply of tissue samples, we gratefully acknowledge the support of Professor David Walsh (Consultant Rheumatologist and Professor of Rheumatology), Deborah Wilson (Specialist Nurse) and Roger Hill (Technician) at Sherwood Forest Hospitals NHS Foundation Trust, Mansfield Road, Sutton-in-Ashfield, Nottinghamshire, UK. All the authors of this manuscript certify that they comply with the guidelines of ethical authorship and publishing in the Journal of Cachexia, Sarcopenia and Muscle 2010;1:7–8 (von Haehling S, Morley JE, Coats AJ and Anker SD).
Conflict of interest
Ian Scott is an employee of MedImmune, AstraZeneca, Cambridge, UK. Andrew Walding and Beverley Isherwood are employees of AstraZeneca, Alderley Park, UK; Iain Dougall and Wendy Tomlinson are former employees of AstraZeneca, UK.
Abbreviations
- AIDS
Acquired immune deficiency syndrome
- BSA
Bovine serum albumin
- COPD
Chronic obstructive pulmonary disease
- ddH2O
Double-distilled water
- DMEM
Dulbecco’s modified Eagles medium
- FC buffer
Flow cytometry buffer
- IL-6
Interleukin-6
- NCAM
Neural cell adhesion molecule
- PBS
Phosphate buffered saline
- SEM
Standard error of the mean
- TNFα
Tumour necrosis factor alpha
Contributor Information
Ian C. Scott, Phone: +44-1223-898609, FAX: +44-1223-4714727, Email: Scottia@medimmune.com
Wendy Tomlinson, Email: Wendy.Tomlinson@effem.com.
Andrew Walding, Email: Andrew.Walding@astrazeneca.com.
Beverley Isherwood, Email: Beverley.Isherwood@astrazeneca.com.
Iain G. Dougall, Email: igdconsultancy@btinternet.com
References
- 1.Doherty TJ. Invited review: aging and sarcopenia. J Appl Physiol. 2003;95:1717–1727. doi: 10.1152/japplphysiol.00347.2003. [DOI] [PubMed] [Google Scholar]
- 2.Lynch GS, Schertzer JD, Ryall JG. Therapeutic approaches for muscle wasting disorders. Pharmacol Ther. 2007;113:461–487. doi: 10.1016/j.pharmthera.2006.11.004. [DOI] [PubMed] [Google Scholar]
- 3.Scharner J, Zammit PS. The muscle satellite cell at 50: the formative years. Skeletal Muscle. 2011;1:28. doi: 10.1186/2044-5040-1-28. [DOI] [PMC free article] [PubMed] [Google Scholar]
- 4.Renault V, Thorne L-E, Eriksson P-O, Butler-Browne G, Mouly V. Regenerative potential of human skeletal muscle during aging. Aging Cell. 2002;1:132–139. doi: 10.1046/j.1474-9728.2002.00017.x. [DOI] [PubMed] [Google Scholar]
- 5.Verdijk LB, Koopman R, Schaart G, Meijer K, Savelberg HH, van Loon LJ. Satellite cell content is specifically reduced in type II skeletal muscle fibres in the elderly. Am J Physiol Endocrinol Metab. 2007;292:E151–E157. doi: 10.1152/ajpendo.00278.2006. [DOI] [PubMed] [Google Scholar]
- 6.Thornell L-E, Lindstom M, Renault V, Klein A, Mouly V, Ansved T, Butler-Browne G, Furling D. Satellite cell dysfunction contributes to the progressive muscle atrophy in myotonic dystrophy type 1. Neuropath Appl Neurobiol. 2009;35:603–613. doi: 10.1111/j.1365-2990.2009.01014.x. [DOI] [PubMed] [Google Scholar]
- 7.Baj A, Bettaccini AA, Casalone R, Sala A, Cherubino P, Toniolo AQ. Culture of skeletal myoblasts from human donors aged over 40 years. dynamics of cell growth and expression of differentiation markers. J Translational Med. 2005;3:21. doi: 10.1186/1479-5876-3-21. [DOI] [PMC free article] [PubMed] [Google Scholar]
- 8.Blau HM, Webster C. Isolation and characterisation of human muscle cells. Proc Natl Acad Sci USA. 1981;78:5623–5627. doi: 10.1073/pnas.78.9.5623. [DOI] [PMC free article] [PubMed] [Google Scholar]
- 9.Dellavalle A, Sampaolesi M, Tonlorenzi R, Tagliafico E, Sacchetti B, Perani L, Innocenzi A, Galvez BG, Messina G, Morosetti R, Li S, Belicchi M, Peretti G, Chamberlain JS, Wright WE, Torrente Y, Ferrari S, Bianco P, Cossu G. Pericytes of human skeletal muscle are myogenic precursors distinct from satellite cells. Nat Cell Biol. 2007;9:255–267. doi: 10.1038/ncb1542. [DOI] [PubMed] [Google Scholar]
- 10.Edom F, Mouly V, Barbet JP, Fiszman MY, Butler-Browne GS. Clones of human satellite cells can express in vitro both fast and slow myosin heavy chains. Dev Biol. 1994;164:219–229. doi: 10.1006/dbio.1994.1193. [DOI] [PubMed] [Google Scholar]
- 11.Stewart JD, Masi TL, Cumming AE, Molnar GM, Wentworth BM, Sampath K, McPherson JM, Yaeger PC. Characterisation of proliferating human skeletal muscle-derived cells in vitro: differential modulation of myoblast markers by tgf-2. J Cell Physiol. 2003;196:70–78. doi: 10.1002/jcp.10322. [DOI] [PubMed] [Google Scholar]
- 12.Trendelenburg AU, Meyer A, Jacobi C, Feige JN, Glass DJ. TAK-1/p38/nNF B signalling inhibit myoblast differentiation by increasing levels of activin A. Skeletal Muscle. 2012;2:3–14. doi: 10.1186/2044-5040-2-3. [DOI] [PMC free article] [PubMed] [Google Scholar]
- 13.Smith J, Merrick D. Embryonic skeletal muscle microexplant culture and isolation of skeletal muscle stem cells. Methods Mol Biol. 2010;633:29–56. doi: 10.1007/978-1-59745-019-5_3. [DOI] [PubMed] [Google Scholar]
- 14.Cossu G, Zani B, Coletta M, Bouche M, Pacifici M, Molinaro M. In vitro differentiation of satellite cells isolated from normal and dystrophic mammalian muscle. A comparison with embryonic myogenic cells. Cell Differ. 1980;9:357–368. doi: 10.1016/0045-6039(80)90035-4. [DOI] [PubMed] [Google Scholar]
- 15.Stadler G, Chen JC, Wagner K, Robin JD, Shay JW, Emerson CP, Wright WE. Establishment of clonal myogenic cell lines from severely affected dystrophic muscles—CDK4 maintains the myogenic population. Skeletal Muscle. 2011;1:12. doi: 10.1186/2044-5040-1-12. [DOI] [PMC free article] [PubMed] [Google Scholar]
- 16.Krueger F, Hoffmann FM. Identification of retinoic acid in a high content screen for agents that overcome the anti-myogenic effects of TGF-beta-1. PLoS One. 2010;5:e15511. doi: 10.1371/journal.pone.0015511. [DOI] [PMC free article] [PubMed] [Google Scholar]
- 17.Sultan KR, Henkel B, Terlou M, Haagsman HP. Quantification of hormone-induced atrophy of large myotubes from C2C12 and L6 cells: atrophy-indubile and atrophy-resistant C2C12 myotubes. Am J Physiol Cell Physiol. 2006;290:C650–C659. doi: 10.1152/ajpcell.00163.2005. [DOI] [PubMed] [Google Scholar]
- 18.Velica P, Bunce CM. A quick, simple and unbiased method to quantify C2C12 myogenic differentiation. Muscle Nerve. 2011;44:365–377. doi: 10.1002/mus.22056. [DOI] [PubMed] [Google Scholar]
- 19.Sauer S, Lange BM, Gobom J, Nyarsik L, Seitz H. Miniaturisation in functional genomics and proteomics. Nat Rev Genet. 2005;6:465–476. doi: 10.1038/nrg1618. [DOI] [PubMed] [Google Scholar]
- 20.Sabourin LA, Rudnicki MA. The molecular regulation of myogenesis. Clin Genet. 2000;57:16–25. doi: 10.1034/j.1399-0004.2000.570103.x. [DOI] [PubMed] [Google Scholar]
- 21.Yu YT, Breitbart RE, Smoot LB, Lee Y, Mahdavi V, Nadal-Ginard B. Human myocyte-specific enhancer factor 2 comprises a group of tissue-restricted MADS box transcription factors. Genes Dev. 1992;6:1783–1798. doi: 10.1101/gad.6.9.1783. [DOI] [PubMed] [Google Scholar]
- 22.Trask RV, Strauss AW, Billadello JJ. Developmental regulation and tissue-specific expression of the human muscle creatine kinase gene. J Biol Chem. 1988;263:17142–17149. [PubMed] [Google Scholar]
- 23.Bonen A, Han XX, Habets DD, Febbraio M, Glatz JF, Luiken JJ. A null mutation in skeletal muscle FAT/CD36 reveals its essential role in insulin- and AICAR-stimulated fatty acid metabolism. Am J Physiol Endocrinol Metab. 2007;292:1740–1749. doi: 10.1152/ajpendo.00579.2006. [DOI] [PubMed] [Google Scholar]
- 24.Handschin C, Chin S, Li P, Liu F, Maratos-Flier E, LeBrasseur NK, Yan Z, Spiegelman BM. Skeletal muscle fiber-type switching, exercise intolerance, and myopathy in PGC-1alpha muscle-specific knock-out animals. J Biol Chem. 2007;282:30014–30021. doi: 10.1074/jbc.M704817200. [DOI] [PubMed] [Google Scholar]
- 25.Bodine SC, Latres E, Baumhueter S, Lai VK, Nunez L, Clarke BA, Poueymirou WT, Panaro FJ, Na E, Dharmarajan K, Pan ZQ, Valenzuela DM, DeChiara TM, Stitt TN, Yancopoulos GD, Glass DJ. Identification of ubiquitin ligases required for skeletal muscle atrophy. Science. 2001;294:1704–1708. doi: 10.1126/science.1065874. [DOI] [PubMed] [Google Scholar]
- 26.Trendelenburg AE, Meyer A, Rohner D, Boyle J, Hatakeyama S, Glass DJ. Myostatin reduces Akt/TORC1/p70S6K signaling, inhibiting myoblast differentiation and myotube size. Am J Physiol Cell Physiol. 2009;296:C1258–C1270. doi: 10.1152/ajpcell.00105.2009. [DOI] [PubMed] [Google Scholar]
- 27.Garcia-Martinez C, Lopez-Soriano FJ, Argiles JM. Acute treatment with tumour necrosis factor-alpha induces changes in protein metabolism in rat skeletal muscle. Mol Cell Biochem. 1993;125:11–18. doi: 10.1007/BF00926829. [DOI] [PubMed] [Google Scholar]
- 28.Lee SJ, Reed LA, Davies MV, Girgenrath S, Goad ME, Tomkinson KN, Wright JF, Barker C, Ehrmantraut G, Holmstrom J, Trowell B, Gertz B, Jiang MS, Sebald SM, Matzuk M, Li E, Liang LF, Quattlebaum E, Stotish RL, Wolfman NM. Regulation of muscle growth by multiple ligands signalling through activin II receptors. Proc Natl Acad Sci USA. 2005;102:18117–18122. doi: 10.1073/pnas.0505996102. [DOI] [PMC free article] [PubMed] [Google Scholar]
- 29.McPherron AC, Lawler AM, Lee S-J. Regulation of skeletal muscle mass in mice by a new TGF- superfamily member. Nature. 1997;387:83–90. doi: 10.1038/387083a0. [DOI] [PubMed] [Google Scholar]
- 30.Reid MB, Li YP. Tumour necrosis factor- and muscle wasting: a cellular perspective. Respir Res. 2001;2:269–272. doi: 10.1186/rr67. [DOI] [PMC free article] [PubMed] [Google Scholar]
- 31.Souza TA, Chen X, Guo Y, Sava P, Zhang J, Hill JJ, Yaworsky PJ, Qiu Y. Proteomic identification and functional validation of activins and bone morphogenetic protein 11 as candidate novel muscle mass regulators. Mol Endocrinol. 2008;22:2689–2702. doi: 10.1210/me.2008-0290. [DOI] [PMC free article] [PubMed] [Google Scholar]
- 32.Zimmers TA, Davies MV, Koniaris LG, Haynes P, Esquela AF, Tomkinson KN, McPherron AC, Wolfman NM, Lee S-J. Induction of cachexia in mice by systemically administered myostatin. Science. 2002;296:1486–1488. doi: 10.1126/science.1069525. [DOI] [PubMed] [Google Scholar]
- 33.Miller SC, Ito H, Blau HM, Torti FM. Tumour necrosis factor inhibits human myogenesis in vitro. Mol Cell Biol. 1988;8:2295–2301. doi: 10.1128/mcb.8.6.2295. [DOI] [PMC free article] [PubMed] [Google Scholar]
- 34.McFarlane C, Plummer E, Thomas M, Hennebry A, Ashby M, Ling N, Smith H, Sharma M, Kambadur R. Myostatin induces cachexia by activating the ubiquitin proteolytic system through an NF B-independent, FoxO1-dependent mechanism. J Cell Phys. 2006;209:501–514. doi: 10.1002/jcp.20757. [DOI] [PubMed] [Google Scholar]
- 35.Szalay K, Razga Z, Duda E. TNF inhibits myogenesis and down regulates the expression of myogenic regulatory factors myoD and myogenin. Eur J Cell Biol. 1997;74:391–398. [PubMed] [Google Scholar]
- 36.Langen RC, Schols AMW, Kelders MCJM, Wouters EFM, Janssen-Heininger YMW. Inflammatory cytokines inhibit myogenic differentiation through activation of nuclear factor-B. FASEB J. 2001;15:1169–1180. doi: 10.1096/fj.00-0463. [DOI] [PubMed] [Google Scholar]
- 37.Wu Z, Puigserver P, Andersson U, Zhang C, Adelmant G, Mootha V, Troy A, Cinti S, Lowell B, Scarpulla RC, Spiegelman BM. Mechanisms controlling mitochondrial biogenesis and respiration through the thermogenic co-activator PGC-1. Cell. 1999;98:115–124. doi: 10.1016/S0092-8674(00)80611-X. [DOI] [PubMed] [Google Scholar]
- 38.Narkar VA, Downes M, Yu RT, Embler E, Wang YX, Banayo E, Mihaylova MM, Nelson MC, Zou Y, Juguilon H, Kang H, Shaw RJ, Evans RM. AMPK and PPARdelta agonists are exercise mimetics. Cell. 2008;134:405–415. doi: 10.1016/j.cell.2008.06.051. [DOI] [PMC free article] [PubMed] [Google Scholar]
- 39.LeBrasseur NK, Schelhorn TM, Bernardo BL, Cosgrove PG, Loria PM, Brown TA. Myostatin inhibition enhances the effects of exercise on performance and metabolic outcomes in aged mice. J Gerontol A Biol Sci Med Sci. 2009;64:940–948. doi: 10.1093/gerona/glp068. [DOI] [PubMed] [Google Scholar]
- 40.Remels AHV, Gosker HR, Schrauwen P, Hommelberg PPH, Sliwinski P, Polkey M, Galdiz J, Wouters EFM, Langen RCJ, Schols AMWJ. TNF- impairs regulation of muscle oxidative phenotype: implications for cachexia. FASEB J. 2010;24:5052–5062. doi: 10.1096/fj.09-150714. [DOI] [PubMed] [Google Scholar]
- 41.Tang K, Wagner PD, Breen EC. TNF-alpha-mediated reduction in PGC-1-alpha may impair skeletal muscle function after cigarette smoke exposure. J Cell Physiol. 2010;222:320–327. doi: 10.1002/jcp.21955. [DOI] [PMC free article] [PubMed] [Google Scholar]
- 42.Adams V, Mangner N, Gasch A, Krohne C, Gielen S, Hirner S, Thierse HJ, Witt CC, Linke A, Schuler G, Labeit S. Induction of MuRF1 is essential for TNF-alpha-induced loss of muscle function in mice. J Mol Biol. 2008;384:48–59. doi: 10.1016/j.jmb.2008.08.087. [DOI] [PubMed] [Google Scholar]
- 43.Sishi BJ, Engelbrecht AM. Tumour necrosis factor alpha (TNF-) inactivates the PI3-kinase/PKB pathway and induces atrophy and apoptosis in L6 myotubes. Cytokine. 2011;54:173–184. doi: 10.1016/j.cyto.2011.01.009. [DOI] [PubMed] [Google Scholar]
- 44.Bustin SA, Benes V, Garson JA, Hellemans J, Huggett J, Kubista M, Mueller R, Nolan T, Pfaffl MW, Shipley GL, Vandesompele J, Wittwer CT. The MIQE guidelines: minimum information for publication of quantitative real-time PCR experiments. Clin Chem. 2009;55:611–622. doi: 10.1373/clinchem.2008.112797. [DOI] [PubMed] [Google Scholar]
Associated Data
This section collects any data citations, data availability statements, or supplementary materials included in this article.
Supplementary Materials
(DOC 80 kb)
(DOC 165 kb)