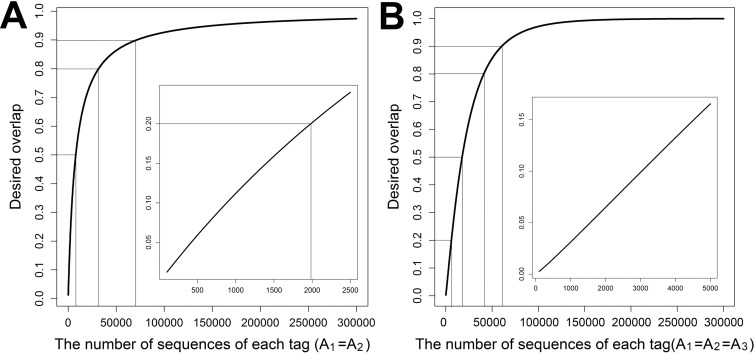
FIG 3 .
Prediction of sampling efforts for desired OTU overlap. (A) Desired overlap between two tags based on the combined sequences from sample 2UC. The sampling efforts were calculated based on equation 15. The parameters for species abundance distribution were from Table S3A in the supplemental material. (B) Desired overlap among three tags based on the combined sequences from sample 1UC. The sampling efforts were calculated based on equation 16. The parameters for species abundance distribution were from Table S3B.

