Abstract
Positive selection is widely estimated from protein coding sequence alignments by the nonsynonymous-to-synonymous ratio ω. Increasingly elaborate codon models are used in a likelihood framework for this estimation. Although there is widespread concern about the robustness of the estimation of the ω ratio, more efforts are needed to estimate this robustness, especially in the context of complex models. Here, we focused on the branch-site codon model. We investigated its robustness on a large set of simulated data. First, we investigated the impact of sequence divergence. We found evidence of underestimation of the synonymous substitution rate for values as small as 0.5, with a slight increase in false positives for the branch-site test. When dS increases further, underestimation of dS is worse, but false positives decrease. Interestingly, the detection of true positives follows a similar distribution, with a maximum for intermediary values of dS. Thus, high dS is more of a concern for a loss of power (false negatives) than for false positives of the test. Second, we investigated the impact of GC content. We showed that there is no significant difference of false positives between high GC (up to ∼80%) and low GC (∼30%) genes. Moreover, neither shifts of GC content on a specific branch nor major shifts in GC along the gene sequence generate many false positives. Our results confirm that the branch-site is a very conservative test.
Keywords: adaptive evolution, codon model, base composition
Introduction
The identification of episodic positive selection is an important challenge in molecular evolution. The branch-site model as proposed by Zhang et al. (2005) has been widely used for this purpose. It shares a common basis with other codon-based models: The dN (nonsynonymous substitutions) to dS (synonymous substitutions) ratio is used to calculate the selective pressure ω. dN < dS, that is, ω < 1, indicates that purifying selection is acting to reduce the fixation of deleterious mutations. dN = dS, that is, ω = 1, indicates that nonsynonymous mutations are neutral. Positive selection is detected when dN > dS, that is, ω > 1, indicating the fixation of advantageous mutations. Two hypotheses are contrasted in the branch-site test. The difference between the two affects only a predefined “foreground branch,” on which positive selection is allowed (ω2 ≥ 1) for the alternative hypothesis (table 1).
Table 1.
Parameters in the Branch-Site Model A (Zhang et al. 2005).
| Site Class | Proportion of Sites | Background ω | Foreground ω |
|---|---|---|---|
| 0 | p0 | 0 < ω0 < 1 | 0 < ω0 < 1 |
| 1 | p1 | ω1 = 1 | ω1 = 1 |
| 2a | (1 − p0 − p1)p0/(p0 + p1) | 0 < ω0 < 1 | ω2 ≥ 1 |
| 2b | (1 − p0 − p1)p1/(p0 + p1) | ω1 = 1 | ω2 ≥ 1 |
Although it has been long known that pairwise estimations of ω are biased by dS saturation under simple codon models (Cannarozzi and Schneider 2012, p. 16), there have been few studies testing specifically the robustness of the branch-site model. Yet, simulations have shown more robustness of this model than might have been expected (Zhang et al. 2005; Kosiol et al. 2007; Studer et al. 2008; Jordan and Goldman 2012; Zhai et al. 2012). Anisimova and Yang (2007) showed that high sequence divergence accompanied by serious model violations increases the rate of false positives, as very divergent sequences are difficult to align. However, no boundaries were given showing points of saturation, nor to what extent the branch-site test is affected.
Several studies have criticized codon-based tests for positive selection from a philosophical (Hughes 2007; Hughes and Friedman 2008) or a technical point of view (Friedman and Hughes 2007; Hughes 2007, 2012), using mostly the site model (but see Zhai et al. 2012). Fewer studies have criticized the branch-site model (Nozawa et al. 2009) and no studies were conducted to test the effect of GC content, GC shifts in a gene tree or GC heterogeneity within the multiple sequence alignments (MSAs).
Ratnakumar et al. (2010) have shown that gBGC (GC-biased gene conversion), leading to a bias in GC content and accelerated evolution, can be confounded with positive selection in high meiotic recombination regions in primate phylogeny. This confounding effect can affect more than 20% of the positively detected genes especially on short branches. Another aspect of GC codon bias in vertebrates is the presence of isochores in most warm-blooded vertebrates, characterized by islands of several hundreds of kilobases with low or high GC content. Genes of warm-blooded vertebrates are richer generally in GC content when compared with cold-blooded vertebrates (Eyre-Walker and Hurst 2001), for example, human protein-coding genes have an average of 47.05% GC versus 37.65% GC in zebrafish (Hubbard et al. 2002). Thus, when we compare homologous genes between cold- and warm-blooded vertebrates, there can be important differences in GC content; it is not known how this might bias the detection of positive selection.
In this study, we investigate the effect of saturation of substitutions on the branch-site model by simulating highly divergent sequences. We investigate the effect of GC bias on the branch-site model by simulating shifts of GC content on particular branches in the phylogeny; we also used the site model for reference. We use real data parameters and trees from 762 singleton gene families (Studer et al. 2008), to ensure that the simulations remain biologically realistic in the parameters, which we are not explicitly testing.
Results
Saturation
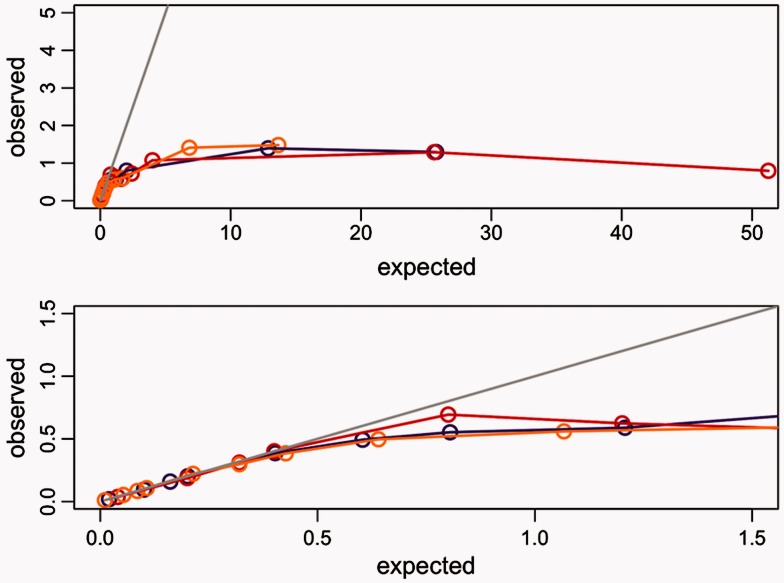
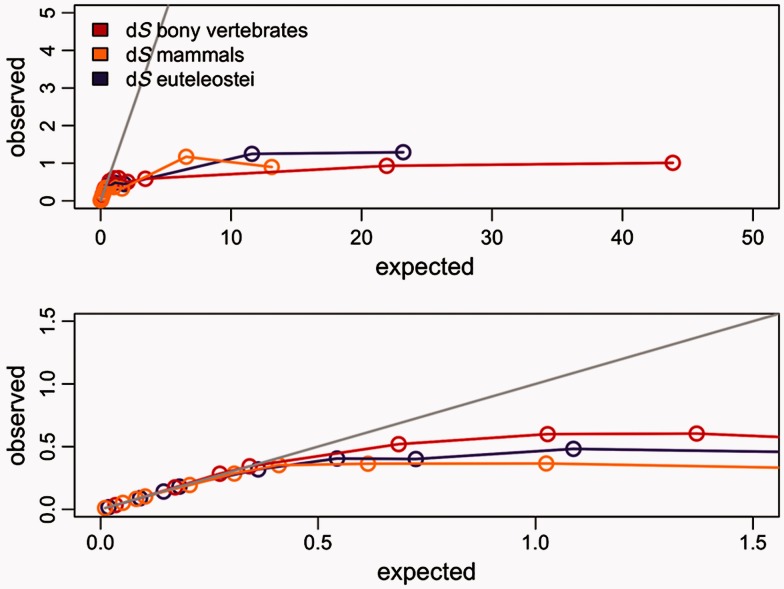
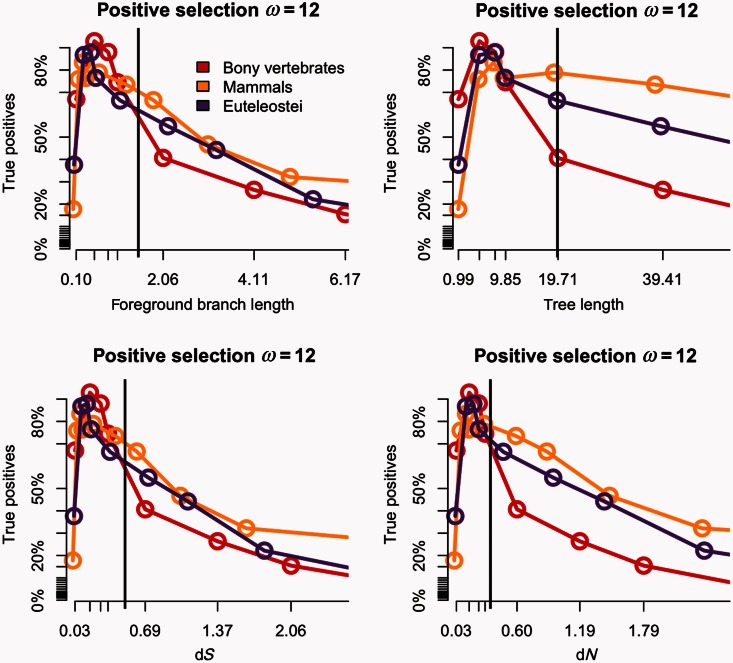
To study the impact of saturation of synonymous substitutions, we increased the length of the original trees up to 512-fold (i.e., 512 times the estimated divergence between tetrapods and teleost fishes). Although this scale is unrealistic for most data sets that we know of, it allowed us to characterize the behavior of the branch-site test under extreme circumstances. We used the branch-site model both for the simulations and for the analysis of the 762 singleton genes (see Materials and Methods). We detected a saturation plateau both for dN and dS (figs. 1–3). Saturation of synonymous substitutions is clearly seen on each of the foreground branches α, β, and γ. We set the threshold of early saturation when the difference between expected and estimated dS is more than 10%, in other terms dS is defined as saturated when the dS estimated is less than 0.9 dS simulated. For true positives, while imposing ω = 12 and for a dS observed value of 0.5, we detect a saturation of more than 10% on the three branches tested, leading to a loss more than 50% of test power. There are slight differences between foreground branches (table 2). For example, the bony vertebrates branch α saturation starts at 2-fold divergence of the initial tree length with a median tree length of approximately 20, median foreground branch length of 1.55, median dS of 0.51, and a median dN of 0.37; for more recent branches saturation and loss of power are reached at the same level of substitution divergence (table 2 and fig. 2) but with 6-fold divergence of initial tree length showing that the power is associated with foreground branch length more than total tree length.
Fig. 1.
Saturation of the dS with purifying selection (ω = 0.1). The x axis shows the median dS values expected against y axis for the median dS values observed using the branch-site model. The bony vertebrates branch “α” is shown in red, the mammalian branch “β” in yellow, and the euteleostei branch “γ” in purple. Each dot corresponds to each divergence test conducted multiplying the initial tree length by 0.1 up to 512. The gray line shows the expected values. Both plots are same, whereas the lower figure is the zoomed version for more accuracy.
Fig. 2.
Saturation of the dS with positive selection (ω = 12). The x axis shows the median dS values expected against y axis for the median dS values observed using the branch-site model. The bony vertebrates branch “α” is shown in red, the mammalian branch “β” in yellow, and the euteleostei branch “γ” in purple. Each dot corresponds to each divergence test conducted multiplying the initial tree length by 0.1 up to 512. The gray line shows the expected values. Both plots are the same, whereas the lower figure is the zoomed version for more accuracy.
Fig. 3.
Power of the branch-site model against sequence divergence under positive selection ω = 12. Various expected parameters values against the power (percent of true positives). The bony vertebrates branch “α” is shown in red, the mammalian branch “β” in yellow, and the euteleostei branch “γ” in purple. Each dot corresponds to each divergence test conducted multiplying the initial tree length with 10% FDR correction. The vertical black lines correspond to the branches with dS of 0.5.
Table 2.
Branch-Site Model Power Against Sequence Divergence.
| ×TL | Observed Tree Length–Expected Tree Length | Observed Branch Length–Expected Branch Length (Foreground) | Observed dS–Expected dS (Foreground) | Observed dN–Expected dN (Foreground) | Branch-Site Power (%) (with FDR 10%) |
|---|---|---|---|---|---|
| α | |||||
| 0.1 | 0.91–0.97 | 0.1–0.1 | 0.03–0.03 | 0.03–0.03 | 66.97 |
| 0.5 | 4.71–4.88 | 0.52–0.5 | 0.17–0.17 | 0.17–0.15 | 92.89 |
| 0.8 | 7.69–7.8 | 0.85–0.81 | 0.28–0.27 | 0.28–0.24 | 88.02 |
| 1 | 9.85–9.76 | 1.02–1.01 | 0.34–0.34 | 0.29–0.29 | 74.54 |
| 2 | 19.6–19.5 | 1.55–2.02 | 0.51–0.68 | 0.35–0.58 | 40.68 |
| 4 | 35.9–39.4 | 1.81–4.04 | 0.6–1.36 | 0.43–1.16 | 26.37 |
| 6 | 49.95–58.5 | 1.51–6.06 | 0.5–2.04 | 0.42–1.74 | 15.48 |
| 10 | 74.75–97.6 | 1.75–10.1 | 0.58–3.4 | 0.65–2.9 | 4.46 |
| 16 | 102–156 | 2.34–16.2 | 0.78–5.44 | 0.93–4.64 | 7.74 |
| 64 | 159–624 | 2.79–64.6 | 0.93–21.7 | 1.01–18.5 | 7.21 |
| β | |||||
| 0.1 | 0.91–0.94 | 0.03–0.03 | 0.01–0.01 | 0.01–0.01 | 17.76 |
| 0.5 | 4.62–4.71 | 0.15–0.15 | 0.05–0.05 | 0.06–0.07 | 75.92 |
| 0.8 | 7.52–7.54 | 0.25–0.23 | 0.08–0.08 | 0.1–0.11 | 83.42 |
| 1 | 9.49–9.43 | 0.3–0.29 | 0.1–0.1 | 0.14–0.14 | 76.37 |
| 2 | 19.5–18.9 | 0.58–0.58 | 0.19–0.2 | 0.39–0.28 | 78.87 |
| 4 | 38.6–37.7 | 1.05–1.16 | 0.35–0.4 | 0.61–0.56 | 73.49 |
| 6 | 53.81–56.5 | 1.09–1.74 | 0.36–0.6 | 0.5–0.84 | 66.53 |
| 10 | 77.82–94.3 | 1.1–2.9 | 0.36–1 | 0.4–1.4 | 46.71 |
| 16 | 102–150 | 1–4.64 | 0.32–1.6 | 0.34–2.24 | 32.15 |
| 64 | 163–603 | 3.51–18.5 | 1.17–6.4 | 1.21–8.9 | 11.54 |
| γ | |||||
| 0.1 | 0.9–0.97 | 0.05–0.05 | 0.02–0.02 | 0.02–0.02 | 37.63 |
| 0.5 | 4.66–4.86 | 0.26–0.26 | 0.08–0.09 | 0.09–0.11 | 86.71 |
| 0.8 | 7.59–7.78 | 0.42–0.42 | 0.14–0.14 | 0.18–0.18 | 87.89 |
| 1 | 9.75–9.73 | 0.54–0.53 | 0.18–0.18 | 0.23–0.23 | 76.51 |
| 2 | 19.9–19.5 | 0.95–1.06 | 0.31–0.36 | 0.43–0.46 | 66.41 |
| 4 | 38.1–38.9 | 1.2–2.12 | 0.4–0.72 | 0.76–0.92 | 54.85 |
| 6 | 53.3–58.3 | 1.44–3.18 | 0.48–1.08 | 0.58–1.38 | 44.22 |
| 10 | 77.6–97.3 | 1.33–5.3 | 0.44–1.8 | 0.47–2.3 | 22.17 |
| 16 | 104–155 | 1.71–8.84 | 0.57–2.88 | 0.65–3.68 | 11.67 |
| 64 | 163–622 | 3.74–33.9 | 1.24–11.5 | 1.19–14.7 | 8.92 |
Note.—Observed to expected parameter values showing test power under strong positive selection ω = 12 on the foreground branches tested, the bony vertebrates branch “α,” the mammalian branch “β,” and euteleostei branch “γ.” “×TL” denotes tree length multiplication values. Underlined values are parameters with power more than 80%.
Effect of Saturation on the Power and the Accuracy of the Branch-Site Model
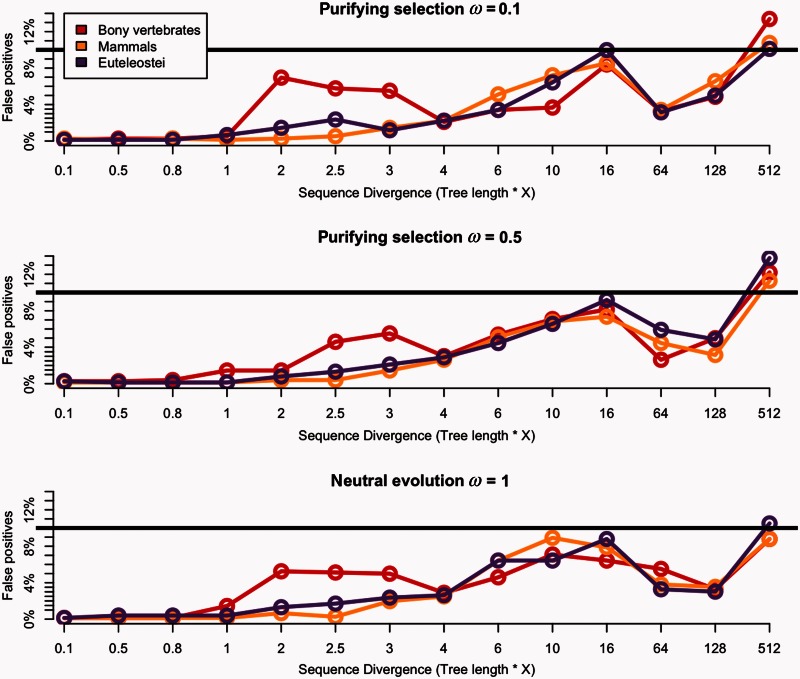
Under purifying selection and neutral evolution, the branch-site model is very robust against high divergence in almost all cases (fig. 4; supplementary fig. S1, Supplementary Material online); only the extreme unrealistic case (×512; simulated median dS = ∼52) gave a proportion of false positives slightly higher than the false discovery rate (FDR) threshold.
Fig. 4.
Power of the branch-site model against sequence divergence under purifying selection and neutral evolution. The x axis shows the ratio multiplication of the tree length, and the y axis shows percentage of false positives detection under ω = 0.1, ω = 0.5, and ω = 1, respectively, from upper to lower part of the figure. The bony vertebrates branch “α” is shown in red, the mammalian branch “β” in yellow, and the euteleostei branch “γ” in purple. Each dot corresponds to each divergence test conducted multiplying the initial tree length by 0.1 up to 512 shown on the x axis. The black line shows threshold of 10% FDR correction.
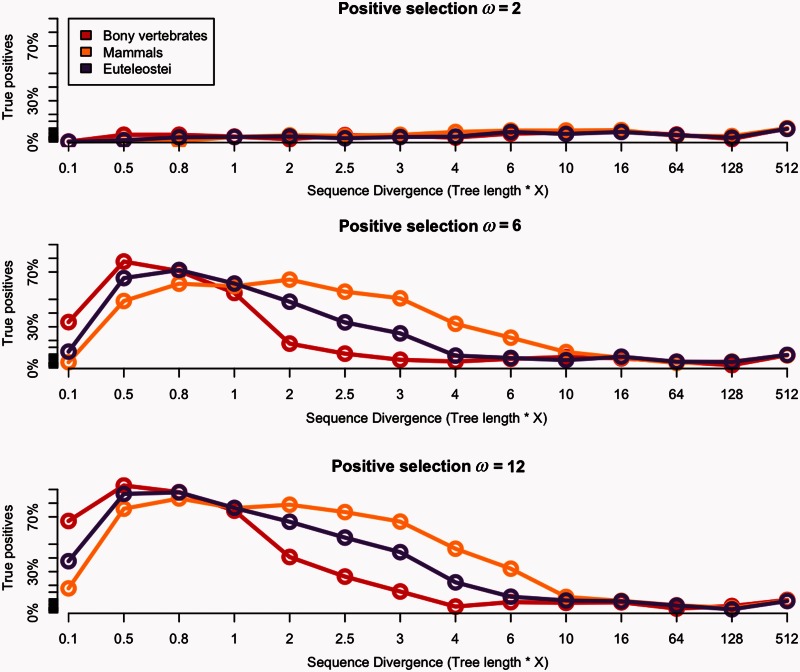
Under positive selection, in simulations with ω = 2 the test had very little power. This low power can be explained by the fact that the MSAs were simulated with only 1% of sites under positive selection (site classes K2a and K2b in table 1). When stronger selective pressure is imposed, ω = 6 or ω = 12, the rate of true positives increased up to 90% of detection of positively selected genes (supplementary table S1, Supplementary Material online; table 2 and fig. 5).
Fig. 5.
Power of the branch-site model against sequence divergence under positive selection. The x axis shows the ratio multiplication of the tree length, and the y axis shows percentage of true positives detection under ω = 2, ω = 6, and ω = 12, respectively, from upper to lower part of the figure. The bony vertebrates branch “α” is shown in red, the mammalian branch “β” in yellow, and the euteleostei branch “γ” in purple. Each dot corresponds to each divergence test conducted multiplying the initial tree length by 0.1 up to 512 shown on the x axis. The black line shows threshold of 10% FDR correction.
Depending on the foreground branch tested, the test has maximum power (considering the tests having >60% of true positives) with intervals of median dS of [0.03–0.34], [0.05–0.36], and [0.08–0.31] (synonymous substitutions per site) for α, β, and γ, respectively.
Although increasing the tree length beyond this, we found that the power of the test decreases for all branches; this was concomitant with saturation. Supplementary table S1, Supplementary Material online, defines boundaries of the branch-site model loss of power according to parameters dN, dS, foreground branch length, and tree length, when imposing an ω = 12 on 1% of codons.
GC Content Impact on the Branch-Site Model
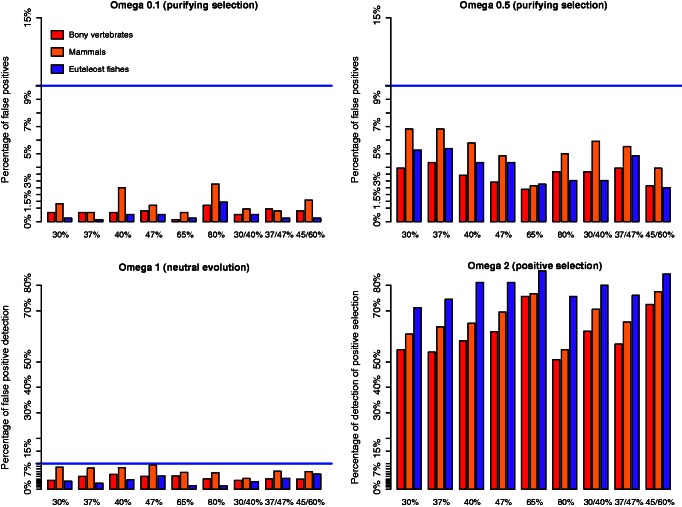
Under purifying selection, ω = 0.1, no false positives were detected for any GC content, whereas a few false positives were detected with ω = 0.5, reaching a maximum of 6%, which remains less than the threshold of 10% of the FDR correction (fig. 6).
Fig. 6.
Power of the branch-site model under different GC content and GC shifts. From left to right, graphs show the rate of false positives under purifying selection and neutral evolution (lower left). The graph on the right down corner shows the rate of true positives. The bony vertebrates branch “α” is shown in red, the mammalian branch “β” in yellow, and the euteleostei branch “γ” in purple.
Under neutral evolution, the rate of false positives stayed quite low, going up to some approximately 8% of false positives on the mammalian branch (fig. 6). GC shifts within the tree did not seem to generate a high rate of false positives, with a maximum of approximately 7% on the mammalian branch. Results for simulated GC contents corresponding to human and zebrafish protein-coding genes (47%, 37%, and a shift from 37% to 47%) showed similar rates of false positives as the other simulations. On the other hand, under positive selection, the rate of true positives was different between low and high overall GC content, that is, the high GC content (65%) simulations showed higher rates of true positives on all the branches tested, whereas with extremely high GC content (80%) the test seems to loose some power. Shifts in GC content within the tree did not impact the power of the test noticeably (fig. 6).
Within-Sequence GC Heterogeneity Impact on the Branch-Site Model
Simulating heterogeneity in GC content within the sequence induced no false positives under purifying selection (ω = 0.1 and ω = 0.5) or neutral evolution (ω = 1). On the other hand, while simulating positive selection (ω = 2), the true positives rate was relatively low compared with homogenous GC sequences (∼15% on α, ∼25% on β, and 50% on γ) (supplementary fig. S2, Supplementary Material online).
GC Content Impact on the Site Model
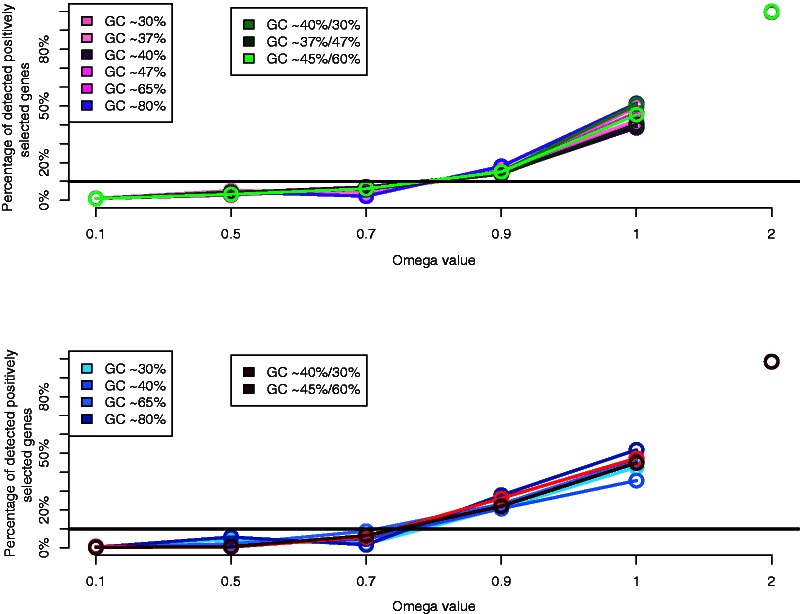
The site model showed no false positives under strong purifying selection, that is, ω = 0.1 and ω = 0.5, for all GC content when contrasting the M1a versus M2a models (supplementary table S3, Supplementary Material online) and the M7 versus M8a models. Under a selective pressure of ω = 0.7, there was a small increase in the rate of false positives, reaching 13% under ω = 0.9. Under neutrality (ω = 1), we detected a high rate of false positives, between approximately 30% and 40%, without any clear correlation between GC content or GC shift and the rate of false positives (fig. 7; supplementary table S3, Supplementary Material online).
Fig. 7.
GC variation effect on the branch-site model. Power of the site model (M2a vs. M1a) and (M7 vs. M8a) under various GC content and GC shifts. Linked dots are rates of false positives, whereas single dots are true positives.
Effect of Positive Selection on Nearby Branches
Simulating positive selection on a branch other than the foreground branch tested showed nearly no influence on the test. Under all selective pressures tested (ω = 1, 2, 3, 4, 6, 8, 10, 12, 14, and 16) and using all permutations of the three foreground branches, the rate of detection of positive selection was nearly null when positive selection is acting on another branch than the foreground branch (fig. 8a–c).
Fig. 8.
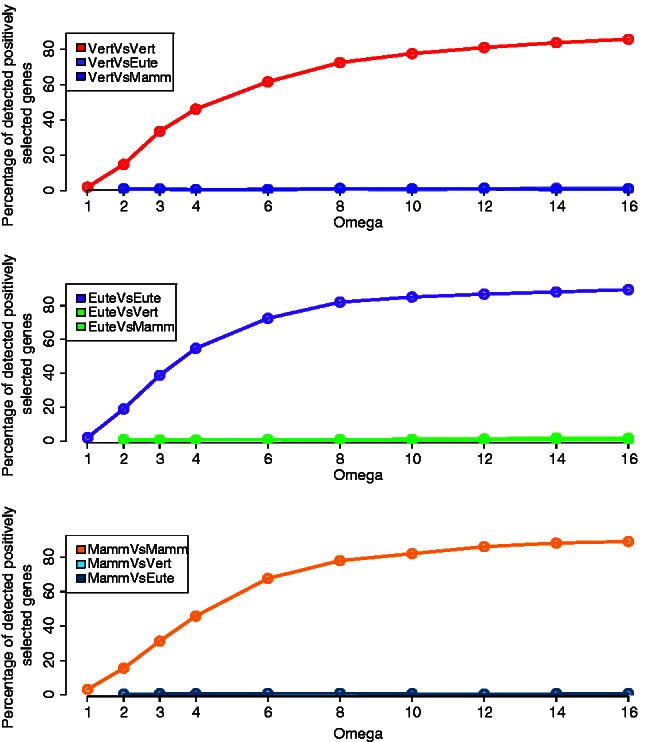
Effect of positive selection on nearby branches. (a) The red line (VertVsVert) shows the detection of positive selection on the vertebrates branch “α” as foreground branch, when positive selection is simulated on the same branch “α.” The light (VertVsEute) and dark (VertVsMamm) purple lines show the detection of positive selection on the euteleostei branch “γ” and the mammalian branch “β,” respectively, for these same data with positive selection simulated on branch “α”. (b and c) These are similar figures but with the positive selection fixed to the mammalian branch “β” or the euteleostei branch “γ,” respectively. The foreground branches were always set to the three branches “α,” “β,” and “γ”.
Discussion
Saturation
Several studies (Yang 1998; Anisimova et al. 2001; Zhang et al. 2005; Anisimova and Yang 2007) have indicated that the best likelihood values were obtained for intermediate values of divergence, and that dN/dS codon models have little power at extreme low and high divergence. Yang and Dos Reis (2011) and Zhang et al. (2005) also showed that the foreground branch length has a major role on the power of the test, that is, the longer it is, the earlier saturation is reached. We first confirm, using parameters from 762 real gene trees, that with very short trees (highly similar sequences), the branch-site test has low power because of the absence of information (Yang 1998; Zhang et al. 2005; Anisimova and Yang 2007; Jordan and Goldman 2012). With increasing tree length, power increases up to a maximum; this maximum varies depending on the initial branch length used, its position in the tree and the initial tree length (fig. 3; supplementary table S1, Supplementary Material online). When the divergence between sequences is higher, the test starts loosing its power gradually (table 2 and figs. 3 and 5). Several studies have shown that highly divergent sequences can suffer from alignment errors, which can cause false positives using the branch-site model (Mallick et al. 2009; Schneider et al. 2009; Fletcher and Yang 2010). Jordan and Goldman (2012) showed that serious model violations and bad quality alignments might be more frequent for very divergent sequences, leading to high rates of false positives for reasons other than saturation of substitutions. We should note that our study is not in contradiction with these findings as we do not treat errors due to sampling, sequencing, or aligning.
However, we show that extreme divergence of sequences alone does not generate false positives using the branch-site model (fig. 4). The test loses its power slower for more recent branches β and γ than for the older branch α, suggesting that the test infers recent substitutions more accurately than ancient substitutions (Zhang et al. 2005) (fig. 3); of note, in our study younger foreground branches are also shorter (supplementary table S1, Supplementary Material online). With high divergence, the variance of the estimation of the substitutions increases, thus decreasing the accuracy of estimating different parameters, that is, branch length, dS, dN, underestimating them in most cases (fig. 3). This loss of accuracy might be due in part to limitations of the optimization of parameters in CODEML (direct evaluation of the source code with Yang Z, personal communication).
A new model developed by Kosakovsky Pond et al. (2011) added random effect likelihood allowing rate variation among sites on the branch-site model (BranchSiteREL). The authors used the same data set as Anisimova and Yang (2007) to evaluate type I and type II errors. The authors noted higher power (type II) and lower error rates (type I) in comparison with the branch-site test that we have evaluated here (Zhang et al. 2005). They also raised several questions notably the extent of divergence levels and branch positioning in the phylogeny affect the type I and type II errors of episodic positive detection tools. Our results provide leads toward answering these questions in the case of the branch-site test. Additional detailed analysis of both models should be performed.
In a recent study, Vanneste et al. (2013) used the site model of Codeml to calculate dS saturation on age distribution in the context of whole genome duplication and found that a dS > 1 (a commonly accepted value) can be used for whole genome duplication (WGD) inference. It appears that different levels of dS saturation are relevant to different use cases.
In this study, we show that saturation can be reached rather rapidly (dS < 1), this saturation has nearly no effect on the rate of false positives, but it can lead to a high rate of false negatives. Table 2 details power of the test depending on the foreground branch test, tree length, dN, dS, and the position of the branch in the tree.
GC Content Impact on the Branch-Site Model
There are strong differences in GC content between genomic regions of mammals and birds (Bernardi et al. 1985; Bernardi 2000), and between these species and other vertebrates (Fujita et al. 2011). Moreover, in studies within mammals or even within primates, variations in recombination rates were found to have a considerable effect on the detection of positive selection, due to the DNA reparation machinery that favors GC nucleotides over AT, that is, gBGC (Galtier et al. 2001). gBGC increases the mutation rate and therefore the dN/dS ratio, and it has been shown that it can be confounded with positive selection, leading to more than 20% of false detection in primates (Duret and Galtier 2009; Ratnakumar et al. 2010).
However, when we simulated GC shifts in vertebrate gene trees, we found no significant effect of the GC shift on the detection of positive selection (fig. 6; supplementary table S2, Supplementary Material online). Of note, we did not explicitly simulate gBGC, but rather changes in equilibrium GC frequencies on large time scales, similar to the emergence of isochores. Under positive selection (ω = 2), we found that the test has higher power to detect positive selection on high GC sequences (∼65%), but not on extremely high GC (∼80%), such as can be found in some bacteria, for example, Anaeromyxobacter dehalogens (Hildebrand et al. 2010). This finding should be investigated more in detail to see whether this is due to a model bias or a biological signal from the “realistic” parameters used in the data set. Recently, a new method of detection of molecular evolution has been proposed, taking into account similar patterns such as transition/transversion ratio and equilibrium GC content (Dutheil et al. 2012), which might help to clarify these processes.
GC Content Impact on the Site Model
We contrasted the branch-site test to the most conservative version of the site model implemented in CODEML (Yang et al. 2000; Anisimova et al. 2002) (model M2a vs. M1a). This model has been widely used in other studies of bias in codon model tests (Anisimova et al. 2001; Yang et al. 2005; Anisimova and Kosiol 2009; Jordan and Goldman 2012). Recently, Privman et al. (2012) studied the effect of detecting unreliably aligned regions on the power of such site models (M8 vs. M8a), and showed that the benefit of removing unreliable sites is greater than the loss of power. Removing uncertainties in alignments decreases the power but increases the precision avoiding false positive detections (Wong et al. 2008; Schneider et al. 2009; Fletcher and Yang 2010). Importantly, variation in dS among sites has been shown to have a strong effect on the site model (Rubinstein et al. 2011). gBGC can also affect these tests (Duret and Galtier 2009; Kostka et al. 2012). In addition, recombination was shown to induce a high rate of false positives for the M7 and M8 likelihood ratio test (LRT), which was reported as a “failure” of the site model (Anisimova et al. 2003). In this study, we investigated the effect of GC content and the GC shifts within the phylogeny on the site models (M2a vs. M1a and M8a vs. M7). Like the branch-site, the site model was neither significantly affected by GC shifts nor by the overall GC content (fig. 7; supplementary table S3, Supplementary Material online).
Whatever the GC content, and in contrast to the branch-site model, we found that the site model is prone to false positives, under neutral or nearly neutral evolution, reaching 40% of false positives in some cases. We recommend differentiating clearly between the site and the branch-site models when studying positive selection. The branch-site appears generally much more conservative and robust than the site model.
Within-Sequence GC Heterogeneity Impact on the Branch-Site Model
Although high GC heterogeneity inside a sequence might be rare, some level of heterogeneity can affect sequences following recombination events, or for genes located on junctions of isochores. We simulated sequences with one half at one equilibrium frequency (e.g., 37%) and the other half at another (e.g., 47%; represented as GC37%–GC47%).
The branch-site model showed again a low rate of false positives under strong purifying selection (ω = 0.1, ω = 0.5) and neutrality (ω = 1). This result shows high robustness of the branch-site model against moderate and high heterogeneity of the GC content within the MSAs. The results for true positives were low especially on the α and β branches, 15% and 25%, respectively (supplementary fig. S2, Supplementary Material online), which might be due to the low positive selection value used, that is, ω = 2.
Effect of Positive Selection on Nearby Branches
As its name indicates, episodic positive selection is an occasional event. If the test is robust, then when positive selection occurs on one branch in the phylogeny this should not affect its detection on another branch. We simulated different rates of positive selection on different branches (see Materials and Methods). In all cases, the branch-site model showed a high rate of detection of positive selection when the simulated branch was the same branch as tested, as expected. Most important, when the branches tested are different from the one simulated under positive selection, we did not detect any bias.
Conclusion
In this study, we first investigated the effect of saturation on the detection of episodic positive selection using the maximum likelihood based branch-site test. We used real gene trees and parameters (see Materials and Methods) to perform our simulations while increasing the divergence of the MSAs and imposing variable selective pressures to detect the rate of false positives and false negatives. Surprisingly, the test showed high robustness against extreme divergence with only few false positives. Although imposing positive selection along with increasing the divergence, we were able to detect saturation/underestimation on both synonymous and nonsynonymous substitutions (figs. 1–3). We delineated a space of parameters in which the test has maximum power to detect positive selection depending on the branch tested. We thus argue that for a synonymous substitution value dS > 0.4, the test potentially looses more than 50% of its power. Of course this value may vary depending on other parameters, that is, foreground branch length, tree length, branch position in the phylogeny (fig. 3), number of sequences in the MSA, length of the MSAs, and of course the quality of the alignment (Zhang et al. 2005; Kosiol et al. 2008; Studer et al. 2008; Anisimova and Kosiol 2009; Dutheil et al. 2012; Jordan and Goldman 2012).
We studied the effect on positive selection on other branches of the tree than the foreground branch tested and found no additional false positives (fig. 8a–c). It has been recently reported that such selection on background branches might decrease the power of the test (Anisimova et al. 2003). We confirm here that the branch-site test is robust to putative positive selection acting on the background branches.
Finally, we investigated the effect of GC content in the MSAs as well, as the GC shifts within a phylogenetic tree and within the MSAs, using the branch-site and the site models of positive selection detection. Using the same data set, the branch-site test showed high robustness with no false positives due to GC content, GC shifts, or within-sequence shifts (fig. 6). Interestingly, we found a higher power of positive selection detection on high GC MSAs compared with low or average GC. The site model showed robustness only for strong purifying selection and fragility for weak purifying selection and neutrality, with high rates of false positives (fig. 7).
Overall, the branch-site test appears very robust and thus well suited to large-scale “fishing expedition” scans for positive selection (Zhai et al. 2012). Future developments should aim to maintain this robustness while increasing power (Kosakovsky Pond et al. 2011).
Materials and Methods
Data Set
MSAs and Trees
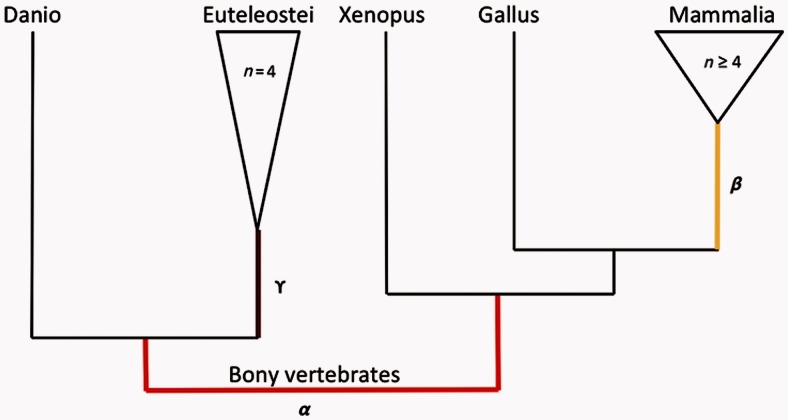
We used 762 singleton gene families from (Hubbard et al. 2002) taken from Studer et al. (2008), using HOMOLENS version 3 (Penel et al. 2009). The data set includes 10 species of tetrapods and 5 species of teleost fishes (fig. 9).
Fig. 9.
Schematic tree of the data set showing the foreground branches tested. The bony vertebrates branch “α” is shown in red, the mammalian branch “β” in yellow, and euteleostei branch “γ” in purple.
Simulations
To generate simulated MSAs, we first used Codeml with the M0 model (table 3) on the data set. Second, from the output results we retrieved parameters needed for the simulations, that is, kappa, omega (ω), the codon frequency matrix, tree length, branch lengths, sequence length, number of species, and tree topology for each gene in the data set. We used the estimated parameters for each gene as input in the simulation program Evolver (Zhang et al. 2005), and evolved sequences given the initial gene tree and the parameters mentioned earlier, with modifications according to the aim of each simulation.
Table 3.
Site: Parameters in Site Model (Yang et al. 2005).
| Model Code | p | Parameters | Notes |
|---|---|---|---|
| M0 (one ratio) | 1 | ω | One ω ratio for all sites |
| M1a (neutral) | 2 | p0 (p1 = 1 − p0) | ω0 < 1, ω1 = 1 |
| M2a (selection) | 4 | p0, p1 (p2 = 1 − p0 − p1) | ω0 < 1, ω1 = 1, ω2 > 1 |
| M7 (β) | 2 | p, q | p, q |
| M8 (β and ω) | 4 | p0 (p1 = 1 − p0) | p, q, ωs > 1 |
To simulate divergent sequences, we modified the tree length parameter, that is, the expected number of substitutions per site. Increasing the tree length increases sequence divergence, while decreasing it increases sequence similarity. For each gene in the data set, we multiplied the original value of tree length by 0.1, 0.5, 0.8, 1, 2, 2.5, 3, 4, 6, 10, 16, 64, 128, and 512. We simulated the MSAs under the branch-site alternative model (model A) (table 1), with four site classes; K0: p0 = 0.82, K1: p1 = 0.11, K2a: (1 − p0 − p1)p0/(p0 + p1) and K2b: (1 − p0 − p1)p1/(p0 + p1), according to table 1. For purifying selection, ω is fixed for each gene family from empirical data (i.e., presimulation run of codeml), for neutrality ω = 1, and for positive selection on the foreground branches (classes 2a and 2b), ω is fixed according to simulation parameters (discussed later).
The selective pressure ω was set on the foreground branch at 0.1 or 0.5 for purifying selection, 1 for neutral evolution, and 2, 6, or 12 for positive selection. Three foreground branches were tested for each gene (bony vertebrates “α,” mammals “β,” and euteleostei “γ”) (fig. 9).
To simulate different diverse GC compositions, we generated F3×4 matrices with different probabilities of occurrence for the four nucleotides depending on the GC content level needed in the simulations. The F3×4 matrices were then converted to 16 × 4 matrices to be used as input. For each gene family, we generated GC30%, GC40%, GC65%, GC80%, GC37%, and GC47%. The GC37% and GC47% are median values of the GC content in zebrafish and in human computed from all protein-coding sequences in the Ensembl database (Hubbard et al. 2002).
To simulate the effect of positive selection acting on other branches than the branch of interest (foreground branch), we simulated positive selection using the branch-site model on one branch and tested another branch as foreground branch, for example, simulate positive selection on “α” and use “β” or “γ” as foreground branch. We contrasted all permutations with the three branches tested with different selective pressures, that is, ω values of 1, 2, 3, 4, 6, 8, 10, 12, and 14. For each branch simulated (bony vertebrates “α,” mammals “β,” and euteleostei “γ”) under positive selection, we conducted three branch-site tests: The first is a positive control, detecting positive selection on the same branch; in the second, we set the foreground branch on a neighboring branch (immediate neighbor toward the root); and in the third, we set the foreground branch on a branch further in the phylogeny (two levels below).
Tree Manipulation for GC Shifts
For each branch of interest, we extracted the subtree defined by this branch; the sequence at the branch of interest is then defined as root_seq. We performed the simulations with low or high GC content on the remaining tree in the same way as detailed earlier. We then used the root_seq as an input for a new simulation on the extracted subtree in the same way, but with different equilibrium frequencies (i.e., different GC). Finally, we reconciled the alignments and used the original tree. We performed three different shifts in GC, an average GC shift (30% GC to 40% GC), a high GC shift (45% to 65%) and a low GC shift (37% to 47%).
We also conducted simulations with GC heterogeneity within the gene sequence (30% to 65%). The different GC compositions were combined with different selective pressures in the simulations: We used ω values of 0.1, 0.5, 0.7, and 0.9 for purifying selection; 1 for neutral evolution; and 2 for positive selection. We simulated using the option 6 of Evolver for codon simulations “evolver 6 MCcodon.dat,” with the M0 (one ratio) model assuming one ω value over all sites and branches in the tree (table 3).
Analysis
All the simulated MSAs were analyzed with CODEML from the PAML package (Yang 2007). For simulations focused on sequence divergence, for each simulated gene family we run the branch-site model with both alternative (H1) and null hypotheses (H0) on the three foreground branches separately (fig. 9). We computed a χ2 test to contrast the likelihood between H0 and H1.
For multiple trees and branches testing correction, we used QVALUE correction for multiple testing (Storey and Tibshirani 2003), as recommended by Anisimova and Yang (2007). Following Studer et al. (2008), for each test independently, that is, each multiplication of the tree length for the sequence divergence analysis and each GC content simulation, we considered all P values calculated from the likelihood ratio test as one series (m branches × n trees). We used the bootstrap method for estimating π0 in the R package QVALUE (documentation QVALUE Library), with a FDR value of 10%.
For the GC content analysis, when there was a shift in GC we tagged as foreground branch the branch downstream of the branch with the GC shift (fig. 9), and in addition to the branch-site model we used the site model, contrasting the likelihood between M1a against M2a and M7 against M8a models (Yang et al. 2000).
To detect saturation of synonymous and nonsynonymous substitutions, we used the maximum likelihood estimation method developed by Yang and Nielsen (2000), known also as the YN00 method, extended to the four classes of the branch-site model: We calculated a Q-matrix for each site class and independently for the foreground and background branches (table 1).
Supplementary Material
Supplementary tables S1–S3 and figures S1 and S2 are available at Molecular Biology and Evolution online (http://www.mbe.oxfordjournals.org/). The data set is available at: http://bioinfo.unil.ch/supdata/Divergence_GC_variation_data_2013.tar.gz (last accessed April 16, 2013).
Acknowledgments
The authors thank the editor and two anonymous reviewers for their thoughtful comments. They thank Ziheng Yang, Laurent Duret, and Nicolas Salamin for helpful discussions. The computations were performed at the Vital-IT (http://www.vital-it.ch, last accessed April 16, 2013) Center for high-performance computing of the SIB (Swiss Institute of Bioinformatics). This work was supported by the Swiss Institute of Bioinformatics, by the Swiss National Science Foundation [grant number 31003A 133011/1], and by Etat de Vaud.
References
- Anisimova M, Bielawski JP, Yang Z. Accuracy and power of the likelihood ratio test in detecting adaptive molecular evolution. Mol Biol Evol. 2001;18:1585–1592. doi: 10.1093/oxfordjournals.molbev.a003945. [DOI] [PubMed] [Google Scholar]
- Anisimova M, Bielawski JP, Yang Z. Accuracy and power of bayes prediction of amino acid sites under positive selection. Mol Biol Evol. 2002;19:950–958. doi: 10.1093/oxfordjournals.molbev.a004152. [DOI] [PubMed] [Google Scholar]
- Anisimova M, Kosiol C. Investigating protein-coding sequence evolution with probabilistic codon substitution models. Mol Biol Evol. 2009;26:255–271. doi: 10.1093/molbev/msn232. [DOI] [PubMed] [Google Scholar]
- Anisimova M, Nielsen R, Yang Z. Effect of recombination on the accuracy of the likelihood method for detecting positive selection at amino acid sites. Genetics. 2003;164:1229–1236. doi: 10.1093/genetics/164.3.1229. [DOI] [PMC free article] [PubMed] [Google Scholar]
- Anisimova M, Yang Z. Multiple hypothesis testing to detect lineages under positive selection that affects only a few sites. Mol Biol Evol. 2007;24:1219–1228. doi: 10.1093/molbev/msm042. [DOI] [PubMed] [Google Scholar]
- Bernardi G. Isochores and the evolutionary genomics of vertebrates. Gene. 2000;241:3–17. doi: 10.1016/s0378-1119(99)00485-0. [DOI] [PubMed] [Google Scholar]
- Bernardi G, Olofsson B, Filipski J, Zerial M, Salinas J, Cuny G, Meunier-Rotival M, Rodier F. The mosaic genome of warm-blooded vertebrates. Science. 1985;228:953–958. doi: 10.1126/science.4001930. [DOI] [PubMed] [Google Scholar]
- Cannarozzi GM, Schneider A. Codon evolution: mechanisms and models. Oxford: Oxford University Press; 2012. [Google Scholar]
- Duret L, Galtier N. Biased gene conversion and the evolution of mammalian genomic landscapes. Annu Rev Genomics Hum Genet. 2009;10:285–311. doi: 10.1146/annurev-genom-082908-150001. [DOI] [PubMed] [Google Scholar]
- Dutheil JY, Galtier N, Romiguier J, Douzery EJ, Ranwez V, Boussau B. Efficient selection of branch-specific models of sequence evolution. Mol Biol Evol. 2012;29:1861–1874. doi: 10.1093/molbev/mss059. [DOI] [PubMed] [Google Scholar]
- Eyre-Walker A, Hurst LD. The evolution of isochores. Nat Rev Genet. 2001;2:549–555. doi: 10.1038/35080577. [DOI] [PubMed] [Google Scholar]
- Fletcher W, Yang Z. The effect of insertions, deletions, and alignment errors on the branch-site test of positive selection. Mol Biol Evol. 2010;27:2257–2267. doi: 10.1093/molbev/msq115. [DOI] [PubMed] [Google Scholar]
- Friedman R, Hughes AL. Likelihood-ratio tests for positive selection of human and mouse duplicate genes reveal nonconservative and anomalous properties of widely used methods. Mol Phylogenet Evol. 2007;42:388–393. doi: 10.1016/j.ympev.2006.07.015. [DOI] [PubMed] [Google Scholar]
- Fujita MK, Edwards SV, Ponting CP. The Anolis lizard genome: an amniote genome without isochores. Genome Biol Evol. 2011;3:974–984. doi: 10.1093/gbe/evr072. [DOI] [PMC free article] [PubMed] [Google Scholar]
- Galtier N, Piganeau G, Mouchiroud D, Duret L. GC-content evolution in mammalian genomes: the biased gene conversion hypothesis. Genetics. 2001;159:907–911. doi: 10.1093/genetics/159.2.907. [DOI] [PMC free article] [PubMed] [Google Scholar]
- Hildebrand F, Meyer A, Eyre-Walker A. Evidence of selection upon genomic GC-content in bacteria. PLoS Genet. 2010;6:pii:e1001107. doi: 10.1371/journal.pgen.1001107. [DOI] [PMC free article] [PubMed] [Google Scholar]
- Hubbard T, Barker D, Birney E, et al. (36 co-authors) The Ensembl genome database project. Nucleic Acids Res. 2002;30:38–41. doi: 10.1093/nar/30.1.38. [DOI] [PMC free article] [PubMed] [Google Scholar]
- Hughes AL. Looking for Darwin in all the wrong places: the misguided quest for positive selection at the nucleotide sequence level. Heredity. 2007;99:364–373. doi: 10.1038/sj.hdy.6801031. [DOI] [PubMed] [Google Scholar]
- Hughes AL. Evolution of adaptive phenotypic traits without positive Darwinian selection. Heredity. 2012;108:347–353. doi: 10.1038/hdy.2011.97. [DOI] [PMC free article] [PubMed] [Google Scholar]
- Hughes AL, Friedman R. Codon-based tests of positive selection, branch lengths, and the evolution of mammalian immune system genes. Immunogenetics. 2008;60:495–506. doi: 10.1007/s00251-008-0304-4. [DOI] [PMC free article] [PubMed] [Google Scholar]
- Jordan G, Goldman N. The effects of alignment error and alignment filtering on the sitewise detection of positive selection. Mol Biol Evol. 2012;29:1125–1139. doi: 10.1093/molbev/msr272. [DOI] [PubMed] [Google Scholar]
- Kosakovsky Pond SL, Murrell B, Fourment M, Frost SD, Delport W, Scheffler K. A random effects branch-site model for detecting episodic diversifying selection. Mol Biol Evol. 2011;28:3033–3043. doi: 10.1093/molbev/msr125. [DOI] [PMC free article] [PubMed] [Google Scholar]
- Kosiol C, Holmes I, Goldman N. An empirical codon model for protein sequence evolution. Mol Biol Evol. 2007;24:1464–1479. doi: 10.1093/molbev/msm064. [DOI] [PubMed] [Google Scholar]
- Kosiol C, Vinar T, da Fonseca RR, Hubisz MJ, Bustamante CD, Nielsen R, Siepel A. Patterns of positive selection in six mammalian genomes. PLoS Genet. 2008;4:e1000144. doi: 10.1371/journal.pgen.1000144. [DOI] [PMC free article] [PubMed] [Google Scholar]
- Kostka D, Hubisz MJ, Siepel A, Pollard KS. The role of GC-biased gene conversion in shaping the fastest evolving regions of the human genome. Mol Biol Evol. 2012;29:1047–1057. doi: 10.1093/molbev/msr279. [DOI] [PMC free article] [PubMed] [Google Scholar]
- Mallick S, Gnerre S, Muller P, Reich D. The difficulty of avoiding false positives in genome scans for natural selection. Genome Res. 2009;19:922–933. doi: 10.1101/gr.086512.108. [DOI] [PMC free article] [PubMed] [Google Scholar]
- Nozawa M, Suzuki Y, Nei M. Reliabilities of identifying positive selection by the branch-site and the site-prediction methods. Proc Natl Acad Sci U S A. 2009;106:6700–6705. doi: 10.1073/pnas.0901855106. [DOI] [PMC free article] [PubMed] [Google Scholar]
- Penel S, Arigon AM, Dufayard JF, Sertier AS, Daubin V, Duret L, Gouy M, Perriere G. Databases of homologous gene families for comparative genomics. BMC Bioinformatics. 2009;10(6 Suppl):S3. doi: 10.1186/1471-2105-10-S6-S3. [DOI] [PMC free article] [PubMed] [Google Scholar]
- Privman E, Penn O, Pupko T. Improving the performance of positive selection inference by filtering unreliable alignment regions. Mol Biol Evol. 2012;29:1–5. doi: 10.1093/molbev/msr177. [DOI] [PubMed] [Google Scholar]
- Ratnakumar A, Mousset S, Glemin S, Berglund J, Galtier N, Duret L, Webster MT. Detecting positive selection within genomes: the problem of biased gene conversion. Philos Trans R Soc Lond B Biol Sci. 2010;365:2571–2580. doi: 10.1098/rstb.2010.0007. [DOI] [PMC free article] [PubMed] [Google Scholar]
- Rubinstein ND, Doron-Faigenboim A, Mayrose I, Pupko T. Evolutionary models accounting for layers of selection in protein-coding genes and their impact on the inference of positive selection. Mol Biol Evol. 2011;28:3297–3308. doi: 10.1093/molbev/msr162. [DOI] [PubMed] [Google Scholar]
- Schneider A, Souvorov A, Sabath N, Landan G, Gonnet GH, Graur D. Estimates of positive Darwinian selection are inflated by errors in sequencing, annotation, and alignment. Genome Biol Evol. 2009;1:114–118. doi: 10.1093/gbe/evp012. [DOI] [PMC free article] [PubMed] [Google Scholar]
- Storey JD, Tibshirani R. Statistical significance for genomewide studies. Proc Natl Acad Sci U S A. 2003;100:9440–9445. doi: 10.1073/pnas.1530509100. [DOI] [PMC free article] [PubMed] [Google Scholar]
- Studer RA, Penel S, Duret L, Robinson-Rechavi M. Pervasive positive selection on duplicated and nonduplicated vertebrate protein coding genes. Genome Res. 2008;18:1393–1402. doi: 10.1101/gr.076992.108. [DOI] [PMC free article] [PubMed] [Google Scholar]
- Vanneste K, Van de Peer Y, Maere S. Inference of genome duplications from age distributions revisited. Mol Biol Evol. 2013;30:177–190. doi: 10.1093/molbev/mss214. [DOI] [PubMed] [Google Scholar]
- Wong KM, Suchard MA, Huelsenbeck JP. Alignment uncertainty and genomic analysis. Science. 2008;319:473–476. doi: 10.1126/science.1151532. [DOI] [PubMed] [Google Scholar]
- Yang Z. On the best evolutionary rate for phylogenetic analysis. Syst Biol. 1998;47:125–133. doi: 10.1080/106351598261067. [DOI] [PubMed] [Google Scholar]
- Yang Z. PAML 4: phylogenetic analysis by maximum likelihood. Mol Biol Evol. 2007;24:1586–1591. doi: 10.1093/molbev/msm088. [DOI] [PubMed] [Google Scholar]
- Yang Z, Dos Reis M. Statistical properties of the branch-site test of positive selection. Mol Biol Evol. 2011;28:1217–1228. doi: 10.1093/molbev/msq303. [DOI] [PubMed] [Google Scholar]
- Yang Z, Nielsen R. Estimating synonymous and nonsynonymous substitution rates under realistic evolutionary models. Mol Biol Evol. 2000;17:32–43. doi: 10.1093/oxfordjournals.molbev.a026236. [DOI] [PubMed] [Google Scholar]
- Yang Z, Nielsen R, Goldman N, Pedersen AM. Codon-substitution models for heterogeneous selection pressure at amino acid sites. Genetics. 2000;155:431–449. doi: 10.1093/genetics/155.1.431. [DOI] [PMC free article] [PubMed] [Google Scholar]
- Yang Z, Wong WS, Nielsen R. Bayes empirical bayes inference of amino acid sites under positive selection. Mol Biol Evol. 2005;22:1107–1118. doi: 10.1093/molbev/msi097. [DOI] [PubMed] [Google Scholar]
- Zhai W, Nielsen R, Goldman N, Yang Z. Looking for Darwin in genomic sequences—validity and success of statistical methods. Mol Biol Evol. 2012;29:2889–2893. doi: 10.1093/molbev/mss104. [DOI] [PubMed] [Google Scholar]
- Zhang J, Nielsen R, Yang Z. Evaluation of an improved branch-site likelihood method for detecting positive selection at the molecular level. Mol Biol Evol. 2005;22:2472–2479. doi: 10.1093/molbev/msi237. [DOI] [PubMed] [Google Scholar]
Associated Data
This section collects any data citations, data availability statements, or supplementary materials included in this article.


