

Abstract
The genomes of many vertebrates show a characteristic heterogeneous distribution of GC content, the so-called GC isochore structure. The origin of isochores has been explained via the mechanism of GC-biased gene conversion (gBGC). However, although the isochore structure is declining in many mammalian genomes, the heterogeneity in GC content is being reinforced in the avian genome. Despite this discrepancy, which remains unexplained, examinations of individual substitution frequencies in mammals and birds are both consistent with the gBGC model of isochore evolution. On the other hand, a negative correlation between substitution and recombination rate found in the chicken genome is inconsistent with the gBGC model. It should therefore be important to consider along with gBGC other consequences of recombination on the origin and fate of mutations, as well as to account for relationships between recombination rate and other genomic features. We therefore developed an analytical model to describe the substitution patterns found in the chicken genome, and further investigated the relationships between substitution patterns and several genomic features in a rigorous statistical framework. Our analysis indicates that GC content itself, either directly or indirectly via interrelations to other genomic features, has an impact on the substitution pattern. Further, we suggest that this phenomenon is particularly visible in avian genomes due to their unusually low rate of chromosomal evolution. Because of this, interrelations between GC content and other genomic features are being reinforced, and are as such more pronounced in avian genomes as compared with other vertebrate genomes with a less stable karyotype.
Keywords: gene conversion, base composition, GC isochores, recombination, birds, karyotype
Introduction
Base composition is distributed heterogeneously across the genome of most vertebrates and is characterized by large-scale variation in GC content, the so-called GC isochore structure (Filipski et al. 1973; Eyre-Walker and Hurst 2001; Costantini et al. 2009). The origin of GC isochores has been explained by the mechanism of GC-biased gene conversion (gBGC) (Galtier et al. 2001; Montoya-Burgos et al. 2003; Meunier and Duret 2004; Duret and Arndt 2008; Duret and Galtier 2009), that is, small-scale, unidirectional exchanges between homologous chromosomes in the neighborhood of recombination-initiating double-strand breaks (DSBs). As a result of gBGC, individuals that are AT/GC heterozygote near DSBs produce more GC- than AT-gametes, which leads to a fixation bias for GC- alleles over AT-alleles in high-recombining regions. Thus, high-recombining regions tend to show higher GC content than low-recombining regions, resulting in a positive correlation between GC content and recombination rate. Besides the correlation between GC content and recombination rate, GC content also correlates with a number of other features of the genomic landscape such as gene density, intron size, repeat element distribution, replication timing and patterns of gene expression (Mouchiroud et al. 1991; Lercher et al. 2003; Vinogradov 2003; Costantini and Bernardi 2008). This suggests that GC isochores are involved in some key aspects of genome organization. However, despite the widespread occurrence of GC isochore structures in vertebrate genomes, decisive differences in the evolution of GC isochores have been reported. Earlier studies, mainly conducted in primates and rodents, suggested that the GC content appears to be homogenized and GC isochores will ultimately disappear in mammalian genomes (Duret et al. 2002; Lercher et al. 2002; Belle et al. 2004). However, a recent study across a wider range of mammalian lineages suggested a more dynamic picture of GC content evolution in mammals (Romiguier et al. 2010). Some lineages, for example, shrews, bats, and rabbits, appear to increase in the average genomic GC content as well as in its variance. The latter could indicate that regions high in GC content further increase in GC content and regions poor in GC content evolve toward an even lower GC content, together leading to a reinforcement of the GC isochore structure, a pattern that we previously reported for the chicken (Gallus gallus) genome (Webster et al. 2006). The causes of the discrepancy in GC content evolution are not well understood but could have important implications to our knowledge of the evolution of heterogeneous genomic landscapes of base composition.
Seeking to identify a difference between genomes that could potentially affect the evolution of GC isochores we here in detail investigate the signatures of gBGC in the chicken genome (as one representative of a genome showing a reinforcement of the isochore structure) as a complement to detailed investigations of gBGC in the human genome (as one representative of a genomes showing an erosion of the isochore structure). Also, we elaborate on a previously reported negative relationship between nucleotide substitution rate and recombination rate in the chicken genome (Mugal et al. 2013), which contradicts some previous suggestions of a mutagenic effect of recombination (Hellmann et al. 2003, Hicks et al. 2010). First, we highlight that many genomic features are strongly correlated with each other in the chicken genome. We then perform an in-depth statistical analysis of impacts of genomic features on nucleotide substitutions patterns, which we complement by an analytical model of gBGC that captures interrelationships between genomic features. In addition, a comparison of signatures of gBGC in chicken and turkey shows that signatures of gBGC are more strongly conserved in evolutionary stable regions than in unstable regions. This latter finding triggers the hypothesis that genome stability constitutes a key aspect in base composition evolution. Finally, we note that the avian karyotype is more stable compared with the mammalian karyotype (Burt et al. 1999; Shetty et al. 1999; Ellegren 2010), which together with our findings raises the argument that the discrepancies in GC content evolution between birds and at least some mammalian lineages are related to differences in karyotype stability.
Results
The Impact of Recombination Rate on Nucleotide Substitution Patterns
We estimated chicken-specific nucleotide substitution rates in nonoverlapping 1 Mb windows using whole-genome alignments of chicken, turkey (Meleagris gallapavo) and zebra finch (Taeniopygia guttata). The estimates fell in the range between 0.024 and 0.058 substitutions per site along the chicken branch, with a mean of 0.036. For our analysis, we restricted the data to a set of 880 windows of 1 Mb for which estimates of the six genomic features, recombination rate, GC content, gene density, repeat density, CpG island (CGI) coverage, and distance to telomere were available. We first investigated the relationships among these features by computing pair-wise and partial correlations, where in the partial correlations we controlled for all the remaining factors (table 1). This revealed that all of the considered genomic features are interrelated with each other. In particular, it showed strong relationships between genomic features and GC content. Correlations between explanatory variables will create difficulties in all kind of regression-like analysis. Inferences about causal relationships based on multilinear regression (MLR) analysis therefore need to be made carefully, and additional analysis, which takes into account correlations between explanatory variables, will be necessary.
Table 1.
Pair-Wise Correlations (above the Diagonal) and Partial Correlations (below the Diagonal) between the Six Genomic Features Used as Candidate Explanatory Variables for Variation in Nucleotide Substitution Rate.
| Recombination Rate | GC Content | Gene Density | Repeat Density | CGI Coverage | Distance to Telomere | |
|---|---|---|---|---|---|---|
| Recombination rate | — | 0.60 | 0.46 | −0.37 | 0.30 | −0.30 |
| GC content | 0.40 | — | 0.73 | −0.57 | 0.52 | −0.46 |
| Gene density | 0.05 | 0.47 | — | −0.49 | 0.60 | −0.35 |
| Repeat density | −0.03 | −0.23 | −0.07 | — | −0.41 | 0.47 |
| CGI coverage | −0.04 | 0.10 | 0.37 | −0.12 | — | −0.29 |
| Distance to telomere | −0.02 | −0.18 | 0.01 | 0.28 | 0.03 | — |
Note.—Values significant at a P value threshold of 0.001 are underlined.
We thus performed standard MLR, partial correlation analysis, and principal component (PC) regression (PCR) using nucleotide substitution rate as response variable and the six genomic features as candidate explanatory variables. The results are summarized in table 2. Both MLR and PCR showed that the total amount of variance explained was 42.1% and the overall picture was similar between all three kinds of analysis, though the relative importance of the genomic features on substitution rate variation showed some slight differences. The MLR and partial correlation analysis identified a strong negative impact of GC content and the distance to telomere and a strong positive impact of repeat density. The impact of recombination rate and gene density was weak but statistically significant, whereas CGI coverage showed a negligible impact on substitution rate variation. Note that adding chromosome length as explanatory variable did not change the overall picture (supplementary table S1, Supplementary Material online). The only obvious difference introduced by incorporating chromosome length was that the impact of distance to telomere, which itself could be considered an indirect measure of chromosome length, was canceled by the effect of chromosome length. Such lack of impact might at first glance appear unexpected, as previous studies have indicated that substitution rate depends on chromosome length (Axelsson et al. 2005). However, correlations are transitive relations. Thus, a correlation between chromosome size and genomic features together with a correlation between these genomic features and substitution rate will lead to a correlation between chromosome size and substitution rate, even if noncausative in nature. As such, chromosome size does not constitute an additional causative variable and therefore does not change the overall picture in an MLR setup. Adding quadratic terms of recombination rate and GC content in the MLR analysis suggests that GC content is nonlinearly related to substitution rate. Log-transformed data of recombination rate on the other hand seem to be reflected by a linear relationship to substitution rate (supplementary table S2, Supplementary Material online).
Table 2.
Estimates and Statistical Significance (P Value) of the MLR Analysis for the Six-Candidate Explanatory Variables of Nucleotide Substitution Rate (Columns 1 and 2).
| Estimate | P Value | Partial Correlation Coefficient | % Variance Explained (PCR) | |
|---|---|---|---|---|
| Recombination rate | −4.47 × 10⁻⁴ | 5.9 × 10⁻³** | −0.09 | 4.59 |
| GC content | −2.12 × 10⁻³ | <10−15*** | −0.30 | 8.02 |
| Gene density | 6.09 × 10⁻⁴ | 2.8 × 10⁻³** | 0.10 | 6.55 |
| Repeat density | 2.22 × 10⁻³ | <10−15*** | 0.41 | 11.74 |
| CGI coverage | 1.54 × 10⁻⁴ | 3.5 × 10⁻¹ | 0.03 | 4.88 |
| Distance to telomere | −9.60 × 10⁻⁴ | 3.8 × 10⁻¹⁰*** | −0.21 | 6.31 |
Notes.—P values are marked with asterisks to highlight their significance level, where double and triple asterisks indicate P values below a threshold of 0.01 and 0.001, respectively. Column 3 lists partial correlation coefficients, where statistical significance is identical to the MLR analysis. Column 4 lists the amount of variation explained by each of the explanatory variables according to PCR.
The relative importance of the six genomic features on substitution rate variation was similar in PCR, but the analysis further accentuated the problems due to correlations between the explanatory variables. In PCR, the grouping of explanatory variables into PCs is based on correlations of explanatory variables and the direction of impact of the explanatory variables will reflect the direction of impact of the true causative variable(s) that contribute(s) to a particular PC. Figure 1 shows that the contribution of the six genomic features on substitution rate variation can basically be split up into two independent parts, represented by PC 1 and PC 4, which together explained 38.3% of the variation in nucleotide substitution rate. PC 1 reflected a positive relationship between repeat density and substitution rate and between distance to telomere and substitution rate. The relationship between the four remaining genomic features that contribute to PC 1 (recombination rate, GC content, gene density, and CGI coverage) and substitution rate was negative. PC 4 reflected a positive relationship between repeat density and substitution rate (we will not deal with this aspect further but note the potential connection to replication fork arrest in repeats attracting error prone repair; McDonald et al. 2011), and a negative relationship between distance to telomere and substitution rate. Note that PC 1, which all six genomic features build up, constituted the main explanatory variable and thus any of the six features could constitute the causative explanatory variable. Even if the PCR did not provide much information on the causative explanatory variable, the analysis showed that the compound effect of all six genomic features, represented by PC 1, led to a negative relationship between nucleotide substitution rate and recombination rate. PC 4 suggested that after correction for the impact of PC 1, there was a negative impact of distance to telomere on nucleotide substitution rate.
Fig. 1.

Amount of variation in nucleotide substitution rate explained by the different explanatory variables based on PCR analysis. Left larger panel: PCR analysis of total substitution rate. Right smaller panels: PCR analysis of W → S, S → W, W → W, and S → S nucleotide substitution rates. The height of each bar represents how much of the variance in nucleotide substitution rate is explained by the corresponding PC. The size of each colored area is proportional to the relative contribution of the respective genomic feature within each PC.
The negative relationship between nucleotide substitution rate and recombination rate seems not only contradictory to a mutagenic effect of recombination, but given that the current GC content is not at equilibrium might also contradict a model of gBGC. To explore this further, we first obtained the genome-wide averages of current and equilibrium GC content (GC*). Although the current GC content was 0.40, GC* was estimated at 0.48, indicating that at the genome-level chicken seems to be increasing in GC content. When looking at the regional level, where GC content ranges between 0.32 and 0.54, we found a strong positive correlation between GC content and GC* (r = 0.81, P value < 1e−15). Notably, the slope between GC* versus current GC content was significantly greater than 1 (slope = 1.65, P value < 1e−15; fig. 2), indicating an ongoing reinforcement of the isochore structure in the chicken genome, as previously reported by Webster et al. (2006). Thus, at the regional level the chicken genome is not at equilibrium of the mutation and gBGC process and consequently gBGC would lead to a positive relationship between nucleotide substitution rate and recombination rate, contradictory to the patterns found in chicken. To examine this in more detail, we computed pair-wise correlation coefficients between recombination rate and total nucleotide substitution rate (r = −0.39), W → S (r = 0.27), S → W (r = −0.60), S → S (r = −0.34), and W → W (r = −0.50; all P values < 1e−15; fig. 3) nucleotide substitution rates. In agreement with a model of gBGC, the correlation was positive for W → S substitution rate and negative for S → W substitution rate, that is, with the propensity for W → S versus S → W substitutions increasing with increasing recombination rate. On the other hand, the negative correlations between recombination rate and S → S, W → W and total substitution rates cannot be explained by a model of gBGC.
Fig. 2.
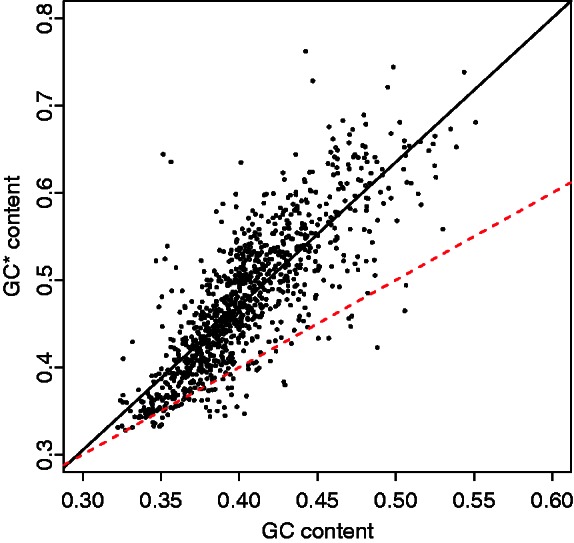
Pair-wise relationship between GC* and current GC content. The black solid line represents the linear regression line fitted to the data. The red dashed line represents the bisecting line of the first quadrant (x = y).
Fig. 3.

Left larger panel: pair-wise relationship between total substitution rate and recombination rate. Right smaller panels: Pair-wise relationship between chicken-specific W → S, S → W, W → W, and S → S nucleotide substitution rate and recombination rate. Correlation coefficients presented in the upper right corner of each panel represent Pearson correlation coefficients. Black lines represent linear regression lines fitted to the data.
In separate PCR analyses with each of W → S, S → W, S → S, and W → W nucleotide substitution rates as response variable (fig. 1), the amount of variance explained was 19.3%, 77.6%, 62.2%, and 38.3%, respectively. In all four cases, PC 1 and PC 4 again made up the main contribution to substitution rate variation. For S → W, S → S, and W → W nucleotide substitution rates, the direction of the relationships was the same as for total substitution rate. However, and in agreement with a model of gBGC, the direction of the relationship between each of the six genomic features that contribute to PC 1 and W → S substitution rate was opposite to that of total nucleotide substitution rate. This strongly suggests that the impact of recombination rate on W → S substitution rate via the mechanism of gBGC is strong enough to counteract the otherwise negative relationship between substitution rate and recombination rate. Moreover, because of the strong correlations between recombination rate and the other features that contribute to PC 1, recombination rate drags the other features with it, leading to opposite directions of relationships in all cases. The presence of contradictory forces led to an overall decrease in the amount of variation explained, that is, 77.6% for S → W versus 19.3% for W → S substitution rate. The direction of relationships in PC 4, to which recombination rate did not contribute significantly, was the same for W → S, S → W, S → S, and W → W nucleotide substitution rates as it was for the total substitution rate. In summary, the PCR analysis illustrated that gBGC has an impact on the nucleotide substitution pattern, but that there is an additional force that counteracts the impact of gBGC in case of W → S substitutions and leads to negative correlations between recombination rate and total nucleotide substitution rate as well as between recombination rate and S → S and W → W substitution rates. In addition, it seems to reinforce the negative correlation between recombination rate and S → W substitution rate.
An Extended Model of gBGC
In the following and complementary to the statistical analysis of substitution patterns, we describe the patterns of gBGC in the chicken genome by an extended model of GC content evolution that also comprises other influences than just the local recombination rate. We first introduce a model of gBGC, which we refer to as the classical model of gBGC and which describes the impact of recombination rate and GC content, via gBGC, on total nucleotide substitution rate. The model distinguishes among W → S, S → W, S → S, and W → W nucleotide substitutions, and as such the total nucleotide substitution rate is given by,
| (1) |
where xGC denotes the GC content. Given that any of W → S, S → W, S → S, and W → W substitution rates differ from each other, the total substitution rate depends on the local base composition in the ancestral genome, more precisely on the content of “weak” versus “strong” nucleotides, which can be summarized by the GC content. However, as the GC content in chicken and turkey are strongly correlated with each other (r = 0.99, P value < 1e−15), changes in GC content after the split of chicken and turkey appear negligibly small to justify approximating the ancestral GC content by the current GC content found in the chicken genome. Furthermore, the total substitution rate depends on the four types of nucleotide substitution rates uX→Y, where the pair (X, Y) represents any of the four possible combinations between weak and strong nucleotides. Each of the four nucleotide substitution rates uX→Y, depends on the effective population size N, on the particular mutation rate µX→Y and on the probability of fixation pX→Y,
| (2) |
We consider substitutions that evolve neutrally so that the probability of fixation is not influenced by natural selection, but only by gBGC. gBGC behaves like selection, however, it only impacts the probability of fixation of W → S and S → W substitutions and not the other types of substitutions (Nagylaki 1983),
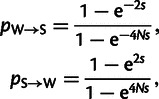 |
(3) |
with s = cr and where c represents a constant that specifies the species-specific strength of gBGC and r denotes recombination rate. Combining equations (1)–(3), we can express the total substitution rate u in a given genomic region as a function of recombination rate and GC content by the following equation,
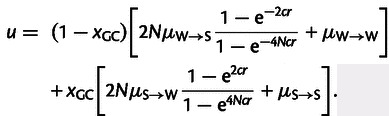 |
(4) |
Thus, the classical model of gBGC describes total substitution rate u as a function of recombination rate and GC content, and it comprises the six lineage-specific parameters, N, c, µS→S, µW→W, µW→S, and µS→W. The impact of gBGC on the probability of fixation is modeled in such a way that it reflects the average impact of recombination rate in a given genomic region, ignoring the fact that recombination rate might vary within the given genomic region. This simplifying assumption is necessary to adapt our model to the data available for chicken, where the resolution of recombination rate estimates is limited to 1 Mb windows.
We next fitted the nucleotide substitution rate estimates observed in 1 Mb windows to the classical model of gBGC in a maximum likelihood (ML) framework (table 3; for details see Materials and Methods). Based on the model and the ML parameter estimates, we computed nucleotide substitution rate as a function of recombination rate and GC content. Both predicted and observed substitution rates showed mean values of 0.036. The coefficient of variation (CV) was two orders of magnitude lower for predicted substitution rate (CV = 3.86 × 10⁻⁶) compared with observed substitution rate (CV = 6.86 × 10⁻⁴). Correlation analysis revealed strong positive correlations between predicted substitution rate and recombination rate as well as GC content (r = 0.79 and r = 0.66, respectively), as opposed to the negative correlations found in the observed data (r = −0.39 and r = −0.54, respectively). The predicted positive correlation between substitution rate and recombination rate suggests that given the range of recombination rate between 0 and 23 cM, gBGC acts to increase GC content in regions of high recombination rate and thereby increases substitution rate. The positive correlation between substitution rate and GC content on the other hand arises from the presence of a mutation bias toward AT (µS→W > µW→S), which leads to an increased substitution rate in GC-rich regions. Finally, the positive correlation between recombination rate and GC content acts to reinforce their respective correlations with substitution rate.
Table 3.
Maximum-Likelihood Parameter Estimates of the Classical and the Expanded Model of gBGC.
| Parameters |
||||||||
|---|---|---|---|---|---|---|---|---|
| µS→S | µW→W | µW→S | µS→W | N | a | b | c (×106) | |
| Classical model of gBGC | 0.0071 | 0.0059 | 0.027 | 0.034 | 11,000 | — | — | 0.98 |
| Expanded model of gBGC | 0.0071 | 0.0059 | 0.026 | 0.035 | 11,000 | 0.91 | −26 | 1.31 |
Note.—Note that mutation rate estimates µX→Y represent rate estimates per site and branch, that is, they are estimated as the number of mutations per site for the chicken branch after its split from turkey. Parameters N, a, b, and c are dimensionless.
Given the predicted positive relationship between recombination rate and nucleotide substitution rate and in agreement with the above-described regression analysis, the classical model of gBGC does not well describe the signatures of gBGC found in the chicken genome. We therefore introduce an expanded model, which comprises the classical signatures of gBGC but in addition takes into account an additional force that distorts signatures of gBGC as revealed above by the PCR analysis. Based on the PCR analysis, the additional force could be any of the six genomic features that contribute to PC 1, or even any other correlated variable that is not included in our analysis. As GC content makes up the main contribution to PC 1 and as we can only speculate about causal relationships based on biological mechanisms, we propose GC content as the possible additional force well aware of that this might actually not reflect a true causal relationship. However, this has the advantage that we do not need to incorporate an additional explanatory variable in our model, as GC content already constitutes an explanatory variable in the classical model of gBGC. Now, to examine the relationship between nucleotide substitution rate and GC content, we first plotted the pair-wise relationships between W → S, S → W, S → S, and W → W nucleotide substitution rate and GC content, shown in figure 4. As expected, given that GC content and recombination rate are correlated, the pair-wise relationship between substitution rates and GC content are similar to the pair-wise relationship between substitution rates and recombination rate. However, figure 4 suggests a nonlinear relationship between substitution rates and GC content. To further elaborate on the relationship between substitution rates and GC content, we investigated the relationship between total nucleotide substitution rate and GC content separately for windows where estimates of recombination rate were equal to zero or larger than zero (fig. 4). This suggests that independently of the impact of recombination rate on substitution rate, GC content shows a nonlinear negative impact on substitution rate. As it has been previously suggested that GC content influences the rate of mutation (Tyekucheva et al. 2008) and in the absence of evidence that GC content affects the probability of fixation, we expand the classical model of gBGC by the function φ(xGC), which describes the exponential decay of mutation rate with increasing GC content,
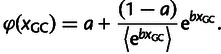 |
(5) |
Note that the chevrons 〈 〉 are used to indicate the average, when averaging over all 1 Mb windows and their corresponding GC content. As such the function φ(xGC) is restricted such that 〈φ(xGC)〉 is equal to one. Incorporation of the function φ(xGC) into the classical model of gBGC leads to the following description of an expanded model of gBGC,
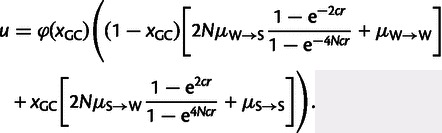 |
(6) |
We fitted the nucleotide substitution rate estimates observed in the 1 Mb windows to the expanded model of gBGC in a ML framework (table 3). Then, we computed nucleotide substitution rate as a function of recombination rate and GC content, now based on the expanded model and the respective ML parameter estimates. The expanded model revealed negative correlations between predicted substitution rate and recombination rate as well as GC content (r = −0.40 and r = −0.77, respectively), in agreement with the negative correlations in the observed data. Predicted and observed substitution rates again showed similar mean values, and the variance of the predicted rate now better reflects the observed data [mean(u) = 0.036, CV = 6.13 × 10⁻⁵ for predicted substitution rate]. To statistically test the better fit of the expanded model to the observed data, we performed a likelihood ratio test, which clearly showed a significant improvement of the expanded model as compared with the classical model of gBGC (D = 598, Δdf = 2, P value < 2e−16).
Fig. 4.

Left larger panel: pair-wise relationship between total substitution rate and GC content. Red crosses represent windows where recombination rate estimates are equal to zero and black dots represent windows where recombination rate estimates are larger than zero. Right smaller panels: pair-wise relationship between chicken-specific W → S, S → W, W → W, and S → S nucleotide substitution rate and GC content. Correlation coefficients presented in the upper right corner of each panel represent Pearson correlation coefficients.
Conservation of Signatures of gBGC in the Galliform Genome
It is possible that correlations between recombination rate and GC content as well as other genomic features are particularly strong in birds because the avian genome represents an evolutionary stable karyotype, allowing correlations to build up through time. For example, with a low overall rate of chromosomal rearrangements the genomic landscape of recombination rate variation should be relatively stable, reinforcing genomic features that depend on the recombination rate (see Discussion). To test this possibility, we sought to compare substitution patterns in regions of the avian genome that have been particularly stable during avian evolution with regions that have been identified as being prone to evolutionary breakpoints. This within-genome comparison has the advantage over, for example, comparing substitution patterns between birds and mammals that it keeps the genetic background constant. Using three-species data from chicken, turkey, and zebra finch, we estimated chicken-specific and turkey-specific substitution rates in 200 1-Mb windows that lie closest to evolutionary breakpoint regions (data set I, see Materials and Methods) and in 200 1-Mb windows that lie furthest away from evolutionary breakpoint regions (data set II). Under the hypothesis that karyotype stability indirectly affects W → S and S → W substitution rates via recombination and gBGC, we would expect chicken- and turkey-specific rates to be more conserved in particularly stable regions compared with regions where frequent rearrangements have altered the recombination landscape. Indeed, for W → S and S → W substitution rates the correlation between chicken- and turkey-specific rates is significantly reduced in data set I compared with data set II; correlation coefficients and 95% confidence intervals (CIs) are r = 0.41 in [0.29, 0.52] versus r = 0.62 in [0.53, 0.70] for W → S substitution rate and r = 0.79 in [0.73, 0.84] versus r = 0.92 in [0.90, 0.94] for S → W substitution rate. For S → S and W → W substitution rates, the 95% CIs overlap between data set I and II. Moreover, according to the model of gBGC, W → S nucleotide substitution rate should be most sensitive to changes in recombination rate. In line with this, we find that the conservation of W → S substitution rate was in general weaker than the conservation of S → W rate. Further, given that the substitution pattern is more conserved in evolutionary stable regions than in breakpoint regions, we would expect that also the current GC content better reflects GC* in evolutionary stable regions than in breakpoint regions. This is confirmed by a reduced correlation between GC content and GC* in data set I compared with data set II, where CIs however overlap; correlation coefficients and 95% CIs are r = 0.80 in [0.75, 0.85] versus r = 0.86 in [0.81, 0.89].
The earlier-mentioned analysis examined evolutionary breakpoint regions in galliform (Galliformes, the order of birds to which chicken and turkey belong) genomes, where rearrangements might be of intrachromosomal or interchromosomal nature. To focus on the effects of large-scale interchromosomal rearrangements on conservation in substitution patterns, we pinpointed the two major rearrangements during galliform evolution, a fission of the ancestral (=chicken) chromosome 2 occurring in the turkey lineage after the split from chicken and a fusion of two smaller ancestral chromosomes occurring in the chicken lineage after the split from turkey, forming chicken chromosome 4 (Shibusawa et al. 2004; Reed et al. 2007). In both cases, the fusion/fission points thus represent telomeric regions of turkey chromosomes and (sub)metacentric regions of chicken chromosomes. Avian chromosomes typically show a pronounced increase in recombination rate toward telomeres (Groenen et al. 2009; Backstrom et al. 2010). Figure 5 visualizes the relative difference of W → S and S → W substitution rates between chicken-specific and turkey-specific rate estimates along chicken chromosomes 2 and 4, respectively. Although the difference between chicken-specific and turkey-specific rate estimates seems to randomly fluctuate around a certain mean value in the genomic background, the difference clearly peaks out and deviates from the mean around the fission point of chromosome 2 and around the fusion point of chromosome 4. W → S substitution rate shows an increase in turkey relative to chicken, whereas S → W substitution rate shows a decrease, in agreement with an increased recombination rate in the turkey lineage at the telomeres.
Fig. 5.

Relative difference in W → S and S → W nucleotide substitution rate between chicken and turkey plotted along chicken chromosomes 2 and 4. One dot represents the difference in nucleotide substitution rate estimated for a 1 Mb window at the respective position on the chromosome. The black solid line shows a kernel regression smoother through the point estimates of bandwidth 5. The vertical red dashed line in each panel indicates the fission point of chromosome 2 or the fusion point of chromosome 4, which occurred in the turkey and chicken lineage, respectively, after their divergence.
Discussion
The Stable-Karyotype Hypothesis
Biological processes such as recombination and mutation are dependent on genomic position and context (Ellegren et al. 2003; Hodgkinson and Eyre-Walker 2011; Webster and Hurst 2012). Chromosomal rearrangements that change the genomic landscape have hence also the potential to change the rates and patterns of processes dependent on genomic position and context. Conversely, in the absence of rearrangements, the character of processes may remain conserved during evolution, allowing for the smooth build-up, maintenance and reinforcement of signatures associated with these processes. In turn, this can be expected to lead to strengthened correlations between measures of the processes and their genomic signatures, for example, base composition.
It has been repeatedly noted that avian karyotypes are highly conserved (Griffin et al. 2007; Ellegren 2010). For example, chromosome number shows limited variation, with the majority of bird species having 2n = 76–80 and including a large (relatively constant) number of microchromosomes (Christidis et al. 1991). Moreover, interchromosomal rearrangements mostly occur at a very low rate, with an ancestral karyotype from early (>100 Ma) avian evolution still present in many lineages, at least as far as the larger and identifiable macrochromosomes are concerned (Griffin et al. 2007). Indeed, cross-species chromosomal painting (ZOO-FISH) reveals highly conserved synteny across the most divergent lineages of birds (Shetty et al. 1999). This is in sharp contrast to the situation for mammals, in which chromosome numbers are much more variable and where numerous inter-chromosomal rearrangements have generated a mosaic of syntenic relationships among chromosomes between species (Ferguson-Smith and Trifonov 2007; Ruiz-Herrera et al. 2012). Recent quantitative efforts have revealed that the number of chromosome rearrangements per million years is almost three times higher in primates compared with galliforms (Dalloul et al. 2010). Further, it should be noted that the rate of rearrangements in primates is low compared with some other mammalian lineages, particularly rodents (Bourque et al. 2005).
In light of the earlier discussion, we posit that an evolutionary stable avian karyotype has facilitated a conservation of genomic features and led to strong correlations between measures of the associated processes and their signatures. This lends some support from empirical data, for example, broad-scale recombination rates are well conserved across avian species (Backstrom et al. 2010). Moreover, the current GC content and the equilibrium GC content GC*, both show a similarly strong correlation to recombination rate in our data (r = 0.62 and r = 0.64 for GC and GC*, respectively, both P values < 10−15), whereas in the human genome GC* shows a significantly stronger correlation to recombination rate than the current GC content (Duret and Arndt 2008). This suggests that the evolution of GC content in the chicken genome has been relatively steady over evolutionary time and, as a consequence, the impact of recombination via gBGC on the nucleotide substitution pattern is well reflected in the relationship between the current GC content and recombination rate.
Furthermore, we argue that the difference in the evolution of GC isochore structure between human and chicken is directly related to their difference in karyotype stability. With a stable karyotype, such as in chicken, the effect of gBGC on nucleotide substitution and thereby base composition in particular genomic regions will remain relatively constant over significant periods of time, favoring the maintenance and even reinforcement of GC isochore structure. With a less stable karyotype, such as in human, the effect of gBGC will vary over time and, as a consequence, act as to homogenize the landscape of base composition. Our hypothesis is supported by the observation that evolutionary stable regions of the chicken and turkey genomes show a stronger conservation of signatures of gBGC than unstable regions (fig. 5), well in line with recent findings in a comparison of signatures of gBGC between human and chimpanzee (Auton et al. 2012). Thus, in primates as well as in galliforms evolutionary stability seems to play an important role in GC content evolution. Now, given an overall lower rate of chromosomal rearrangements in galliforms compared with primates, this could explain why the former show a reinforcement of the GC isochore structure, whereas it is eroding in the latter. This hypothesis is further supported by the fact that the rodent genome, a particularly unstable karyotype, shows an even stronger erosion of the isochore structure compared with primates (Romiguier et al. 2010).
Correlations between GC Content and Genomic Features and Their Impact on Mutation Rate
Compared with mammalian genomes, not only the relationship between recombination rate and GC content is particularly strong in the chicken genome, other features also show strong correlations to GC content (table 1). The strongest correlation was found between GC content and gene density, where a correlation between GC content and gene density might reflect the tendency of genes to be located in GC-rich regions (Mouchiroud et al. 1991; Bernardi 1993; Lercher et al. 2003). In avian genomes, the correlation might be reinforced indirectly via a correlation between recombination rate and gene density. Nam and Ellegren (2012) have recently shown that recombination drives vertebrate genome contraction, where high-recombining regions tend to show a higher rate of deletions compared with insertions, which will make high-recombining regions more compact and thus increase gene density. In addition, it has been shown that DSBs, which constitute a prerequisite for recombination initiation, preferentially occur in regions that are rich in H3K4me3 marks (Brick et al. 2012). These marks are often present in gene promoter regions and other functional genomic elements, where the activity of a histone H3 methyltransferase PRDM9 assists to redirect DSBs away from functional genomic regions (Brick et al. 2012). However, as PRDM9 appears to be lacking in the chicken genome (Oliver et al. 2009), DSBs might be less effectively redirected from functional regions, which would lead to a further link between recombination rate and gene density in the chicken genome.
Aside from gene density, repeat density, and recombination rate, GC content correlates with many other important genomic features. For example, it has been shown that the replication-banding pattern is fairly equivalent to G- and R-banding patterns (Drouin et al. 1994), where in general G bands are primarily composed of AT-rich sequences and correspond to late-replicating zones, and R bands are composed of both GC- and AT-rich sequences, where in particular the GC-rich sequences tend to replicate very early during S-phase. More precisely, replication timing zones tend to align well to GC isochores (Bernardi 2000; Schmegner et al. 2007; Costantini and Bernardi 2008; Hiratani et al. 2008). It has further been suggested that replication timing constitutes a major determinant of mutation rate variation, where late-replicating regions show a markedly increased mutation rate compared with earlier replicating regions (Stamatoyannopoulos et al. 2009). All classes of nucleotide substitutions appear to be affected similarly, that is, suggesting a generalized mechanism involving replication time-dependent DNA damage.
The correlation between replication timing and mutation rate taken together with the alignment between replication timing zones and GC isochores provides a plausible explanation for a negative relationship between GC content and nucleotide substitution rate, as found in this study of the chicken genome. At first glance, this appears contradictory to our earlier findings of a positive relationship between GC content and nucleotide substitution rate (Webster et al. 2006). However, Webster et al. included CpG → TpG/CpA substitutions for estimation of the total substitution rate, while this category of substitutions was excluded in this study. Considering that a large proportion of all substitutions is due to CpG → TpG/CpA substitutions and that the CpG content is expected to increase with GC content, the inclusion of CpG substitutions is likely to explain this difference. This is supported by the fact that for individual W → W, W → S, and S → W nucleotide substitution rates, Webster et al. reported similar relationships with GC content as our study. A difference in the relationship between S → S and substitutions and GC content could arise from the fact that the study by Webster et al. was based on substitutions in CR1 repeats, whereas we here consider nonrepetitive intergenic regions.
Given the negative relationship between GC content and nucleotide substitution rate and taking this one step further and considering the link between recombination rate and GC content via gBGC, this provides us with an explanation of the negative relationship between recombination rate and nucleotide substitution rate. Furthermore, GC content and gene density might be related to chromatin opening, providing an additional link between GC content and mutation rate (Xi et al. 2007; Di Filippo and Bernardi 2008). Finally, Fryxell and Moon (2005) argued for a direct, that is, causative, relationship between GC content and mutation rate, and suggested that the thermostability of double-stranded DNA, which is increased in GC-rich regions, might be a rate-limiting factor of mutation. However, regardless of the reason for the negative relationship between GC content and mutation rate, the link between recombination rate and GC content via the mechanism of gBGC explains well the unexpected negative correlation between recombination rate and nucleotide substitution rate in chicken, well supported by our expanded model of gBGC. And we argue that this negative relationship between nucleotide substitution rate and recombination rate is well in agreement with the above-introduced stable-karyotype-hypothesis, as it is the stable karyotype that facilitates the build-up of genomic correlates. In contrast, in the less stable human karyotype the relationship between recombination rate and nucleotide substitution rate remains positive, despite the fact that individual W → S, S → W, S → S, and W → W nucleotide substitution rates show a similar relationship with GC content as in chicken (Duret and Arndt 2008).
Interestingly, the negative correlation between recombination rate and nucleotide substitution rate matches a recent finding by Capra and Pollard (2011), who showed that while most metazoans show strong signatures of gBGC in divergent sequences, this is not the case in chicken. Because of the strong negative correlation between GC content and mutation rate in chicken, divergent sequences will preferentially be located in GC-poor regions, that is, regions where recombination is low and consequently gBGC have operated only weakly. Thus, if we want to correct for signatures of gBGC on inferences of selection, it will be important to consider that the actual strength of these signatures, which depends on the strength of recombination rate, might also vary in relationship to mutation rate.
Conclusions
In this study, we highlight the strong interrelations between genomic features in the chicken genome, which we argue lead to a negative relationship between recombination rate and nucleotide substitution rate. We then support the descriptive results by a mathematical modeling approach and introduce a model, which collectively describes the impact of recombination via gBGC on nucleotide substitution rate together with some other correlated and in part counteracting forces. Finally, a comparison of evolutionary stable versus unstable regions reveals that evolutionary stable regions show a stronger conservation of signatures of gBGC than unstable regions. This latter finding triggers the hypothesis that genome stability constitutes a key aspect in base composition evolution. In consideration of the fact that the avian karyotype is more stable compared with the mammalian karyotype and that bird genomes are thus characterized by an unusually slow rate of chromosomal evolution, this leads us to hypothesize that the unexpected patterns found in the chicken genome are related to the evolutionary stable avian karyotype. To the extent that biological processes such as recombination are dependent on genomic position and context, this should lead to an enhancement of correlations between measures of the processes and their signatures, like the correlation between recombination rate and GC content.
Materials and Methods
Sequence Data
Sequence alignments of orthologous intergenic regions for chicken, turkey, and zebra finch were retrieved using the three neognath birds EPO whole-genome alignments from the Ensembl database release 63 using the Ensembl perl Application Programme Interfaces. We then partitioned the whole-genome alignments into consecutive, nonoverlapping windows of 1 Mb, where partitioning was performed with reference to the chicken genome. Positions of transcribed regions including untranslated regions (UTRs) and repetitive sequences were established and masked from the alignments. Exons and UTRs coordinates were obtained through the BioMart query interface (http://www.ensembl.org/biomart/martview, last accessed April 17, 2013) (Smedley et al. 2009). When no UTR was annotated for a transcript, we excluded 77 bp upstream of the transcript (i.e., in 5' direction) and 372 bp downstream of the transcript (i.e., in 3' direction), sizes corresponding to the mean lengths of annotated 5'- and 3'-UTRs in chicken, respectively. Annotation of repetitive sequences was based on the RepeatMasker program and positions of repetitive sequences were retrieved from the Ensembl database release 63. Finally, we restricted the data to windows with a minimum of 10,000 unambiguous sites, of which there were 1,030 windows of size 1 Mb.
Estimation of Nucleotide Substitution Rate and GC*
We estimated chicken- as well as turkey-specific nucleotide substitution rates for intergenic regions along the branch from the last common ancestor of chicken and turkey using an ML approach (Duret and Arndt 2008). In this framework, triple alignments of two sister species (in our case chicken and turkey) with one outgroup species (zebra finch) are taken and a general model of sequence evolution is fitted to these data. This probabilistic model does not assume stationarity of the nucleotide substitution process, accounts for multiple hits, distinguishes six reverse complement symmetric nucleotide exchanges, incorporates neighbor dependency due to the prevalent methyl-cytosine de-amination process at CpG sites (CpG → CpA/TpG) and is lineage-specific, that is, models the two branches to the sister species independently. Based on this model, we then computed the total nucleotide substitution rate as well as W → S, S → W, S → S, and W → W nucleotide substitution rates for chicken and turkey, where W indicates “weak” nucleotides (A, T) and S indicates “strong” nucleotides (C, G). Briefly, X → Y substitution rate represents the number of changes along a specific branch from nucleotides X to nucleotides Y per nucleotide of type X. For example, chicken-specific W → S nucleotide substitution rate gives the number of changes along the chicken branch from A or T to G or C per “weak” nucleotide site. Further, to avoid that nucleotide substitution rate variation and specifically S → W nucleotide substitution rate variation is caused by hypermutability of CpG sites and thus being affected by the local CpG content and DNA methylation level, changes of the type CpG → CpA/TpG were excluded from the analysis. The estimation of lineage-specific substitution rate allows us to estimate the GC content at equilibrium GC* as
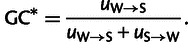 |
(7) |
Estimation of Genomic Features
We estimated gene density as the proportion of exonic sites within a particular window. We also included UTRs and exon–intron boundaries as “genic” sites, as they might represent functionally important sequences. For the exon–intron boundaries, we included 10 bp of intronic sequence after the end and before the start of each exon (Abril et al. 2005). Repeat density was defined as the proportion of repetitive sites within a particular window. GC content was defined as the proportion of guanines (G) and cytosines (C) in a particular window after masking of transcribed and repetitive sequences. Positions of CGIs were retrieved from the Ensembl database release 63. CGI coverage was then determined as the proportion of sites covered by a CGI within a particular window. Further, we computed the distance of the center of each window to its nearest telomere. Finally, we estimated sex-averaged chicken recombination rate using data from Groenen et al. (2009) and the WUGSC 2.1 chicken assembly. Recombination rate per 1 Mb window was computed as the mean recombination rate (genetic distance/physical distance) between markers weighted by the physical distance between markers, ranging from 0 to 28.6 cM per 1 Mb window.
Distance to Evolutionary Breakpoints
We retrieved information of evolutionary breakpoint regions in galliform genomes for chicken chromosomes 1–10 from a study by Skinner and Griffin (2012), which classified regions prone to breakpoints based on alignments of entire chromosome sequences between chicken, turkey, and zebra finch. An evolutionary breakpoint region was defined as a region between segments, which have been rearranged because the split of chicken and turkey. The position of the evolutionary breakpoint was approximated as the center of the region. We then computed the distance between the center of each 1 Mb window used throughout our analysis and its respective nearest evolutionary breakpoint. Finally, based on this distance estimate, we defined two data sets where we classified the 200 1-Mb windows that lie closest to evolutionary breakpoint regions into data set I, and the 200 1-Mb windows that lie furthest away from evolutionary breakpoint regions into data set II.
Statistical Analysis
We performed MLR analysis with nucleotide substitution rate as response variable and recombination rate, GC content, gene density, repeat density, CGI coverage, and distance to telomere as possible explanatory variables. Regression analysis was based on 880 out of 1,030 nonoverlapping windows of size 1 Mb in the chicken genome, where data on all six possible explanatory variables were available. We transformed the explanatory variables to reduce the skewness in their distributions. Recombination rate was log-transformed to base 10, after adding a constant of 1 to allow for zero rate values. All the other explanatory variables were transformed by the square root. Regression analysis was then performed after Z-transformation of the explanatory variables, which means standardization of the mean value to 0 and of the standard deviation to 1.
As MLR analysis is sensitive to multicollinearity in the explanatory variables, we additionally performed PCR analysis, a regression setup that accounts for the multicollinearity in the explanatory variables and elaborates on the interrelationships between explanatory variables. First, PCR groups together explanatory variables into PCs based on their correlations with each other, whereas subsequent regression analysis and the number of significant PCs illustrates the number of independent effects on the response variable. Each significant PC represents an independent effect by one of the contributors to the respective PC on the response variable, most likely the main contributor, which we refer to as the true explanatory variable. The remaining contributors to the PC are likely to be dragged by the true explanatory variable via their correlations to the true explanatory variable. As such PCR enables us to quantify a lower bound of the amount of variation explained by the true explanatory variable, where the upper bound is given by the R2 that would be obtained by simple linear regression.
For PCR analysis, as described earlier for the MLR analysis, explanatory variables were first transformed to reduce the skewness in their distributions and then Z-transformed. In addition, estimates of nucleotide substitution rate were also Z-transformed. PCR analysis was then conducted for total nucleotide substitution rate, W → S, S → W, S → S, and W → W nucleotide substitution rate separately. All statistical analyses were performed with the software package R version 2.9.2.
Maximum-Likelihood Framework
Let us consider a model that describes total substitution rate u as a function of GC content xGC and recombination rate r and a set of parameters θ, that are specific to the model,
| (8) |
Then, given a window i with estimates of substitution rate ui, GC content xGCi and recombination rate ri, the likelihood to observe the estimate of total substitution rate ui can be approximated by
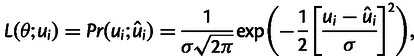 |
(9) |
where ûi represents the expected value of substitution rate for window i based on the model. Further, σ represents the standard deviation of substitution rate and we assume that deviations of our model are Gaussian distributed. Taking into account that in our model, we can distinguish between the four classes of nucleotide substitutions, W → S, S → W, S → S and W → W nucleotide substitutions, and that the total nucleotide substitution rate ui is set up by these four types of nucleotide substitutions uij, where the index j denotes the kind of substitution, then the likelihood function for window i can be rewritten as
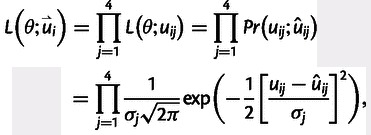 |
(10) |
where  denotes a data vector of the four classes of substitution rates for window i. Further, given a set of nonoverlapping independent windows i = 1, … , N, the product of the likelihoods over the N windows gives the total likelihood,
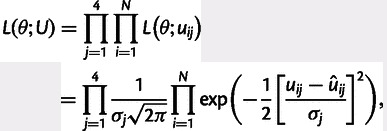 |
(11) |
where U denotes a data matrix of substitution rate estimates uij. Now, for a given set of windows, we can maximize the likelihood function by varying the parameters θ that are specific to the respective model of nucleotide substitution rate. As we assume the errors to be Gaussian distributed, this method is virtually identical to a (weighted) least-squares criterion. However, the maximum-likelihood framework allows us to statistically compare nested models using a likelihood ratio test. The maximum-likelihood estimation was performed with the software package R version 2.9.2.
Supplementary Material
Supplementary tables S1 and S2 are available at Molecular Biology and Evolution online (http://www.mbe.oxfordjournals.org/).
Acknowledgments
The authors thank Niclas Backström for helpful discussion and several reviewers for helpful comments on an earlier version of the manuscript. This work was supported by the Lars Hierta Foundation and Nilsson-Ehle Donations to C.F.M. and by the European Research Council, Knut and Alice Wallenberg Foundation and Swedish Research Council to H.E.
References
- Abril JF, Castelo R, Guigó R. Comparison of splice sites in mammals and chicken. Genome Res. 2005;15:111–119. doi: 10.1101/gr.3108805. [DOI] [PMC free article] [PubMed] [Google Scholar]
- Auton A, Fledel-Alon A, Pfeifer S, et al. (23 co-authors) A fine-scale chimpanzee genetic map from population sequencing. Science. 2012;336:193–198. doi: 10.1126/science.1216872. [DOI] [PMC free article] [PubMed] [Google Scholar]
- Axelsson E, Webster MT, Smith NGC, Burt DW, Ellegren H. Comparison of the chicken and turkey genomes reveals a higher rate of nucleotide divergence on microchromosomes than macrochromosomes. Genome Res. 2005;15:120–125. doi: 10.1101/gr.3021305. [DOI] [PMC free article] [PubMed] [Google Scholar]
- Backström N, Forstmeier W, Schielzeth H, et al. (11 co-authors) The recombination landscape of the zebra finch Taeniopygia guttata genome. Genome Res. 2010;20:485–495. doi: 10.1101/gr.101410.109. [DOI] [PMC free article] [PubMed] [Google Scholar]
- Belle EMS, Duret L, Galtier N, Eyre-Walker A. The decline of isochores in mammals: an assessment of the GC content variation along the mammalian phylogeny. J Mol Evol. 2004;58:653–660. doi: 10.1007/s00239-004-2587-x. [DOI] [PubMed] [Google Scholar]
- Bernardi G. The isochore organization of the human genome and its evolutionary history—a review. Gene. 1993;135:57–66. doi: 10.1016/0378-1119(93)90049-9. [DOI] [PubMed] [Google Scholar]
- Bernardi G. Isochores and the evolutionary genomics of vertebrates. Gene. 2000;241:3–17. doi: 10.1016/s0378-1119(99)00485-0. [DOI] [PubMed] [Google Scholar]
- Bourque G, Zdobnov EM, Bork P, Pevzner PA, Tesler G. Comparative architectures of mammalian and chicken genomes reveal highly variable rates of genomic rearrangements across different lineages. Genome Res. 2005;15:98–110. doi: 10.1101/gr.3002305. [DOI] [PMC free article] [PubMed] [Google Scholar]
- Brick K, Smagulova F, Khil P, Camerini-Otero RD, Petukhova GV. Genetic recombination is directed away from functional genomic elements in mice. Nature. 2012;485:642–645. doi: 10.1038/nature11089. [DOI] [PMC free article] [PubMed] [Google Scholar]
- Burt DW, Bruley C, Dunn IC, et al. (13 co-authors) The dynamics of chromosome evolution in birds and mammals. Nature. 1999;402:411–413. doi: 10.1038/46555. [DOI] [PubMed] [Google Scholar]
- Capra JA, Pollard KS. Substitution patterns are GC-biased in divergent sequences across the Metazoans. Genome Biol Evol. 2011;3:516–527. doi: 10.1093/gbe/evr051. [DOI] [PMC free article] [PubMed] [Google Scholar]
- Christidis L, Shaw DD, Schodde R. Chromosomal evolution in parrots, lorikeets and cockatoos (Aves, Psittaciformes) Hereditas. 1991;114:47–56. [Google Scholar]
- Costantini M, Bernardi G. Replication timing, chromosomal bands, and isochores. Proc Natl Acad Sci U S A. 2008;105:3433–3437. doi: 10.1073/pnas.0710587105. [DOI] [PMC free article] [PubMed] [Google Scholar]
- Costantini M, Cammarano R, Bernardi G. The evolution of isochore patterns in vertebrate genomes. BMC Genomics. 2009;10:146. doi: 10.1186/1471-2164-10-146. [DOI] [PMC free article] [PubMed] [Google Scholar]
- Dalloul RA, Long JA, Zimin AV, et al. (71 co-authors) Multi-platform next-generation sequencing of the domestic turkey (Meleagris gallopavo): genome assembly and analysis. PLoS Biol. 2010;8:e1000475. doi: 10.1371/journal.pbio.1000475. [DOI] [PMC free article] [PubMed] [Google Scholar]
- Di Filippo M, Bernardi G. Mapping DNase-I hypersensitive sites on human isochores. Gene. 2008;419:62–65. doi: 10.1016/j.gene.2008.02.012. [DOI] [PubMed] [Google Scholar]
- Drouin R, Holmquist GP, Richer CL. High-resolution replication bands compared with morphologic G-bands and R-bands. Adv Hum Genet. 1994;22:47–115. doi: 10.1007/978-1-4757-9062-7_2. [DOI] [PubMed] [Google Scholar]
- Duret L, Arndt PF. The impact of recombination on nucleotide substitutions in the human genome. PLoS Genet. 2008;4:e1000071. doi: 10.1371/journal.pgen.1000071. [DOI] [PMC free article] [PubMed] [Google Scholar]
- Duret L, Galtier N. Biased gene conversion and the evolution of mammalian genomic landscapes. Annu Rev Genomics Hum Genet. 2009;10:285–311. doi: 10.1146/annurev-genom-082908-150001. [DOI] [PubMed] [Google Scholar]
- Duret L, Semon M, Piganeau G, Mouchiroud D, Galtier N. Vanishing GC-rich isochores in mammalian genomes. Genetics. 2002;162:1837–1847. doi: 10.1093/genetics/162.4.1837. [DOI] [PMC free article] [PubMed] [Google Scholar]
- Ellegren H. Evolutionary stasis: the stable chromosomes of birds. Trends Ecol Evol. 2010;25:283–291. doi: 10.1016/j.tree.2009.12.004. [DOI] [PubMed] [Google Scholar]
- Ellegren H, Smith NGC, Webster MT. Mutation rate variation in the mammalian genome. Curr Opin Genet Dev. 2003;13:562–568. doi: 10.1016/j.gde.2003.10.008. [DOI] [PubMed] [Google Scholar]
- Eyre-Walker A, Hurst LD. The evolution of isochores. Nat Rev Genet. 2001;2:549–555. doi: 10.1038/35080577. [DOI] [PubMed] [Google Scholar]
- Ferguson-Smith MA, Trifonov V. Mammalian karyotype evolution. Nat Rev Genet. 2007;8:950–962. doi: 10.1038/nrg2199. [DOI] [PubMed] [Google Scholar]
- Filipski J, Thiery JP, Bernardi G. An analysis of the bovine genome by Cs2SO4-Ag density gradient centrifugation. J Mol Biol. 1973;80:177–197. doi: 10.1016/0022-2836(73)90240-4. [DOI] [PubMed] [Google Scholar]
- Fryxell KJ, Moon WJ. CpG mutation rates in the human genome are highly dependent on local GC content. Mol Biol Evol. 2005;22:650–658. doi: 10.1093/molbev/msi043. [DOI] [PubMed] [Google Scholar]
- Galtier N, Piganeau G, Mouchiroud D, Duret L. GC-content evolution in mammalian genomes: the biased gene conversion hypothesis. Genetics. 2001;159:907–911. doi: 10.1093/genetics/159.2.907. [DOI] [PMC free article] [PubMed] [Google Scholar]
- Griffin DK, Robertson LB, Tempest HG, Skinner BM. The evolution of the avian genome as revealed by comparative molecular cytogenetics. Cytogenet Genome Res. 2007;117:64–77. doi: 10.1159/000103166. [DOI] [PubMed] [Google Scholar]
- Groenen MAM, Wahlberg P, Foglio M, et al. (12 co-authors) A high-density SNP-based linkage map of the chicken genome reveals sequence features correlated with recombination rate. Genome Res. 2009;19:510–519. doi: 10.1101/gr.086538.108. [DOI] [PMC free article] [PubMed] [Google Scholar]
- Hellmann I, Ebersberger I, Ptak SE, Pääbo S, Przeworski M. A neutral explanation for the correlation of diversity with recombination rates in humans. Am J Hum Genet. 2003;72:1527–1535. doi: 10.1086/375657. [DOI] [PMC free article] [PubMed] [Google Scholar]
- Hicks WM, Kim M, Haber JE. Increased mutagenesis and unique mutation signature associated with mitotic gene conversion. Science. 2010;329:82–85. doi: 10.1126/science.1191125. [DOI] [PMC free article] [PubMed] [Google Scholar]
- Hiratani I, Ryba T, Itoh M, Yokochi T, Schwaiger M, Chang CW, Lyou Y, Townes TM, Schubeler D, Gilbert DM. Global reorganization of replication domains during embryonic stem cell differentiation. PLoS Biol. 2008;6:2220–2236. doi: 10.1371/journal.pbio.0060245. [DOI] [PMC free article] [PubMed] [Google Scholar]
- Hodgkinson A, Eyre-Walker A. Variation in the mutation rate across mammalian genomes. Nat Rev Genet. 2011;12:756–766. doi: 10.1038/nrg3098. [DOI] [PubMed] [Google Scholar]
- Lercher MJ, Smith NGC, Eyre-Walker A, Hurst LD. The evolution of isochores: evidence from SNP frequency distributions. Genetics. 2002;162:1805–1810. doi: 10.1093/genetics/162.4.1805. [DOI] [PMC free article] [PubMed] [Google Scholar]
- Lercher MJ, Urrutia AO, Pavlicek A, Hurst LD. A unification of mosaic structures in the human genome. Hum Mol Genet. 2003;12:2411–2415. doi: 10.1093/hmg/ddg251. [DOI] [PubMed] [Google Scholar]
- McDonald MJ, Wang WC, Huang HD, Leu JY. Clusters of nucleotide substitutions and insertion/deletion mutations are associated with repeat sequences. PLoS Biol. 2011;9:e1000622. doi: 10.1371/journal.pbio.1000622. [DOI] [PMC free article] [PubMed] [Google Scholar]
- Meunier J, Duret L. Recombination drives the evolution of GC-content in the human genome. Mol Biol Evol. 2004;21:984–990. doi: 10.1093/molbev/msh070. [DOI] [PubMed] [Google Scholar]
- Montoya-Burgos JI, Boursot P, Galtier N. Recombination explains isochores in mammalian genomes. Trends Genet. 2003;19:128–130. doi: 10.1016/S0168-9525(03)00021-0. [DOI] [PubMed] [Google Scholar]
- Mouchiroud D, Donofrio G, Aissani B, Macaya G, Gautier C, Bernardi G. The distribution of genes in the human genome. Gene. 1991;100:181–187. doi: 10.1016/0378-1119(91)90364-h. [DOI] [PubMed] [Google Scholar]
- Mugal CF, Nabholz B, Ellegren H. Genome-wide analysis in chicken reveals that local levels of genetic diversity are mainly governed by the rate of recombination. BMC Genomics. 2013;14:86. doi: 10.1186/1471-2164-14-86. [DOI] [PMC free article] [PubMed] [Google Scholar]
- Nagylaki T. Evolution of a finite population under gene conversion. Proc Natl Acad Sci U S A. 1983;80:6278–6281. doi: 10.1073/pnas.80.20.6278. [DOI] [PMC free article] [PubMed] [Google Scholar]
- Nam K, Ellegren H. Recombination drives vertebrate genome contraction. PLoS Genet. 2012;8:e1002680. doi: 10.1371/journal.pgen.1002680. [DOI] [PMC free article] [PubMed] [Google Scholar]
- Oliver PL, Goodstadt L, Bayes JJ, Birtle Z, Roach KC, Phadnis N, Beatson SA, Lunter G, Malik HS, Ponting CP. Accelerated evolution of the Prdm9 speciation gene across diverse Metazoan taxa. PLoS Genet. 2009;5:e1000753. doi: 10.1371/journal.pgen.1000753. [DOI] [PMC free article] [PubMed] [Google Scholar]
- Reed KM, Chaves LD, Mendoza KM. An integrated and comparative genetic map of the turkey genome. Cytogenet Genome Res. 2007;119:113–126. doi: 10.1159/000109627. [DOI] [PubMed] [Google Scholar]
- Romiguier J, Ranwez V, Douzery EJ, Galtier N. Contrasting GC-content dynamics across 33 mammalian genomes: relationship with life-history traits and chromosome sizes. Genome Res. 2010;20:1001–1009. doi: 10.1101/gr.104372.109. [DOI] [PMC free article] [PubMed] [Google Scholar]
- Ruiz-Herrera A, Farre M, Robinson TJ. Molecular cytogenetic and genomic insights into chromosomal evolution. Heredity. 2012;108:28–36. doi: 10.1038/hdy.2011.102. [DOI] [PMC free article] [PubMed] [Google Scholar]
- Schmegner C, Hameister H, Vogel W, Assum G. Isochores and replication time zones: a perfect match. Cytogenet Genome Res. 2007;116:167–172. doi: 10.1159/000098182. [DOI] [PubMed] [Google Scholar]
- Shetty S, Griffin DK, Graves JAM. Comparative painting reveals strong chromosome homology over 80 million years of bird evolution. Chromosome Res. 1999;7:289–295. doi: 10.1023/a:1009278914829. [DOI] [PubMed] [Google Scholar]
- Shibusawa M, Nishibori M, Nishida-Umehara C, Tsudzuki M, Masabanda J, Griffin DK, Matsuda Y. Karyotypic evolution in the Galliformes: an examination of the process of karyotypic evolution by comparison of the molecular cytogenetic findings with the molecular phylogeny. Cytogenet Genome Res. 2004;106:111–119. doi: 10.1159/000078570. [DOI] [PubMed] [Google Scholar]
- Skinner BM, Griffin DK. Intrachromosomal rearrangements in avian genome evolution: evidence for regions prone to breakpoints. Heredity. 2012;108:37–41. doi: 10.1038/hdy.2011.99. [DOI] [PMC free article] [PubMed] [Google Scholar]
- Smedley D, Haider S, Ballester B, Holland R, London D, Thorisson G, Kasprzyk A. BioMart—biological queries made easy. BMC Genomics. 2009;10:22. doi: 10.1186/1471-2164-10-22. [DOI] [PMC free article] [PubMed] [Google Scholar]
- Stamatoyannopoulos JA, Adzhubei I, Thurman RE, Kryukov GV, Mirkin SM, Sunyaev SR. Human mutation rate associated with DNA replication timing. Nat Genet. 2009;41:393–395. doi: 10.1038/ng.363. [DOI] [PMC free article] [PubMed] [Google Scholar]
- Tyekucheva S, Makova KD, Karro JE, Hardison RC, Miller W, Chiaromonte F. Human-macaque comparisons illuminate variation in neutral substitution rates. Genome Biol. 2008;9:R76. doi: 10.1186/gb-2008-9-4-r76. [DOI] [PMC free article] [PubMed] [Google Scholar]
- Vinogradov AE. Isochores and tissue-specificity. Nucleic Acids Res. 2003;31:5212–5220. doi: 10.1093/nar/gkg699. [DOI] [PMC free article] [PubMed] [Google Scholar]
- Webster MT, Axelsson E, Ellegren H. Strong regional biases in nucleotide substitution in the chicken genome. Mol Biol Evol. 2006;23:1203–1216. doi: 10.1093/molbev/msk008. [DOI] [PubMed] [Google Scholar]
- Webster MT, Hurst LD. Direct and indirect consequences of meiotic recombination: implications for genome evolution. Trends Genet. 2012;28:101–109. doi: 10.1016/j.tig.2011.11.002. [DOI] [PubMed] [Google Scholar]
- Xi HL, Shulha HP, Lin JM, et al. (13 co-authors) Identification and characterization of cell type-specific and ubiquitous chromatin regulatory structures in the human genome. PLoS Genet. 2007;3:e136. doi: 10.1371/journal.pgen.0030136. [DOI] [PMC free article] [PubMed] [Google Scholar]
Associated Data
This section collects any data citations, data availability statements, or supplementary materials included in this article.