

Abstract
Hepatocellular cancer is a serious human disease with an unfortunately low survival rate. It further poses a significant epidemic threat to our society through its viral vectors associated with cirrhosis conditions preceding the cancer. A search for biomarkers of these diseases enlists analytical glycobiology, in general, and quantitative biomolecular mass spectrometry (MS), in particular, as valuable approaches to cancer research. The recent advances in quantitative glycan permethylation prior to MALDI-MS oligosaccharide profiling has enabled us to compare the glycan quantitative proportions in the small serum samples of cancer and cirrhotic patients against control individuals. We were further able to fractionate the major serum proteins from the minor components and compare statistically their differential glycosylation, elucidating some causes of quantitatively unusual glycosylation events. Numerous glycan structures were tentatively identified and connected with the origin proteins, with a particular emphasis on sialylated and fucosylated glycans.
Keywords: glycomics, hepatocellular carcinoma, permethylation, immunoaffinity fractionation, MALDI-TOF MS, glycans
Introduction
During the recent years, advances in glycomics have started to attract the attention of the laboratories with interest in the roles of glycoproteins, glycolipids and large proteoglycan molecules involved in immune system responses, inflammation, and disease development and control. While various glycomic investigations may involve different techniques and approaches,1 mass spectrometry (MS) now plays a very essential role in solving the structural aspects of the glycobiology field. Quantitative glycomic profiling at high sensitivity has become particularly feasible through the use of complete glycan permethylation2–6 in conjunction with MALDI/MS.
In relation to the search for putative glycan disease biomarkers, it is essential to display numerous structures in the oligosaccharide profile obtained from relevant biological materials, such as biological fluids or tissue extracts. The solid-phase permethylation approach,5;6 combined with MS, is generally inclusive of the oligosaccharide structures up to approximately 5000 mass units, which include both the neutral and sialylated glycans. Moreover, permethylation enhances the sensitivity of MS measurements when compared to the unmodified sugars. In the recent studies by this research group,5–7 these methodological improvements have made it feasible to profile glycans in the samples of blood sera of microliter volumes. While quantitative glycomic profiling of the serum glycoprotein mixtures appears to hold potential for diagnostic and prognostic measurements in cancer,8–11 these comparative analytical procedures also have a great promise to identify the source proteins associated with the aberrant glycosylation which may be typical for the presence of cancer or a state of malignancy. This report deals with the preliminary stages of such an inquiry for hepatocellular carcinoma (HCC), which we and other groups8;9;12;13 previously assessed in terms of the glycan structures alone.
Human blood serum is a rich source of glycoproteins for glycomic and glycoproteomic analyses pertaining to different states-of-health of individuals. As the physiological fluids perfuse different tissues, blood carries thousands of proteins, including those that can originate from tumor cell surfaces and are shed into the bloodstream.14 Additionally, proteins from tumor cells that may have ruptured could also enter the circulatory system. Detecting diagnostically interesting glycoproteins has become a very active research area in the quest for new and better disease indicators. With blood serum being widely considered as a convenient fluid for cancer research investigations, we have developed glycomic and glycoproteomic methodologies which consume only microliter volumes.
The large dynamic range of proteins in blood serum represents a major methodological problem. While over 95% of the total protein mass in serum is due to roughly 20 proteins, significant effort must be exerted to detect certain trace proteins14 that may be diagnostically important. In order to simplify the task of evaluating both the major and minor proteins for their unusual glycosylation, we employed a widely available immunoaffinity/depletion column (as do many other investigators) as the first necessary step to overcome the problems of the large concentration range. We then further investigated the different fractions for their respective glycosylation patterns.
In relation to a disease condition, we must also consider yet another problem, the so-called acute-phase response, to assess quantitatively a protein biosynthetic change/glycosylation. Many of the proteins synthesized by the liver and secreted into the bloodstream may act as either positive (enhanced concentrations) or negative (lower concentration) responders to a stress (inflammatory response or injury) placed on the system.15;16 Often, in association with chronic inflammation, cancer may also induce an acute-phase response.15;16 Because many of the highly-abundant serum proteins are knows to be both glycosylated and act as the acute-phase proteins, some of the measured, overall glycomic changes could be due to such a biochemical response.
In this investigation, we first subjected a total of 90 serum samples (30 each from disease-free individuals, patients diagnosed with cirrhosis, and patients suffering from HCC) to immunoaffinity depletion, resulting in two fractions. The bound fraction contained seven most highly-abundant proteins (albumin, IgG, IgA, haptoglobin, α1-antitrypsin, and fibrinogen). In this fraction, haptoglobin, α1-antitrypsin, and fibrinogen are thought to act as positive acute-phase glycoproteins, while transferrin responds as a negative acute-phase actor. The flow-through fractions, for all samples in comparison, should contain all remaining (trace) serum proteins. Each fraction was then glycomically profiled using a slight modification of our previously published protocol.5;7
The glycomic profiles and their individual components were then subjected to a series of statistical tests, while the oligosaccharide analytical results were correlated to those obtained in our previous serum glycomic study of cirrhosis and HCC8;9;13 and the results of other laboratories.12;17–19 For a plethora of cancerous conditions, some altered glycosylation patterns were previously reported.10;11;17;20–24 It has been suggested that increased levels of α 1,3-linked fucosylation of complex glycans represents a key change in HCC,25;26 whereas increased levels of core fucosylation associated with bisecting glycans may distinguish patients diagnosed with cirrhosis from those suffering from HCC.19
Experimental
Materials
Sodium hydroxide beads, β-mercaptoethanol, and methyl iodide were purchased from Sigma Chemical Co. (St. Louis, MO). Sodium dodecyl sulfate (SDS) was acquired from Bio-Rad Laboratories (Hercules, CA) and Nonidet P40 was received from Roche Diagnostics (Indianapolis, IN). The spin columns that were used for sample purification, graphitized carbon and C18, were products of Harvard Apparatus (Holliston, MA). The MALDI matrix, 2,5-dihydroxybenzoic acid (2,5-DHB), was a acquired from Alfa Aesar (Ward Hill, MA) and N-Glycanase F (PNGase F) was purchased from Northstar Bioproducts (East Falmouth, MA). Water (HPLC-grade) and trifluoroacetic acid (TFAA) were obtained from EMD Chemicals, Inc. (Gibbstown, NJ), while HPLC-grade acetonitrile (ACN), chloroform, and dimethylsulfoxide (DMSO) came from Malllinckrodt Baker (Phillipsburg, NJ).
Sample Collection
In this study, patients that had been diagnosed with HCC and disease-free individuals were enrolled in a study initially conducted at the National Cancer Institute of Cairo University, Egypt, from 2000 to 2002. Briefly, adults (aged 17 and older) that were previously diagnosed with HCC and those without a prior history of cancer were eligible to participate in the original study. The presence of HCC was confirmed by pathology, cytology, imaging (both CT and ultrasound), and elevated levels of serum AFP. Individuals free of liver disease were recruited from the orthopedic department of Kasr El-Aini Faculty of Medicine at Cairo University and blood serum samples acquired from these individuals were used as control samples. Samples from the patients diagnosed with liver cirrhosis, and confirmed by biopsy, were acquired during the sample time period from the Ain Shams University Specialized Hospital and the Tropical Medicine Research Institute, Cairo, Egypt.
Blood samples were collected by a trained phlebotomist each day at around 10 a.m. and processed within a few hours according to a standardized protocol. Aliquots of sera were frozen immediately after collection and stored at −80 °C until the time of analysis.
Immunoaffinity Fraction of Serum Samples
The Agilent Multiple Affinity Removal System (MARS) column (Agilent Technologies, Palo Alto, CA) was utilized in this study to separate the seven most highly-abundant proteins (albumin, IgG, α1-antitrypsin, IgA, transferrin, haptoglobin, and fibrinogen) from the proteins in blood serum present in lower quantities. Aliquots of blood serum (25 μL) were first diluted to 100 μL using buffer A, a proprietary buffer recommended by the manufacturer and then filtered using a low-retention 0.22 μm filter. The samples were then injected onto the column and the flow-through fractions, containing the lower-abundance proteins were collected. The highly-abundant proteins were eluted from the column using the proprietary buffer B and these proteins were also collected. Each fraction was then buffer-exchanged and desalted into HPLC-grade water using 5,000 Da molecular-weight cutoff filters and completely dried.
Release and Purification of the N-linked Glycans
Prior to the release of the N-linked glycans, the dried protein samples were resuspended in a 50-μL aliquot of a buffer (pH = 7.5) composed of 10 mM sodium phosphate/0.1% SDS/0.1% β-mercaptoethanol. The proteins were then simultaneously denatured and reduced by heating samples to 60 °C for 45 min. After allowing the samples to cool to room temperature, a 5-μL aliquot of Nonidet P-40 was added. Following a 10-min equilibration period, a 5-mU aliquot of PNGase F was added and the digestion was allowed to proceed for 18 h at 37 °C.
Following the enzymatic digestion, the liberated N-linked glycans were purified by a two-step solid-phase extraction procedure utilizing first C18 microspin column, followed by activated graphitized carbon microspin columns. Both media were first conditioned with three aliquots, 400 μL each, of a solution composed of 85%/15%/0.1% ACN/water/TFAA (solution B) and then re-equilibrated with three aliquots, 400 μL each of a 95%/5%/0.1% water/ACN/TFAA solution (solution A). Following re-equilibration of the C18 media, used to remove proteins, detergents, and other hydrophobic materials, the samples were diluted to 200 μL with buffer A and applied to the spin column. After centrifugation, the samples were reapplied and centrifuged again. The medium was then washed with a 200-μL aliquot of buffer A to ensure a high recovery of the glycans, which were not retained by the stationary phase. The samples were then further purified and desalted by activated graphite spin columns. The samples were applied to the medium a total of three times and washed twice with 300-μL aliquots of buffer A. The retained glycans were then eluted by a 200-μL aliquot of a 25%/75%/0.1% ACN/water/TFAA solution (solution C) and centrifuged. A second 100-μL aliquot of solution C was then added, followed by centrifugation. The samples were then completely dried in a vacuum centrifuge.
Solid-phase Permethylation
The N-linked glycans derived from the glycoproteins present in blood serum samples were permethylated statically, in a slight modification to our previously published methods that utilized flow.5;6 Briefly, spin-column reactors were prepared by loading empty microspin columns (Harvard Apparatus, Hollister, MA) with sodium hydroxide beads that had been suspended in ACN. The reactors were thoroughly washed with DMSO prior to the application of the samples. The dried N-linked glycan samples were resuspended in a reaction solution composed of 60 μL of DMSO, 44.8 μL of methyl iodide, and 2.4 μL of water. The samples were then applied to each reactor and allowed to react for 15 min. In this method, the samples were not centrifuged to generate flow, unlike in our previous methods. After 15 min, the samples were centrifuged and a second 44.8-μL aliquot of methyl iodide was added and the samples were reapplied to the reactors for a second 15-min reaction period. The samples were then centrifuged and the reactors were washed with two 100-μL aliquots of ACN. The permethylated N-linked glycans were recovered from the permethylation reaction solution by liquid/liquid extraction using chloroform and repeatedly washed with 0.5 M NaCl and HPLC-grade water. Following the extraction, the chloroform layer containing the permethylated N-linked glycans was dried in a vacuum centrifuge.
Mass-spectral Analysis
All mass-spectral measurements in this study were performed on an Applied Biosystems 4800 MALDI TOF/TOF instrument (Applied Biosystems, Foster City, CA) equipped with a frequency-tripled Nd:YAG laser operating at 355 nm. The MALDI matrix used in this study was 2,5-dihydroxybenzoic acid and was prepared at 10 mg/ml in 50%/50% water/methanol with 1 mM sodium acetate to ensure complete cationization. The samples were resuspended in 5 μL of 50%/50% water/methanol and a 0.5-μL aliquot was spotted on a stainless steel MALDI target plate and mixed with an equal volume of the matrix solution and dried under vacuum to generate a layer of fine, uniform crystals. The instrument was operated in its positive-ion mode and the m/z range from 1400–5000 was monitored. A total of 4000 laser shots were applied to each sample spot and each sample was analyzed automatically by the instrument in its “batch mode” of operation.
Data Processing and Statistical Analysis
The resulting data were baseline-corrected, a noise filter was applied, and the files were exported as text files using Data Explorer (version 4.0), a software tool included with the instrument's operating software. Normalization of the data was performed using an in-house developed software tool. Normalization was performed by first summing the intensities of all glycans of interest and dividing the intensity of the signal associated with each ion by the sum of the total intensity.
The normalized data were then subjected to a series of statistical tests to determine diagnostic potential of the acquired N-linked glycomic profiles. First, a principal component analysis (PCA) was performed on the raw MALDI data using MarkerView (Applied Biosystems, Foster City, CA). Supervised PCA methods were used, employing a prior knowledge of the pathological condition of the sample. In this analysis, the peak intensities were scaled using the Pareto option, where the average value is subtracted from each value and the difference is divided by the square root of the standard deviation. This prevents analytes resulting in the highest mass-spectral intensities from dominating the analysis. Next, Microsoft Excel was used to perform a single-variable analysis of variance (ANOVA) test. In this study, the data sets were considered to be statistically different only if the resulting p-value was less than 0.05, meaning the observed changes had a 5% chance of being randomly significant. Those glycans passing the ANOVA test were then subjected to a receiver operating characteristics (ROC) test and its associated area-under-the-curve (AUC) value was calculated using Origin 8 (OriginLab Corporation, Northampton, MA). A ROC test plots the sensitivity (or the true-positive rate) against the 1-specificity, or the false-positive rate. The resulting AUC value may range from 0–1, where 0 is a perfectly negative test for the condition and 1 is a perfectly positive test. Arbitrary guidelines have been assigned for all remaining values. AUC values ranging from 0.9–1 and 0–0.1 were considered highly accurate and values between 0.8–0.9 and 0.1–0.2 were deemed accurate. If the AUC value was between 0.7–0.8 or 0.2–0.3, the test was thought of as only moderately accurate. If the AUC value fell between 0.5–0.7 or 0.3–0.5, the test was considered uninformative. Finally, the variation of the data associated with each group was expressed as the standard error of the mean (SEM) to account for the sample size, possibly providing a better view of the data dispersion by minimizing the effects of biochemical individuality associated with rather limited sample sets.
Results
In this study, we have utilized a commercially-available immunoaffinity-depletion column to fractionate blood serum proteins into a pool consisting of the top seven most highly-abundant proteins and a fraction containing the remaining, lesser-abundant proteins. In the highly-abundant protein fraction, six of the seven proteins are glycosylated (of these, only albumin is not a glycoprotein) and four are glycoproteins synthesized by the liver (α1-antitrypsin, transferrin, haptoglobin, and fibrinogen) which may act as acute-phase proteins. Of these acute-phase proteins, only transferrin acts as a negative acute-phase protein, i.e., it is down-regulated during an immune response or inflammatory response by the liver.15 Since cancer often induces an acute-phase response,16 it seemed plausible to deplete the most-highly abundant proteins prior to glycomic analysis in order to study those glycans associated with the glycoproteins present in lower abundances in order to by-pass some of the changes between the different sample groups that could be expected to be the result of an acute-phase response.
Preliminary Observations on N-linked Glycomic Profiles: Highly-abundant vs. Lesser-abundant Protein Fractions
Comparing the glycomic profiles for the N-linked glycans derived from the glycoproteins present in the serum of a single patient that had been subjected to immunoaffinity-depletion fractionation, the overall profiles for each fraction may appear somewhat similar in respect to the most intense m/z signals. However, significant differences were observed for many of the lower-intensity ions. A representative MALDI-TOF mass spectrum for each fraction is presented as Figure 1a and b for the highly-abundant protein fraction (those proteins retained by the depletion column) and the lesser-abundant fraction (or the flow-through fraction), respectively. In total, approximately 55 unique glycan compositions were detected in each fraction, with the majority being present in both. Both spectra were dominated by an ion present at m/z 2792.2, which is the result of a biantennary-disialylated glycan. While the fraction containing the highly-abundant proteins contained many neutral glycans, which resulted in moderately intense signals in the m/z range from approximately 1750–2500, this same range in the depleted fraction was noticeably altered. Many of those same glycans were either absent or gave rise to very weak signals. For example, the glycan observed at m/z 1835.9 possessed an average relative intensity of nearly 8% in the highly-abundant protein fraction (for the 30 disease-free samples) and only a relative intensity of approximately 0.1% in the depleted fraction. This observation is expected, since this particular glycan is known to be associated with IgG. Based on previous proteomic experiments with depleted human blood serum, we generally observe the highly-abundant proteins in the depleted fraction, since the depletion is reproducible, but not quantitative. Therefore, we believe that the presence of the glycan at m/z 1835.9 (along with other expected IgG-associated glycans), may be at least partly due to trace amounts of IgG in the lesser-abundant protein fraction, though it may also be possible for these glycans to be associated with other trace-level glycoproteins. Conversely, many trace-level glycans that were observed in the high m/z range (defined as those above m/z greater than ca. 4000) were present in greater relative abundance in the flow-through fraction (compare Figure 1a and b). The relative intensities of the glycans present in this region of the spectra were increased from ca. 1.4 to 4.5 times in the lesser-abundant protein fraction for the 30 disease-free samples. A tetraantennary-tetrasialylated glycan was observed to have the greatest increase in relative abundance. See Tables 1 and 2 for the glycans that passed statistical tests for the bound (representing the highly-abundant proteins) and the unbound, or lesser-abundant proteins, respectively. Table S1 of the supplemental data presents the remaining glycans identified in this study that were not indicative of the state-of-health of a sample.
Figure 1.

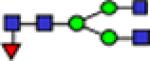
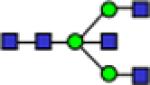
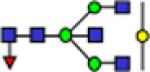
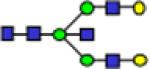
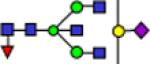
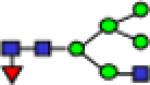
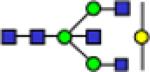
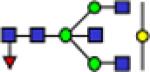
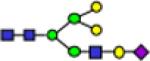
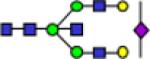
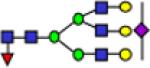
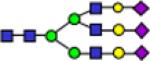
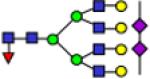
Representative MALDI-TOF MS spectra for the N-linked glycomic analysis of (a) the highly-abundant protein fraction; and (b) the lesser-abundant protein fraction. The symbols in this figure are: blue square, N-acetylglucosamine; green circle, mannose; yellow circle, galactose; purple diamond, sialic acid; red triangle, fucose.
Table 1.
Glycans from the bound fraction (highly-abundant proteins) that were capable of diagnosing a patient's state-of-health. Also included are the p-values and area-under-the-curve (AUC) values.
| Bound Fraction | |||||||||||
|---|---|---|---|---|---|---|---|---|---|---|---|
| NC | QT | HCC | NC vs QT | NC vs HCC | |||||||
| AVG Rel Int | SEM | AVG Rel Int | SEM | AVG Rel Int | SEM | P-value | AUC | P-value | AUC | ||
| 1835.8 |
|
7.77 | 0.71 | 9.30 | 0.60 | 14.07 | 1.12 | 0.106 | 0.620 | 1.42E-05 | 0.810 |
| 1906.9 |
|
0.65 | 0.06 | 0.68 | 0.05 | 1.30 | 0.12 | 0.726 | 0.554 | 1.45E-05 | 0.839 |
| 2040.0 |

|
6.99 | 0.31 | 9.36 | 0.37 | 8.34 | 0.37 | 7.32E-06 | 0.828 | 0.00688 | 0.697 |
| 2081.1 |

|
1.51 | 0.15 | 2.35 | 0.15 | 3.03 | 0.30 | 7.48E-04 | 0.757 | 3.29E-05 | 0.800 |
| 2110.9 |

|
0.61 | 0.04 | 0.75 | 0.03 | 0.97 | 0.06 | 0.00856 | 0.692 | 5.21E-06 | 0.822 |
| 2244.1 |

|
2.89 | 0.23 | 4.15 | 0.21 | 2.69 | 0.19 | 1.54E-04 | 0.800 | 0.514 | 0.472 |
| 2285.2 |
|
1.58 | 0.09 | 2.69 | 0.13 | 2.29 | 0.13 | 3.12E-09 | 0.908 | 2.54E-05 | 0.800 |
| 2314.9 |
|
0.28 | 0.01 | 0.38 | 0.01 | 0.34 | 0.02 | 1.09E-06 | 0.822 | 0.00534 | 0.696 |
| 2431.2 |
|
5.28 | 0 26 | 3.50 | 0.17 | 3.34 | 0 19 | 2.97E-07 | 0.144 | 9.91E-08 | 0.138 |
| 2489.3 |

|
0.56 | 0.03 | 0.75 | 0.03 | 0.63 | 0.03 | 3.51E-06 | 0.824 | 0.0573 | 0.633 |
| 2646.3 |
|
0.55 | 0.03 | 0.60 | 0.02 | 0.86 | 0.05 | 0.182 | 0.621 | 1.68E-06 | 0.827 |
| 2792.4 |
|
28.33 | 0.92 | 24.18 | 0.83 | 19.01 | 1.21 | 0.00144 | 0.274 | 8.64E-08 | 0.140 |
Table 2.
Glycans from the flow-through fraction (lesser-abundant proteins) that were capable of diagnosing a patient's state-of-health. Also included are the p-values and area-under-the-curve (AUC) values.
| Flow-through Fraction | ||||||||||||
|---|---|---|---|---|---|---|---|---|---|---|---|---|
| NC | QT | HCC | NC vs QT | NC vs HCC | ||||||||
| m/z | AVG Rel Int | SEM | AVG Rel Int | SEM | AVG Rel Int | SEM | P-value | AUC | P-value | AUC | ||
| 1835.8 |

|
1835.8 | 0.124 | 0.009 | 0.141 | 0.013 | 0.408 | 0.062 | 0.3 | 3.13E-05 | 0.884 | |
| 1906.9 |

|
1906.9 | 0.056 | 0.006 | 0.046 | 0.005 | 0.115 | 0.020 | 0.173 | 0.0063 | 0.800 | |
| 1998.9 |
|
1998.9 | 0.078 | 0.005 | 0.084 | 0.006 | 0.114 | 0.008 | 0.45 | 0.588 | 2.45E-04 | 0.818 |
| 2040.0 |

|
2040.0 | 0.117 | 0.008 | 0.159 | 0.015 | 0.308 | 0.042 | 0.0163 | 0.678 | 3.16E-05 | 0.872 |
| 2081.1 |

|
2081.1 | 0.023 | 0.004 | 0.023 | 0.003 | 0.101 | 0.017 | 0.918 | 5.79E-05 | 0.872 | |
| 2110.9 |
|
2110.9 | 0.059 | 0.007 | 0.057 | 0.005 | 0.133 | 0.014 | 0.75 | 1.69E-05 | 0.882 | |
| 2186.1 |
|
2186.1 | 0.458 | 0.042 | 0.722 | 0.031 | 0.686 | 0.045 | 5.47E-06 | 0.827 | 5.41E-04 | 0.754 |
| 2244.1 |

|
2244.1 | 0.350 | 0.023 | 0.471 | 0.021 | 0.732 | 0.133 | 2.78E-04 | 0.767 | 0.00653 | 0.800 |
| 2285.2 |
|
2285.2 | 0.073 | 0.006 | 0.105 | 0.008 | 0.236 | 0.028 | 0.0024 | 0.740 | 5.01E-07 | 0.920 |
| 2314.9 |

|
2314.9 | 0.049 | 0.005 | 0.065 | 0.004 | 0.110 | 0.011 | 0.0267 | 0.736 | 4.10E-06 | 0.889 |
| 2390.2 |
|
2390.2 | 0.490 | 0.043 | 0.811 | 0.035 | 0.785 | 0.046 | 3.07E-06 | 0.883 | 1.77E-05 | 0.785 |
| 2472.2 |

|
2472.2 | 0.058 | 0.006 | 0.061 | 0.003 | 0.095 | 0.008 | 0.627 | 0.633 | 4.20E-04 | 0.801 |
| 2605.3 |

|
2605.3 | 1.915 | 0.121 | 2.691 | 0.120 | 3.927 | 0.341 | 2.86E-05 | 0.810 | 6.97E-07 | 0.842 |
| 2676.3 |
|
2676.3 | 0.152 | 0.006 | 0.184 | 0.009 | 0.239 | 0.016 | 0.00455 | 0.702 | 3.54E-06 | 0.846 |
| 2792.4 |
|
2792.4 | 42.184 | 0.582 | 43.585 | 0.694 | 34.900 | 0.818 | 0.127 | 0.619 | 1.08E-09 | 0.089 |
| 3054.5 |
|
3054.5 | 0.444 | 0.015 | 0.558 | 0.016 | 0.825 | 0.045 | 3.27E-06 | 0.835 | 1.38E-07 | 0.954 |
| 3211.6 |

|
3211.6 | 0.540 | 0.026 | 0.556 | 0.028 | 0.831 | 0.066 | 0.691 | 0.532 | 9.14E-07 | 0.852 |
| 3415.7 |

|
3415.7 | 0.611 | 0.035 | 0.615 | 0.041 | 1.174 | 0.087 | 0.939 | 0.480 | 1.28E-07 | 0.884 |
| 3602.8 |
|
3602.8 | 9.121 | 0.621 | 7.226 | 0.376 | 5.759 | 0.435 | 0.0114 | 0.327 | 4.18E-05 | 0.200 |
| 3864.9 |
|
3864.9 | 0.395 | 0.019 | 0.339 | 0.013 | 0.553 | 0.032 | 0.0206 | 0.327 | 9.14E-05 | 0.809 |
Principal Component Analysis
As the first test to observe changes between the different sample sets, the resulting N-linked glycan profiles were subjected to a principal component analysis (PCA). Principal component analysis is a chemometric tool employed to distinguish different sample sets based on a series of orthogonal (and therefore unrelated) principal components. Each principal component visualizes the variance associated with each sample.
The plots for the PCA analysis of the highly-abundant and lesser-abundant protein fractions are given as Figure 2a and b, respectively. In both fractions, the N-linked glycomic profiles resulted in separation of the HCC sample set from the disease-free and cirrhosis sample sets in the first principal component, suggesting that the HCC profiles were significantly different from the other two states-of-health. The disease-free and cirrhosis sample sets overlapped in the first principal component for both fractions, but were separated in the second principal component, suggesting that only subtle, yet important differences were detectable between these two sample sets.
Figure 2.

PCA plots resulting from the glycan profiles for: (a) the highly-abundant protein fraction; and (b) the lesser-abundant protein fraction.
Total Intensity Differences between Different Glycan Classes
In order to gain a deeper insight into the nature of the possible changes that were indicated by the PCA plots, the N-linked glycans used in this study were classified into various subclasses that included the high-mannose, non-fucosylated neutral, fucosylated neutral, bisecting, fucosylated complex sialylated, complex sialylated, total complex sialylated (including fucosylated structures), and fucosylated complex sialylated subclasses. Notched-box plots depicting the results of these analyses are given as Figure 3a–g for the highly-abundant protein fraction and Figure 4a–g for the lesser-abundant protein fraction. The data are depicted as notched-box plots since these types of plots indicate that, at 95% confidence, the data sets are statistically different if the notches between sample sets do not overlap.27 After summing the individual intensities for the glycans in each subclass, the resulting notched-box plots in Figure 3 (the highly-abundant protein fraction) indicate that the high-mannose and, interestingly, the total complex sialylated (including fucose) subclasses were not significantly different between the three sample sets. These results were further confirmed by p-values that were greater than 0.05 and AUC values associated with uninformative tests. Significant increases in the total relative intensities for the two diseases were observed for the complex fucosylated, the non-fucosylated neutral, the bisecting, and the fucosylated complex sialylated subclasses. The statistical analyses of these glycan subclasses resulted in p-values less than 0.05 and AUC values that were “moderately accurate” or “accurate.” Conversely, the complex sialylated subclass demonstrated lowered relative abundances for the diseases states and statistical analysis of these subclasses also resulted in p-values less than 0.05 and accurate AUC test values. Interestingly, the total intensity for the complex sialylated and total fucosylated subclasses for cirrhosis were between the disease-free individuals and the HCC patients, suggesting cirrhosis is an intermediate disease. The analysis for the total sialylated glycans subclass did not prove to be diagnostically relevant. It appears that when considering the increase in the relative abundance of the fucosylated complex sialylated subclass coupled with the decrease in the relative abundance in the sialylated subclass, the total complex sialylated subclass was not significantly different between the different sample sets.
Figure 3.


Notched-box plots for the analysis of different glycan subclasses from the highly-abundant protein fraction: (a) high-mannose subclass; (b) bisecting structures; (c) neutral glycans without fucose; (d) fucosylated neutral glycans; (e) fucosylated complex sialylated subclass; (f) complex sialylated (without fucose subclass); and (g) total sialylated (with fucose) subclass. The symbols in this figure are the same as those used in Figure 1.
Figure 4.


Notched-box plots for the analysis of different glycan subclasses from the lesser-abundant protein fraction: (a) high-mannose subclass; (b) bisecting glycan subclass; (c) neutral without fucose subclass; (d) fucosylated neutral subclass; (e) fucosylated, complex sialylated subclass; (f) complex sialylated (without fucose) subclass; and (g) total sialylated (with fucose) subclass. The symbols in this figure are the same as those used in Figure 1.
A similar investigation was conducted for the lesser-abundant protein fraction and many of the trends observed in the highly-abundant protein fraction were also noticed in this fraction as well (see Figure 4a–g). Just as in the highly-abundant protein fraction, no significant differences were observed in the high-mannose subclass or the total sialylated (including fucose) subclass. However, in the analysis of the complex sialylated subclass, the HCC sample set showed a statistically-relevant decrease in abundance, while the samples derived from patients diagnosed with cirrhosis did not. The fucosylated complex sialylated subclass was increased in relative abundance in the lesser-abundant protein fraction for the samples originating from HCC patients. However, for this particular subclass, the cirrhosis sample set was not significantly different from the disease-free samples. When the total complex sialylated subclass was analyzed, an increase in the total relative intensity was observed for the patients diagnosed with HCC, while once more, no significant difference was observed for those diagnosed with cirrhosis.
Changes in Specific Glycan Structures
To further understand the nature of the changes observed for the specific glycan subclasses discussed above, notched-box plots were constructed for the glycans that passed both statistical tests (a p-value less than 0.05 and an AUC value greater than 0.8). Figure 5a–f presents the notched-box plots for a group of glycans derived from glycoproteins in the highly-abundant protein fraction that are mostly specific for the cirrhosis. In these plots, the values for HCC are also included to demonstrate that a certain level of specificity does exist and it is possible to distinguish the two diseases based on an analysis of the N-linked glycans derived from blood serum glycoproteins. From this pool of six glycans, only one, a biantennary-monosialylated structure, passed both statistical tests for both diseases, and was significantly decreased in its relative abundance in both disease states, though a more significant decrease was observed for the HCC samples. The remaining glycans were all neutral and may have originated from IgG. A pool of glycans that are mostly specific for the diagnosis of HCC in the highly-abundant protein fraction is given as Figure 6a–f. A total of seven glycans (including the biantennary-disialylated glycan) from this fraction were able to diagnose HCC. Interestingly, four of these glycans were neutral (also increased in their relative abundance), with their most likely origin being IgG. These four, presumably IgG-derived glycans, were different from those that appeared to be diagnostic for cirrhosis, suggesting a different immune response by the body to the two diseases. The remaining glycan that could be used to diagnose HCC was the biantennary-disialylated glycan, being markedly lowered in its relative abundance relative to the disease-free samples.
Figure 5.


Notched-box plots for glycans derived from proteins from the highly-abundant protein fraction capable of diagnosing cirrhosis. The symbols in this figure are the same as those used in Figure 1.
Figure 6.


Notched-box plots for glycans derived from proteins from the highly-abundant protein fraction capable of diagnosing HCC. The symbols in this figure are the same as those used in Figure 1.
Figure 7a–d presents notched-box plots for the glycans that were significantly different for cirrhosis in the lesser-abundant protein fraction. All four of these glycans were sialylated and increased in their relative abundance. Two of these structures were fucosylated versions of the biantennary-monosialylated glycan and a triantennary-monosialylated glycan. These four glycans were also found to be increased in their relative proportions in HCC, though the structures observed at m/z values of 2186 and 2390 returned only moderately accurate AUC values. For the lesser-abundant fraction from the HCC samples, a total of 11 glycans were found to be significantly different when compared to the disease-free samples. Out of these 11 glycans, five were neutral structures, which are known to be associated with IgG and present at very low relative intensities. One neutral glycan, observed at m/z 2285, also thought to be associated with IgG, possessed a higher relative intensity than the other IgG-associated structures. This particular glycan was found in a relative intensity of 0.35% in the lesser-protein fraction for the disease-free samples and more than 0.7% in the HCC, indicating this structure may be associated with proteins other than IgG. The remaining five glycans were sialylated; two were both sialylated and fucosylated. The sialylated structures, observed at m/z values of 2431, 2792, and 3602 were all decreased in their relative abundance in the HCC samples. (See Figure 8 for the notched-box plots for these glycans.) However, these glycans were not statistically different for the cirrhosis samples. The fucosylated and sialylated glycans, observed at m/z values of 3415 and 3864, were elevated in their relative quantities for the HCC samples and, once again, no significant difference between the disease-free samples and cirrhosis samples was observed.
Figure 7.

Notched-box plots for the glycans derived from proteins from the lesser-abundant protein fraction capable of diagnosing cirrhosis. The symbols in this figure are the same as those used in Figure 1.
Figure 8.


Notched-box plots for the glycans derived from proteins from the lesser-abundant protein fraction capable of diagnosing HCC. The symbols in this figure are the same as those used in Figure 1.
Discussion
Altered glycosylation on the cell surface of tumor cells is one of the hallmarks of cancer. Increased sialylation, in particular the presence of enhanced α2,6-linked sialic acids, along with increased β1,4-GlcNac branching and elevated levels of fucosylation, often times observed as sialyl Lewis × epitopes, are the most common known aberrations to cancer cell surfaces.28 These changes in glycosylation patterns are known to increase the metastatic potential of tumor cells by increasing their mobility and adhesiveness to collagens, while sialyl Lewis × structures are recognized by e-selectin and may increase the invasiveness of certain tumor cells.28 A primary goal for many researchers in the field of glycomics has been to identify altered glycosylation patterns in patients diagnosed with cancer, in hope of being able to identify molecular markers of cancer in its early stages. Because glycoproteins, or their fragments may be shed from the cell surface into the bloodstream, it may be possible to detect changes in small volumes of blood serum using sensitive glycomic techniques. However, many cancers are also associated with the secretion of various cytokines, signaling molecules that can induce an acute-phase response, mimicking the results of chronic inflammation.16 Because many of the acute-phase proteins found in blood serum are also glycoproteins, the observed changes of glycosylation in the patients diagnosed with cancer may at least partly be associated with an acute-phase response.15 In addition, blood serum is dominated by only a handful of highly-abundant proteins; many of these are known to act as acute-phase proteins. Therefore, in an attempt to uncover more specific changes in glycosylation that could be associated with cancer alone, we have first subjected aliquots of blood serum to immunoaffinity fractionation using a commercially available column to remove the seven most abundant proteins. From these proteins (albumin, IgG, IgA, haptoblobin, transferin, α1-antitrypsin, and fibrinogen), only albumin is not glycosylated. With the exception of IgG and IgA, the remaining glycoproteins may act as acute-phase proteins, with fibrinogen, α1-antitrypsin, and haptoglobin acting as positive acute-phase proteins (their concentrations increase during an acute-phase response) and transferrin acting as a negative acute-phase protein (during an acute-phase response, its concentration decreases).15
When comparing the notched-box plots for the various glycan subclasses for the highly-abundant protein fraction and the lesser-abundant protein fraction, many of the same trends were observed in both fractions. Neither fraction showed a significant change in the relative abundance in the high-mannose subclass, while in both fractions, the fucosylated complex subclass was increased in its relative abundance for both disease states, though in the lesser-abundant protein fraction, statistical analysis of the cirrhosis set of samples resulted in only a moderately-accurate AUC value. This increase in fucosylation may hint that an acute-phase response is occurring in both fractions. The increased relative abundance of this subclass in both fractions was attributed mainly to the glycans appearing at m/z values of 1835, 2040, and 2081. These glycans are known to be attached to IgG29 and we have identified them as being increased in both breast10 and prostate11 cancers as well. These glycans most likely were derived from IgG in the less-abundant protein fraction only as the result of an incomplete removal of IgG. However, because of the very low relative intensities of these glycans, we are confident in a highly-efficient removal of the targeted proteins. Similarly for HCC, both fractions showed a decrease with both the complex sialylated (no fucose) and total sialylated subclasses. Analysis of the cirrhosis samples demonstrated that these subclasses were only decreased in their relative abundance in the highly-abundant protein fraction. Alternatively, the fucosylated complex sialylated subclass was elevated in its relative abundance in both fractions for HCC, which is in good agreement with the previously-published reports studying the levels of fucosylated proteins.30–32 This subclass was again elevated for the cirrhosis samples only in the highly-abundant fraction. Interestingly, when comparing the relative intensities for the biantennary-monosialylated glycan (m/z 2431), its relative abundance decreased in both fractions for HCC, while its fucosylated analogue (m/z 2605) was increased. A similar trend was also observed for the biantennary-disialylated structure (m/z 2792) and its fucosylated version (m/z 2966). These results suggest that the complex sialylated structures are being converted to fucosylated structures, possibly as sialyl Lewis × epitopes. Furthermore, this seems to suggest that at least for HCC, even in the lesser-abundant protein fraction, there may still be the effects of an acute-phase response.
The lesser-abundant protein fraction contains both α1-acidic glycoprotein (AGP) and hemopexin, both of which may act as positive acute-phase proteins.15;33 The concentration of AGP has been reported to increase by several fold in patients with chronic inflammation.34 AGP is known to include the biantennary-monosialyled glycan and its fucosylated version along with the biantennary-disialylated glycan and its fucosylated analogue.15 Therefore, it seems plausible that the decrease in the two non-fucosylated structures coupled with the increase in the relative abundance of their fucosylated versions may be partly due to increases in the levels of AGP. Recently, it was reported that AGP levels were elevated in HCC patients, relative to not only control samples, but also to patients diagnosed with cirrhosis.35 Additionally, altered glycosylation of hemopexin has also been examined in HCC patients.18 This study also concluded that fucosylation was increased on many multiply-branched structures, which may partly explain the results we observe in this work. However, the authors' experimental design required an enzymatic removal of the sialic acids, making it impossible to compare the exact structures exhibiting enhanced fucosylation. These results suggest that it may be worthwhile to specifically focus on the altered glycosylation of acute-phase proteins in the lesser-abundant protein fraction.
While significant changes for HCC were observed in both protein fractions, the statistical analyses for various subclasses of glycans did not provide diagnostically relevant information for the cirrhosis sample set in the lesser-abundant protein fraction. We were only able to identify four glycans that were significantly different between the disease-free individuals and the patients diagnosed with cirrhosis. In the bound fraction, we were able to confidently identify five structures that were significantly different between the two sample sets. Most of these diagnostically-useful glycans are likely to originate from IgG. In good agreement with the previously-published data utilizing a DNA sequencer,19 we too identified a fucosylated bisecting biantennary-asialo glycan as being significantly increased in its relative abundance. When comparing the glycans associated with IgG for the two diseases, each disease had four unique glycans that diagnosed a particular condition (m/z 2040, 2244, 2315, and 2489 for cirrhosis, and 1835, 1906, 2081, 2110 for HCC). The glycan yielding a signal at m/z 2285 was characteristic for both diseases. This might suggest that there is a slightly different immune response between cirrhosis and HCC. In addition, an acute-phase response also appears to occur in cirrhosis due to an increase in fucosylated complex sialylated glycans and a decrease in complex sialylated structures without fucose.
Conclusions
The sensitivity of contemporary MS techniques makes it now feasible to detect glycomic changes in very minute amounts and volumes of physiological fluids. An improved comprehensiveness and quantification have further been facilitated through the solid-phase permethylation procedures, which now permit us to profile quantitatively and reliably various samples of clinical interest. During this study, we have continued to assess quantitatively connections of the glycomic changes in health and disease conditions, with the respective glycoprotein constituents of blood serum. The protein-related glycomic changes must be measured and cross-correlated between the conditions such as hepatocellular cancer and its frequent precursor, liver cirrhosis. This is a difficult task in the view of large concentration differences of various serum proteins. It has been, however, demonstrated here that a division of protein fractions prior to their glycomic profiling is a viable strategy even for a simple case of immunoaffinity-based separations. Modulations in the amounts of structurally distinct glycans were seen in both liver cirrhosis and cancer, tentatively a result of their different immunological and acute-phase attributes. Additional functionally- or affinity- based fractionation of serum glycoproteins prior to glycomic analysis by MS profiling appears desirable.
Supplementary Material
Acknowledgments
This work was supported by Grant No. UO1 CA128535-03 from the National Cancer Institute, a component of the National Institutes of Health to M. V. N. and Grant No. RR018942 from the National Center for Research Resources, a component of the National Institutes of Health (NIH-NCRR) for the National Center of Glycomics and Glycoproteomics (NCGG) at Indiana University, directed by M. V. N.
Footnotes
Publisher's Disclaimer: This is a PDF file of an unedited manuscript that has been accepted for publication. As a service to our customers we are providing this early version of the manuscript. The manuscript will undergo copyediting, typesetting, and review of the resulting proof before it is published in its final citable form. Please note that during the production process errors may be discovered which could affect the content, and all legal disclaimers that apply to the journal pertain.
References
- 1.Cummings RD, Pierce JM, editors. Handbook of Glycomics. First ed. Academic Press; London, UK: Burlington, MA, USA: San Diego, CA, USA: 2010. [Google Scholar]
- 2.Hakomori S-I. Biochem. J. 1964;55:205–08. [PubMed] [Google Scholar]
- 3.Ciucanu I, Kerek F. Carbohydr. Res. 1984;131:209–17. [Google Scholar]
- 4.Ciucanu I, Costello CE. J. Am. Chem. Soc. 2003:16213–19. doi: 10.1021/ja035660t. [DOI] [PubMed] [Google Scholar]
- 5.Kang P, Mechref Y, Novotny MV. Rapid Commun. Mass Spectrom. 2008;22:721–34. doi: 10.1002/rcm.3395. [DOI] [PubMed] [Google Scholar]
- 6.Kang P, Mechref Y, Klouckova I, Novotny MV. Rapid Commun. Mass Spectrom. 2005;19:3421–28. doi: 10.1002/rcm.2210. [DOI] [PMC free article] [PubMed] [Google Scholar]
- 7.Alley WR, Jr., Madera M, Mechref Y, Novotny MV. Anal. Chem. 2010;82:5095–106. doi: 10.1021/ac100131e. [DOI] [PMC free article] [PubMed] [Google Scholar]
- 8.Ressom HW, Varghese RS, Goldman L, An Y, Loffredo CA, Hamid MA, Kyselova Z, Mechref Y, Novotny MV, Goldman R. J. Proteome Res. 2008;7:603–10. doi: 10.1021/pr0705237. [DOI] [PMC free article] [PubMed] [Google Scholar]
- 9.Goldman R, Ressom HW, Varghese RS, Goldman L, Bascug G, Loffredo CA, Hamid MA, Gouda I, Ezzat S, Kyselova Z, Mechref Y, Novotny MV. Clin. Cancer Res. 2009;15:1808–13. doi: 10.1158/1078-0432.CCR-07-5261. [DOI] [PMC free article] [PubMed] [Google Scholar]
- 10.Kyselova Z, Mechref Y, Kang P, Goetz JA, Dobrolecki LE, Sledge GW, Schnaper L, Hickey RJ, Malkas LH, Novotny MV. Clin. Chem. 2008;54:1166–75. doi: 10.1373/clinchem.2007.087148. [DOI] [PubMed] [Google Scholar]
- 11.Kyselova Z, Mechref Y, Al-Bataineh MM, Dobrolecki LE, Hickey RJ, Vinson J, Sweeney CJ, Novotny MV. J. Proteome Res. 2007:1822–32. doi: 10.1021/pr060664t. [DOI] [PMC free article] [PubMed] [Google Scholar]
- 12.Lattova E, McKenzie EJ, Gruwel MLH, Spicer V, Goldman R, Perreault H. Rapid Commun. Mass Spectrom. 2009;23:2983–95. doi: 10.1002/rcm.4202. [DOI] [PubMed] [Google Scholar]
- 13.Tang Z, Varghese RS, Bekesova S, Loffredo CA, Hamid MA, Kyselova Z, Mechref Y, Novotny MV, Goldman R, Ressom HW. J. Proteome Res. 2010;9:104–12. doi: 10.1021/pr900397n. [DOI] [PMC free article] [PubMed] [Google Scholar]
- 14.Anderson NL, Anderson NG. Mol. Cell. Proteomics. 2002;1:845–67. doi: 10.1074/mcp.r200007-mcp200. [DOI] [PubMed] [Google Scholar]
- 15.Gornik O, Lauc G. Dis. Markers. 2008;25:267–78. doi: 10.1155/2008/493289. [DOI] [PMC free article] [PubMed] [Google Scholar]
- 16.Arnold JN, Saldova R, Adb Hamid UM, Rudd PM. Proteomics. 2008;16:3284–93. doi: 10.1002/pmic.200800163. [DOI] [PubMed] [Google Scholar]
- 17.Isailovic D, Kurulugama RT, Plasencia MD, Stokes ST, Kyselova Z, Goldman R, Mechref Y, Novotny MV, Clemmer DE. J. Proteome Res. 2008;7:1109–17. doi: 10.1021/pr700702r. [DOI] [PMC free article] [PubMed] [Google Scholar]
- 18.Debruyne EN, Vanderschaeghe D, Van Vlierberghe H, Canhecke A, Callewaert N, Delanghe JR. Clin. Chem. 2010;56:823–31. doi: 10.1373/clinchem.2009.139295. [DOI] [PubMed] [Google Scholar]
- 19.Callewaert N, Van Vlierberghe H, Van Hecke A, Laroy W, Delanghe JR, Contreras R. Nature Medicine. 2004;10:429–34. doi: 10.1038/nm1006. [DOI] [PubMed] [Google Scholar]
- 20.Kirmiz C, Li B, An HJ, Clowers BH, Chew HK, Lam KS, Ferrige A, Alecio R, Borowsky AD, Sulaimon S, Lebrilla CB, Miyamoto S. Mol. Cell. Proteomics. 2007;6:43–55. doi: 10.1074/mcp.M600171-MCP200. [DOI] [PubMed] [Google Scholar]
- 21.Peracaula R, Royle L, Tabares G, Mallorqui-Fernandez G, Barrabes S, Harvey DJ, Dwek RA, Rudd PM, de Llorens R. Glycobiology. 2003;13:227–44. doi: 10.1093/glycob/cwg019. [DOI] [PubMed] [Google Scholar]
- 22.Saldova R, Royle L, Radcliffe CM, Adb Hamid UM, Evans R, Arnold JN, Banks RE, Hutson R, Harvey DJ, Antrobus R, Petrescu SM, Dwek RA, Rudd PM. Glycobiology. 2007;17:1344–56. doi: 10.1093/glycob/cwm100. [DOI] [PubMed] [Google Scholar]
- 23.Barrabes S, Pages-Pons L, Radcliffe CM, Tabares G, Fort E, Royle L, Harvey DJ, Moenner M, Dwek RA, Rudd PM, De Llorens R, Peracaula R. Glycobiology. 2007;17:388–400. doi: 10.1093/glycob/cwm002. [DOI] [PubMed] [Google Scholar]
- 24.Adb Hamid UM, Royle L, Saldova R, Radcliffe CM, Harvey DJ, Storr SJ, Pardo M, Antrobus R, Chapman CJ, Zitzmann Z, Robertson JF, Dwek RA, Rudd PM. Glycobiology. 2008;18:1105–18. doi: 10.1093/glycob/cwn095. [DOI] [PubMed] [Google Scholar]
- 25.Shiraki K, K.Takase K, Tameda Y, Hamada M, Kosaka Y, Nakano T. Hepatology. 1995;22:802–07. [PubMed] [Google Scholar]
- 26.Block TM, Comunale MA, Lowman M, Steel LF, Romano PR, Fimmel C, Tennant BC, London WT, Evans AA, Blumberg BS, Dwek RA, Mattu TS, Mehta AS. Proc. Natl. Acad. Sci. USA. 2005;102:779–84. doi: 10.1073/pnas.0408928102. [DOI] [PMC free article] [PubMed] [Google Scholar]
- 27.McGill R, Tukey JW, Larsen WA. The American Statistician. 1978;32:12–16. [Google Scholar]
- 28.Varki A, Cummings RD, Esko J, Freeze H, Hart G, Marth J, editors. Essentials of Glycobiology. 2nd ed. Cold Springs Harbor Laboratory Press; Cold Springs Harbor: 2009. [PubMed] [Google Scholar]
- 29.Wada Y, Azadi P, Costello CE, Dell A, Dwek RA, Geyer H, Geyer R, Kakehi K, Karlsson NG, Kato K, Kawasaki N, Khoo K-H, Kim S, Kondo A, Lattova E, Mechref Y, Miyoshi E, Nakamura K, Narimatsu H, Novotny MV, Packer NH, Perreault H, Peter-Katalinic J, Pohlentz G, Reinhold VN, Rudd PM, Suzuki A, Taniguchi N. Glycobiology. 2007;17:411–22. doi: 10.1093/glycob/cwl086. [DOI] [PubMed] [Google Scholar]
- 30.Mehta A, Block TM. Dis. Markers. 2008;25:259–65. doi: 10.1155/2008/264594. [DOI] [PMC free article] [PubMed] [Google Scholar]
- 31.Naitoh A, Aoyagi Y, Asakura H. J Gastroenterol Hepatol. 1999;4:436–45. doi: 10.1046/j.1440-1746.1999.01882.x. [DOI] [PubMed] [Google Scholar]
- 32.Comunale MA, Wang M, Hafner J, Krakover J, Rodemich L, Kopenhaver B, Long RE, Junaid O, Bisceglie AMD, Block TM, Mehta AS. J. Proteome Res. 2009;8:595–602. doi: 10.1021/pr800752c. [DOI] [PMC free article] [PubMed] [Google Scholar]
- 33.Delanghe JR, Langlois MR. Clin. Chim. Acta. 2001;312:12–23. doi: 10.1016/s0009-8981(01)00586-1. [DOI] [PubMed] [Google Scholar]
- 34.Turner GA. Clin. Chim. Acta. 1992;208:149–71. doi: 10.1016/0009-8981(92)90073-y. [DOI] [PubMed] [Google Scholar]
- 35.Kang X, Sun L, Guo K, Shu H, Yao J, Qin X, Liu Y. J. Cancer Res. Clin. Oncol. 2010 doi: 10.1007/s00432-010-0762-6. [DOI] [PMC free article] [PubMed] [Google Scholar]
Associated Data
This section collects any data citations, data availability statements, or supplementary materials included in this article.