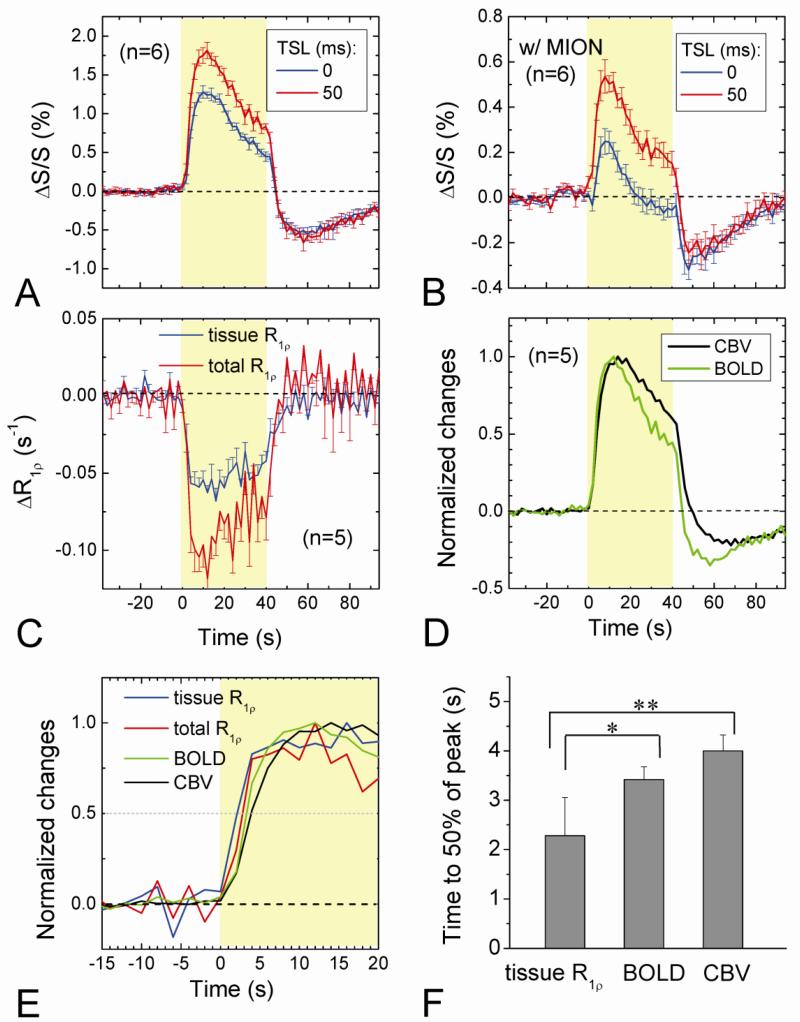
Fig. 3. Dynamic changes in BOLD, T1ρ-weighted fMRI, CBV, and R1ρ without and with MION during visual stimulation.
Averaged time courses of T2-weighted (TSL = 0), T1ρ-weighted fMRI (TSL = 50 ms), and R1ρ change were obtained from the middle cortical ROI during visual stimulation without and with blood signal suppression with MION (A-C). The normalized time courses of BOLD and CBV show a significant undershoot after the stimulus offset (D), unlike those time courses of the two R1ρ responses (C). The BOLD, CBV, total R1ρ (without MION) and tissue R1ρ responses were normalized and their initial rising periods during stimulation were compared in (E). The rising time, defined as the time from the stimulus onset to 50% of the peak change, is faster for the tissue R1ρ than BOLD (p < 0.05, n = 5) and CBV (p < 0.01) responses (F).

