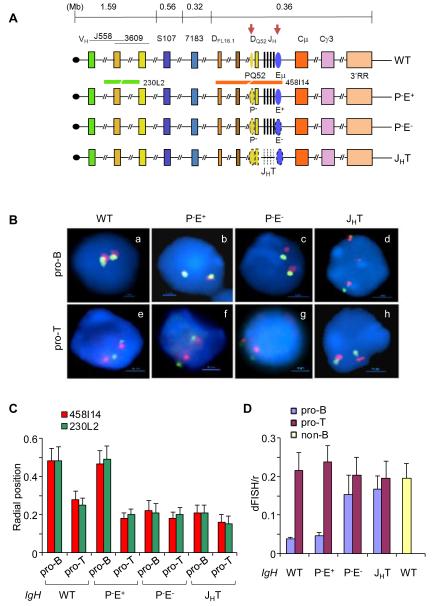
Figure 1. Nuclear positioning and locus contraction of IgH alleles with cis-regulatory sequence deletions.
(A) Top line is a schematic representation of the murine IgH locus. Approximate distances between regions of interest are derived from the sequence of the locus in C57BL6 mouse strain (Johnston et al., 2006). The telomere (black circle)-proximal variable region (VH) spans approximately 2.5Mb and contains 150 VH segments. Gene segments corresponding to J558 and 3609 families are largely interspersed at the 5′ end. The 7183 family lies at the 3′ end of the cluster. The 5′-most and 3′-most diversity (DH) gene segments, DFL16.1 and DQ52, are indicated; between them lie variable numbers of DSP gene segments depending on the mouse strain. JH gene segments are depicted as black vertical lines. Two cis-regulatory elements discussed here, PQ52 and Eμ, are indicated as ovals and are marked by tissue-specific DNase I hypersensitive sites (red arrows). The region containing exons of various IgH isotypes span another 200 kb and is followed by a cluster of DNase I hypersensitive sites that comprise the 3′ regulatory region (3′RR). Next three lines show IgH alleles that carry deletions of specific regulatory sequences (shown by dotted lines) as indicated; IgH genotype notations used in the text are noted on the right. Red and green lines below the WT allele show the position of BAC probes used in FISH analyses.
(B) Two-color FISH using bone marrow pro-B cells (a-d) and thymocytes (e-h) that carry wild-type (WT) or mutated IgH alleles as indicated. BAC probes are indicated in (A) and blue color marks nuclear DNA with DAPI. A representative nucleus from each genotype is shown.
(C) Radial positioning of WT and mutated IgH alleles was determined by measuring the distance of red and green FISH signals from the nuclear boundary in approximately 200 nuclei from pro-B cells and thymocytes of the indicated IgH genotypes. Y axis shows the distance between FISH signals and the nuclear periphery divided by the nuclear radius. Error bars represent the standard deviation between nuclei. The percentage of IgH alleles close to the nuclear periphery in each genotype is shown in Figure S1. (D) Locus contraction of WT and mutated IgH alleles was estimated by measuring the distance between red and green FISH signals in approximately 200 nuclei. Y axis shows the distance between FISH signals divided by the nuclear radius. B lineage-depleted bone marrow cells from RAG2-deficient mice were used as non-B controls. Error bars represent the standard deviation between nuclei. Measurements were made with three independent cell preparations each obtained from 5-6 mice of the indicated genotypes.

