

Abstract
Background
Individuals with bipolar disorder demonstrate abnormal social function. Neuroimaging studies in bipolar disorder have shown functional abnormalities in neural circuitry supporting face emotion processing, but have not examined face identity processing, a key component of social function. We aimed to elucidate functional abnormalities in neural circuitry supporting face emotion and face identity processing in bipolar disorder.
Method
Twenty-seven individuals with bipolar disorder I currently euthymic and 27 healthy controls participated in an implicit face processing, block-design paradigm. Participants labeled color flashes that were superimposed on dynamically changing background faces comprising morphs either from neutral to prototypical emotion (happy, sad, angry and fearful) or from one identity to another identity depicting a neutral face. Whole-brain and amygdala region-of-interest (ROI) activities were compared between groups.
Results
There was no significant between-group difference looking across both emerging face emotion and identity. During processing of all emerging emotions, euthymic individuals with bipolar disorder showed significantly greater amygdala activity. During facial identity and also happy face processing, euthymic individuals with bipolar disorder showed significantly greater amygdala and medial prefrontal cortical activity compared with controls.
Conclusions
This is the first study to examine neural circuitry supporting face identity and face emotion processing in bipolar disorder. Our findings of abnormally elevated activity in amygdala and medial prefrontal cortex (mPFC) during face identity and happy face emotion processing suggest functional abnormalities in key regions previously implicated in social processing. This may be of future importance toward examining the abnormal self-related processing, grandiosity and social dysfunction seen in bipolar disorder.
Keywords: Affective disorders, amygdala, bipolar disorder, face processing, functional magnetic resonance imaging, identity processing, medial prefrontal cortex, morph, self-processing, social processing
Introduction
Bipolar disorder affects at least 1% of the population, is associated with increase in total mortality, and is among the top 10 most debilitating illnesses worldwide (Angst et al. 2002; Murray & Lopez, 1996). A key component of the disorder is emotion dysregulation, which in turn is linked to the more global pattern of abnormal self-referential processing, grandiosity and overall social dysfunction demonstrated by individuals with the disorder (Goswami et al. 2006; McClure-Tone, 2009).
Social processing in general comprises understanding and regulating one’s self, understanding others, or processes that occur at the interface of self and other (Lieberman, 2007). One commonly used method of assessing social processing is through the use of human face stimuli, which serve as ecologically salient stimuli conveying both important identity-related information and salient emotional data. These have been shown to involve overlapping but distinct neural systems (Bruce & Young, 1986; Haxby et al. 2000), both of which occur commonly and frequently at a rapid implicit level in most day-to-day functioning, and are important for supporting successful social interaction (Bruce & Young, 1986; Pelphrey et al. 2007).
The recently proposed National Institute of Mental Health (NIMH) Research Domain Criteria (RDoC) further suggest that social processing is one of the key information-processing domains relevant to understanding etiopathophysiologic processes of major psychiatric illnesses such as bipolar disorder (Insel, 2010; Insel et al. 2010), and studies have demonstrated that euthymic bipolar adults have deficits in components of social processing such as theory of mind (Bora et al. 2005; Malhi et al. 2008). There have been studies of identity processing in other areas of psychopathology (Pelphrey et al. 2007); however, to our knowledge identity processing has not been assessed to date in bipolar disorder.
Examining the neural circuitry supporting both face identity and face emotion processing is therefore one promising way forward to identify neural mechanisms associated with social processing in bipolar disorder. This in turn could serve as a first stage toward elucidating pathophysiologic processes in the disorder to ultimately pave the way for new and personalized treatments for this debilitating psychiatric illness (Phillips, 2007).
Early studies in healthy controls that examined face processing neural circuitry identified the fusiform face area (FFA) as a key neural region supporting face identity and general face processing (Haxby et al. 1994; Farah, 1996; Kanwisher et al. 1997). In parallel, many studies have highlighted the role of the amygdala not only in face emotion processing (Hariri et al. 2002) but also as a region crucial for face identity processing in general (Vuilleumier & Pourtois, 2007; Phillips et al. 2008a). One of the main outputs from the amygdala are cortical midline structures including the ventral prefrontal cortex/orbitofrontal cortex (OFC) and the medial prefrontal cortex (mPFC). These are highly interconnected regions well known from animal and human lesion studies (Bechara et al. 1995; Gallagher et al. 1999) and from human neuroimaging studies (Dannlowski et al. 2007; Phillips et al. 2008a). The mPFC subserves social cognitive processes involved in representing and understanding one’s self and others to support skilled social functioning (Amodio & Frith, 2006). Therefore, it may be that this region bears importance to the altered self-processing seen in bipolar disorder, including grandiosity, poor insight and alterations in self-esteem core to the clinical and diagnostic features of the illness (First et al. 1995a; Jamison, 1995).
The majority of face processing neuroimaging studies in bipolar disorder focused on identification of abnormalities in face emotion processing neural circuitry (Keener & Phillips, 2007; Phillips et al. 2008a) and demonstrated functional abnormalities predominantly in subcortical limbic regions (including the amygdala), the OFC and the mPFC in individuals with the disorder (Phillips et al. 2008a). For example, despite normal scores on tests of face processing (Getz et al. 2003; Chen et al. 2006), many studies showed elevated amygdala and subcortical activity to different facial emotions in bipolar individuals across different mood states to different negative and positive emotional facial expressions (Lawrence et al. 2004; Altshuler et al. 2005; Blumberg et al. 2005; Malhi et al. 2007; Almeida et al. 2010). To date, however, there have been no neuroimaging studies examining neural circuitry supporting face identity or similar social perceptual processing in bipolar disorder. The aim of the present study was therefore to identify the specific nature of functional abnormalities in face identity and face emotion processing neural circuitry, and the wider social sensory neural circuitry, in adults with bipolar disorder. We used a novel task that allowed us to examine neural activity differentiating face identity processing from emerging face emotion processing. Given the novelty of this task, we wanted to avoid possible confounds of mood episode upon findings in bipolar adults (Lawrence et al. 2004), and therefore included only euthymic adults with bipolar disorder currently in remission.
Given previous studies implicating fusiform gyri and amygdala in face identity and face emotion processing, and the mPFC and amygdala in social sensory processing in general, and existing literature indicating abnormally elevated amygdala activity to face emotion in euthymic adults with bipolar disorder relative to healthy adults, we hypothesized that:
-
(1)
(a) All participants would show activity in face identity, face emotion and social processing neural circuitry, specifically in fusiform gyri, amygdala and mPFC. (b) Euthymic bipolar adults would show significantly greater amygdala activity than healthy adults across face emotion and face identity processing.
-
(2)
Euthymic bipolar adults would show abnormally elevated amygdala activity versus healthy adults during emerging face emotion processing.
Given the disrupted social functioning in adults with bipolar disorder, we then wanted to examine the nature of functional abnormalities in fusiform gyral–amygdala–mPFC face identity and social processing neural circuitry specifically during face identity processing in euthymic bipolar adults. We hypothesized that:
-
(3)
Euthymic bipolar and healthy adults would be differentiated by the magnitude of activity in this circuitry during face identity processing. The paucity of existing neuroimaging studies of face identity processing in bipolar disorder did not allow us to make a more specific hypothesis regarding the nature of the between-group differences in activity in this neural circuitry.
Method
Participants
The study was approved by the Institutional Review Board at the University of Pittsburgh. All individuals provided written informed consent before participation. Twenty-seven adults with bipolar disorder, type I (mean age=32.4, S.D.=6.52 years, 10 males, 17 females), diagnosed according DSM-IV criteria and the Structured Clinical Interview for DSM-IV, Research Version (SCID-I/P; First et al. 1995b), participated in the study. All were euthymic and in remission for at least 2 months at the time of scanning, having a Hamilton Depression Rating Scale (HAMD25; Hamilton, 1960) score ≤7 and a Young Mania Rating Scale (YMRS; Young et al. 1978) score ≤10. All had experienced at least two episodes of illness in the past 4 years. Almost all patients were on one or more medications (96.3%, n=26/27); 40.7% of patients were on antidepressant medication (n=11/27), 44.4% on antipsychotic medication (n=12/27), 74.1% on a mood stabilizer (n=20/27), and 11.1% on benzodiazepines (n=3/27).
An age- and gender-matched group of 27 healthy control participants (mean age=31.7, S.D.=8.47 years, 10 males, 17 females) with no previous personal history or family history of psychiatric illness in first- and second-degree relatives participated in the study. All participants were right-handed, native English speakers and gave written informed consent prior to participation. All participants complete the State–Trait Anxiety Inventory (STAI; Spielberger & Vagg, 1984) to measure state anxiety on the day of scanning.
Exclusion criteria for all participants included history of head injury (from medical records and participant report), systemic medical illness, cognitive impairment [score <24 on the Mini-Mental State Examination (MMSE); pre-morbid IQ estimate <85 on the National Adult Reading Test (NART)], Axis-II borderline personality disorder, and general exclusion criteria for magnetic resonance imaging (MRI) (e.g. metallic objects in the body). For healthy adults, current or previous alcohol and illicit substance abuse (determined by SCID-I, saliva and urine screen and history taking) were further exclusion criteria. Bipolar adults were excluded if they had rapid cycling bipolar I disorder (four or more episodes per year) or required immediate and intensive medical attention. Bipolar adults also had to be free from alcohol or substance abuse or dependence for a minimum of 2 months and information was obtained about lifetime co-morbid alcohol or substance abuse or dependence, or lifetime diagnosis of anxiety disorder. Participants were recruited through local advertisements. The participant population reflected the demographics of the patient population of the University of Pittsburgh Medical Center (UPMC). The study protocol was approved by the University of Pittsburgh Institutional Review Board.
Paradigm
Participants completed a 12.5-min Emotion and Identity Dynamic Faces task during functional MRI (fMRI) scanning. Faces from the NimStim stimulus set (Tottenham et al. 2009) were morphed in either an emerging face Emotion or face Identity condition. From each of two end-point images, relevant anatomical landmarks were selected (pupils, inner eyelid) as control points and interval morph transformations were generated between the end-point images to produce a linear continuum between the two end-points within a specialized software. For the emerging emotion conditions, a neutral (0% emotion) face was morphed with an emotional face of the same identity (100% emotion) for each of four emotions: happy, sad, angry, and fearful. For the identity condition, one identity with a neutral expression (0% identity) was morphed with another (100% identity) identity of the same sex and race. These morph images at 5% intervals were then translated into 1-s movies progressing from 0% to 100% morph in which there was one identity changing into another or an emotion emerging from a neutral face. Control trial movies comprised a light gray oval on which a shape (dark oval) was superimposed and subsequently morphed into a larger shape, approximating the temporal and visuospatial complexity displayed by face stimuli, which were also displayed in grayscale of a similar level of contrast.
Participants were asked to use one of three fingers to press a button indicating the color of a semitransparent foreground color flash (orange, blue, or yellow) that appeared during the mid-portion (200–650 ms) of the 1-s presentation of the dynamically changing background face morph. These faces were task irrelevant and, thus, processed by the participants only implicitly (Fig. 1).
Fig. 1.
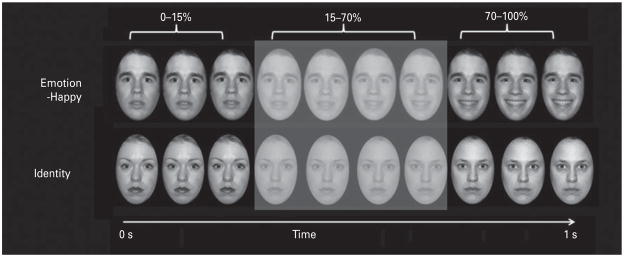
Graphic representation of a task trial. During an emotion and identity dynamic faces functional magnetic resonance imaging (fMRI) task, participants indicate the foreground color appearing during (200–650 ms) the middle of a 1-s presentation of dynamically changing background face morph in either an emotion (angry, fearful, sad, happy) or identity condition. The control task comprised a shape morph approximating the visuospatial complexity of face stimuli.
There were three blocks for each of the above four types of emerging emotion trials, with 12 stimuli per block, three identity blocks, and three shape control blocks, with six stimuli per block. Emotional, identity and control blocks were presented in a pseudo-randomized order so that no two blocks of any condition were presented sequentially. Therefore, a total of 36 stimuli per condition were presented in the task. Our main dependent variables of interest were color labeling accuracy, reaction time, and activity for all face condition blocks.
Data acquisition
Neuroimaging data were collected using a 3.0-T Siemens Trio MRI scanner at the Magnetic Resonance Research Center (MRRC) in the UPMC. Structural three-dimensional (3D) axial magnetization prepared rapid gradient echo (MPRAGE) images were acquired in the same session [repetition time (TR)=2200 ms, echo time (TE)=3.29 ms, flip angle=9°, field of view (FOV)=256×192 mm2, slice thickness=1 mm, matrix=256×256, 192 continuous slices]. Blood oxygen level-dependent (BOLD) images were then acquired with a gradient echo-based echo planar imaging (EPI) sequence during approximately 13 min (378 successive brain volumes) covering 39 axial slices (thickness=3.2 mm, TR=2000 ms, TE=28 ms, FOV=205×205 mm2, matrix=64×64, flip angle=90°).
Data analysis
Demographic, clinical and behavioral data analyses
Between-group differences among demographic and clinical variables were analyzed using independent-samples t tests and non-parametric tests as appropriate (Table 1).
Table 1.
Demographic, clinical variables and behavior performance of bipolar disorder patients currently euthymic (BDe) versus healthy control participants (HC)
| BDe (n=27) | HC (n=27) | p | |
|---|---|---|---|
| Age (years), mean (S.D.) | 31.67 (8.47) | 32.4 (6.52) | 0.72 |
| Gender, n | |||
| Male | 10 | 10 | 1.00 |
| Female | 17 | 17 | 1.00 |
| Age of illness onset (years), mean (S.D.) | 18.11 (6.12) | N.A. (–) | – |
| Illness duration (years), mean (S.D.) | 13.55 (7.72) | N.A. (–) | – |
| HAMD-25, mean (S.D.) | 6.04 (4.5) | 3.91 (4.19) | <0.001* |
| YMRS, mean (S.D.) | 2.15 (2.41) | 1.35 (2.05) | 0.003* |
| STAI, mean (S.D.) | 30.2 (9.17) | 25.8 (6.5) | 0.04* |
| Lifetime presence of co-morbid: | |||
| Anxiety disorder, mean (S.D.) | 23.6 (–) | 0 (N.A.) | – |
| Substance abuse/dependence, mean (S.D.) | 25.5 (–) | 0 (N.A.) | – |
| Antidepressant (On/Off), mean (S.D.) | 0.41 (0.5) | 0 (N.A.) | – |
| Antipsychotic (On/Off), mean (S.D.) | 0.44 (0.22) | 0 (N.A.) | – |
| Mood stabilizer (On/Off), mean (S.D.) | 0.74 (0.37) | 0 (N.A.) | – |
| Anxiolytic (On/Off), mean (S.D.) | 0.11 (0.06) | 0 (N.A.) | – |
| Color labeling accuracy – all faces (emotion and identity), % (n) | 94.6 (8.07) | 95.9 (3.21) | 0.47 |
| Reaction time – all faces (ms), mean (S.D.) | 961.11 (118.6) | 948.56 (135.38) | 0.72 |
| Color labeling accuracy – all emotion faces, % (n) | 94.0 (7.78) | 97.0 (2.76) | 0.07 |
| Reaction time – all emotion faces (ms), mean (S.D.) | 949.5 (136.7) | 955.3 (117.4) | 0.87 |
| Color labeling accuracy – identity faces, % (n) | 94.3 (10.35) | 95.0 (4.35) | 0.73 |
| Reaction time – identity faces (ms), mean (S.D.) | 965.37 (134.15) | 959.08 (122.67) | 0.85 |
HAMD-25, 25-item Hamilton Rating Scale for Depression; YMRS, Young Mania Rating Scale; STAI, State–Trait Anxiety Inventory; S.D., standard deviation; N.A., not applicable.
p<0.05.
Neuroimaging analyses
Data were preprocessed and analyzed using Statistical Parametric Mapping software (SPM5; www.fil.ion.ucl.ac.uk/spm). Data were corrected for differences in acquisition time between slices, spatially normalized into a standard stereotactic space (Montreal Neurologic Institute, MNI), realigned and unwarped, re-sampled to 2×2×2mm3 voxels, and smoothed using a 6-mm full-width at half-maximum (FWHM) Gaussian kernel. Trials were modeled with the canonical hemodynamic response function.
A first-level fixed-effect model was constructed for each experiment in a block-related design. Performance on a shape morph of similar size and visual intensity (as described above) was entered as baseline in the design matrix. Participant movements were entered as covariates of no interest at the individual subject level. To test our hypotheses, the two face conditions were then entered into second-level 2 group (group: healthy adults versus euthymic bipolar adults)×2 face condition [all face emotion (versus shapes), face identity (versus shapes)] ANOVA with the relevant t-contrast images (emotion_baseline, identity_baseline).
To test hypothesis 1, we first examined whole-brain and amygdala region-of-interest (ROI) activity to all face versus shape conditions over all participants (hypothesis 1a). Next, to test hypothesis 1b, we examined the main effect of group upon whole-brain and amygdala ROI activity over both face conditions using the above 2×2 ANOVA model. To test our second and third hypotheses, we examined the group×condition interaction upon whole-brain and amygdala ROI activity, using the above 2×2 ANOVA model followed by post-hoc independent t tests, examining between-group differences in activity to each face condition separately [emotion (versus shapes) or identity (versus shapes)]. Lastly, in exploratory analyses, we examined the main effect of group upon each face emotion condition (angry, fearful, sad, happy) separately using independent t tests.
In the above analyses, neural activity was examined at the whole-brain level in addition to an a priori amygdala ROI as defined in the Wake Forest Toolbox PickAtlas Talairach Daemon template (Maldjian et al. 2003). To control for multiple statistical testing, we maintained a false positive detection rate at p<0.001 for all analyses at the whole-brain level and p<0.05 for a priori amygdala ROI analyses. These were then subjected to a stringent peak-level family-wise error (FWE) multiple-comparison correction at p≤0.05. For regions showing significant between-group differences in activity in the above t-test analyses, we then extracted the BOLD signal to determine the extent to which between-group differences in activity resulted from greater or reduced activity to faces versus shapes in each group.
Relationships between task performance and clinical variables and activity
Relationships between the following measures and extracted BOLD signal in regions showing clusters of activity that differed significantly between groups were performed in bipolar adults using Pearson correlational analyses (continuous variables) or t tests (dichotomous variables): performance accuracy and reaction time for relevant relationships (e.g. neural activity to happy faces and reaction time to happy faces), age, gender, age of bipolar illness onset, bipolar illness duration, subthreshold depression severity (HAMD-25), subthreshold mania severity (YMRS) and state anxiety (STAI). We also examined co-morbid substance abuse and co-morbid anxiety. A problem for all neuroimaging studies of bipolar disorder is the potential confounding effect of psychotropic medication, as it is difficult to recruit medication-free participants into such studies (Phillips et al. 2008b). Thus, activity values that differed between groups, in those taking versus not taking each psychotropic medication class (mood stabilizer, antipsychotic, antidepressant and anxiolytic medications), were compared using independent t tests. Because of the exploratory nature of these correlations, we did not correct for multiple comparisons.
Results
Color and face labeling accuracy
Color labeling accuracy and reaction times for emotion blocks were calculated based on individual subject task performance for an average of the emotion (four emotional face conditions (anger, fearful, sad, and happy) and the identity condition. Overall, task accuracy was high: 95.9%, and 94.6% face color labeling accuracy for healthy adults and bipolar adults respectively. There were no significant group differences in color labeling accuracy for any color or for any individual emotional face condition, nor were there any significant group differences in reaction times. Accuracy for recognizing and identifying face emotion was also tested offine in a separate verification task and there were no significant group differences (Table 1).
Neuroimaging data analyses
Hypothesis 1: Activity to all faces (emotion and identity) versus shapes across all participants and between groups
Activity to all faces versus shapes over both groups
All participants activated the right fusiform gyrus, right occipital gyrus, bilateral amygdala, and left lingual gyrus to all faces to a significantly greater extent than shapes (p<0.05 FWE).
Main effect of group
In examining the main effect of group across both emotion and identity conditions (all faces), one region in the right superior temporal gyrus Brodmann area (BA)21 had a trend toward significance (p=0.086 FWE), as did right-sided amygdala activity in an ROI (p=0.07 FWE); however, there were no regions that demonstrated significant activation that met the significance threshold corrected for multiple comparisons.
Hypotheses 2 and 3: Between-group differences in neural activity for the face identity and face emotion conditions
Group by condition interaction
There was a significant main interaction of group and condition in the right somatosensory cortex BA4 (p=0.006 FWE), with a trend toward effect in the right inferior parietal cortex and precuneus (p=0.06 FWE). An interaction of group by condition using an amygdala ROI revealed significantly greater activity in the bilateral amygdala in euthymic bipolar versus healthy adults. Left-sided activity survived FWE correction for multiple comparisons (p=0.03 FWEcorr). Right-sided activity did not survive the stringent FWE correction (p=0.11 FWEcorr), but passed the less stringent false discovery rate (FDR) correction (p=0.05 FDRcorr) (Table 2). Post-hoc testing demonstrated this left-sided activation to be the result within the emotion condition where the bipolar group had greater activation to emotional faces than did the control group.
Table 2.
Between-group effects for face conditions
| MNI coordinates
|
|||||||||||||
|---|---|---|---|---|---|---|---|---|---|---|---|---|---|
| Analysis | BA | Region | Voxels | Side | x | y | z | T | F | Z value | p uncorrected | p FWE corrected | Effect |
| Activity to all faces (emotion and identity) versus shapes | |||||||||||||
| Across groups, all participants: testing hypothesis 1 a | |||||||||||||
| Whole brain | 37 | Fusiform gyrus | 2970 | R | 40 | −60 | −18 | – | 177.11 | >8 | <0.001 | <0.001 | – |
| 18 | Inferior occipital | 1989 | L | −34 | −84 | −12 | – | 131.74 | >8 | <0.001 | <0.001 | – | |
| Amygdala | 535 | R | 20 | −6 | −16 | – | 44.02 | 5.93 | <0.001 | <0.001 | – | ||
| Amygdala | 415 | L | −18 | −6 | −14 | – | 38.70 | 5.6 | <0.001 | 0.001 | – | ||
| Lingual gyrus | 180 | L | −18 | −46 | −2 | – | 28.90 | 4.9 | <0.001 | 0.02 | – | ||
| Between-group differences: testing hypothesis 1b | |||||||||||||
| Main effect of group | |||||||||||||
| Whole brain | 21 | Superior temporal gyrus | 86 | R | 62 | −12 | −2 | – | 25.19 | 4.6 | <0.001 | 0.086 | |
| Amygdala ROI | Amygdala | 151 | R | 18 | −8 | −14 | – | 10.35 | 2.92 | 0.002 | 0.07 | ||
| Between-group differences in neural activity for the face processing conditions | |||||||||||||
| Interaction of group by face condition | |||||||||||||
| Whole brain | 4 | Somatosensory cortex | 1217 | R | 32 | −20 | 50 | – | 32.63 | 5.19 | <0.001 | 0.006 | Emotion condition with bipolar activating, controls deactivating |
| Amygdala ROI | Amygdala | 113 | L | −28 | 0 | −18 | – | 12.13 | 3.18 | 0.001 | 0.03 | Emotion condition with bipolar activating >controls | |
| Face emotion minus shape: testing hypothesis 2 | |||||||||||||
| Whole brain | 4 | Somatosensory cortex | 660 | R | 32 | −22 | 48 | 5.25 | – | 4.68 | <0.001 | 0.06 | BDe >HC |
| Amygdala ROI | Amygdala | 153 | R | 18 | −6 | −18 | 3.17 | – | 3.02 | 0.001 | 0.04 | BDe >HC | |
| Face identity minus shape: testing hypothesis 3 | |||||||||||||
| Whole brain | 9 | Medial frontal gyrus | 88 | R | 18 | 40 | 22 | 5.30 | – | 4.72 | <0.001 | 0.05 | BDe >HC |
| Amygdala ROI | Amygdala | 92 | R | 20 | −8 | −14 | 3.08 | – | 2.94 | 0.002 | 0.05 | BDe >HC | |
| Individual face emotion condition | |||||||||||||
| Angry | |||||||||||||
| Whole brain | N.A. | – | – | – | – | – | – | – | – | – | – | ||
| Amygdala ROI | N.A. | – | – | – | – | – | – | – | – | – | – | ||
| Fear | |||||||||||||
| Whole brain | 38 | Superior temporal gyrus | 163 | R | 36 | 8 | −20 | 4.89 | <0.001 | 0.02 | BDe >HC | ||
| Amygdala ROI | N.A. | – | – | – | – | – | – | – | – | – | – | ||
| Sad | |||||||||||||
| Whole brain | N.A. | – | – | – | – | – | – | – | – | – | – | ||
| Amygdala ROI | – | Amygdala | 49 | L | −24 | −4 | −26 | 2.96 | 0.002 | 0.04 | BDe >HC | ||
| Happy | |||||||||||||
| Whole brain | 24 | Medial frontal gyrus | 452 | L | −12 | 24 | 28 | 4.61 | <0.001 | 0.05 | BDe >HC | ||
| Amygdala ROI | – | Amygdala | 138 | R | 28 | −2 | −16 | 3.16 | 0.001 | 0.02 | BDe >HC | ||
BA, Brodmann Area; FWE, family-wise error correction for multiple comparisons at the peak voxel; FDR, false detection rate correction for multiple comparisons at the peak voxel; MNI, Montreal Neurologic Institute; ROI, region of interest; BDe, bipolar disorder currently euthymic; HC, healthy controls; N.A., not applicable; L, left; R, right.
To test our main hypotheses 2 and 3, we next performed between-group t contrasts at the whole-brain level and in the amygdala ROI for face emotion and face identity conditions separately.
Face emotion minus shapes
A t contrast performed at the whole-brain level found no between-group difference in activity at FWE corrected significance thresholds, although a region in the right somatosensory cortex (BA4) showed a trend (p=0.06 FWEcorr) for euthymic bipolar disorder adults to show greater activity than healthy adults, who demonstrated deactivation in this region (Table 2).
Amygdala ROI analysis revealed significantly greater activity in the bilateral amygdala in euthymic bipolar versus healthy adults. Right-sided activity survived FWE correction for multiple comparisons (p=0.04 FWEcorr). Left-sided activity did not survive the stringent FWE correction (p=0.08 FWEcorr) but passed the less stringent FDR correction (p=0.025 FDRcorr) (Table 2; Fig. 2a).
Fig. 2.

Between-group comparisons for face processing conditions. (a) Emotion minus shape. Amygdala region-of-interest (ROI) analysis revealed significantly greater bilateral activity in bipolar versus healthy adults with left-sided activation only surviving a less stringent correction for multiple comparisons. The bar graph represents the mean activity in the significant right-sided cluster for adults with bipolar disorder relative to healthy controls. (b) Identity minus shape. Whole-brain between-group t contrast revealed a region in the right medial prefrontal cortex (mPFC) [Brodmann area (BA) 9] where euthymic bipolar showed significantly greater activity than healthy adults who demonstrated deactivation. Amygdala ROI analyses revealed significantly greater right-sided amygdala activity in bipolar relative to the non-significant activation in healthy adults. Bar graphs represents the mean activity in the significant clusters (mPFC, amygdala respectively) for adults with bipolar disorder relative to healthy controls. (c) Happy faces versus shapes. Amygdala ROI analyses demonstrated bipolar relative to healthy adults having significantly greater right amygdala activity. Whole-brain analysis revealed significantly greater activity in bipolar relative to healthy adults in a left medial frontal cluster (BA 24/32) with healthy adults demonstrating deactivation in this region. Bar graphs represent the mean neural activity in the clusters within the respective regions showing activity for adults with bipolar disorder relative to healthy controls.
Face identity minus shapes
A between-group t contrast performed at the whole-brain level revealed a region in the right mPFC (BA 9) where euthymic bipolar showed significantly greater activity than healthy adults (p=0.05 FWEcorr). Here, euthymic bipolar adults showed greater activity in this region whereas healthy adults demonstrated deactivation in this region, relative to shapes (Table 2; Fig. 2b).
Amygdala ROI analyses revealed significantly greater right-sided amygdala activity in euthymic bipolar versus healthy adults, who did not demonstrate significant amygdala activation (p<0.05 FWEcorr) (Table 2) (Fig. 2b).
Group comparisons for individual face emotion conditions
For angry faces versus shapes, there were no significant between-group differences in whole-brain activity. Amygdala ROI analyses demonstrated greater bilateral amygdala activity in bipolar relative to healthy adults (uncorrected p=0.004/p=0.006) that did not survive correction for multiple comparisons on the left and showed a trend for greater activity in bipolar versus healthy adults on the right (p=0.09 FWEcorr) (Table 2).
For fearful faces versus shapes, there was significantly greater activity in bipolar relative to healthy adults in an extended cluster including the right superior temporal gyrus and parahippocampal gyrus (p<0.05 FWEcorr). Amygdala ROI analyses demonstrated greater bilateral activity in bipolar relative to healthy adults, although this was at trend level on the right side (p=0.07 FWEcorr) and did not survive correction on the left (Table 2).
For sad faces versus shapes, there was no significant between-group difference in whole-brain activity. Amygdala ROI analyses revealed significantly greater left amygdala activity in bipolar relative to healthy adults (p<0.05 FWEcorr). Post-hoc analysis revealed this to be the result of activation in bipolar adults with no significant activation in healthy adults (Table 2).
For happy faces versus shapes, there was significantly greater activity in bipolar relative to healthy adults in a right medial prefrontal cortical cluster (BA 24/32) (p<0.05 FWEcorr). Post-hoc analysis revealed this to be the result of significant activation in bipolar adults as opposed to significant deactivation in healthy adults. Amygdala ROI analyses revealed significantly greater right amygdala activity in bipolar adults relative to healthy adults (p<0.05 FWEcorr) (Table 2; Fig. 2c).
Exploratory analyses in bipolar adults
We examined the association of clinical variables with significant between-group differences in activation. Here we found five significant associations. In the all face (emotion+identity) minus shape condition, history of co-morbid anxiety disorder was associated with reduced amygdala activity [t(27)=−2.59, p=0.02]. In the face emotion minus shape condition, history of co-morbid clinical diagnosis of anxiety disorder was associated with reduced amygdala activity [t(27)=2.98, p=0.006]. In the face identity minus shape condition, there were no associations between clinical variables and activation. For the happy face condition, there was a negative correlation between subthreshold depressive severity (as measured by the HAMD-25) and amygdala activity [r(27)=−0.44, p=0.022], whereas use of mood stabilizers was associated with lower (i.e. normalized) mPFC activity [t(27)=2.48, p=0.002]. For the sad face condition, use of mood stabilizers was associated with lower (i.e. normalized) mPFC activity [t(27)=2.48, p=0.002]. There were no significant relationships with any other clinical variables including subthreshold mania severity (YMRS) or state anxiety (STAI).
Discussion
The aim of this study was to examine both face emotion and face identity processing neural circuitry in bipolar disorder, important subprocesses of social processing. Studies to date in bipolar disorder have focused solely on examining face emotion processing, and no study has yet examined neural circuitry supporting face identity processing in individuals with the disorder. Our main findings were threefold.
First, in elucidating the neural circuitry of face processing across both groups, in support of hypothesis 1a we were first able to demonstrate that both face emotion-processing and face identity-processing tasks when contrasted against the baseline of a dynamically moving shape elicited significant activation in bilateral amygdala and ventral occipital regions (hypothesis 1a), including bilateral fusiform gyri, which have been shown to underlie facial processing and object categorization (Kanwisher et al. 1997; Hoffman & Haxby, 2000; Haxby et al. 2002). There was no significant main effect of group when examining amygdala activation (hypothesis 1b), but there was an overall trend level effect toward increased amygdala activation in the euthymic bipolar adults.
Second, and in support of hypothesis 2, we showed significantly greater amygdala activity to all emerging face emotion conditions in euthymic bipolar relative to healthy adults, which parallels findings of several previous studies in bipolar disorder (Lawrence et al. 2004; Malhi et al. 2004, 2007; Blumberg et al. 2005; Almeida et al. 2010). We also showed greater activity in the somatosensory cortex (BA4) in bipolar versus healthy adults to all emerging face emotion conditions, which only just failed to meet FWE correction in post-hoc between-group comparisons. Together, these findings suggest that bipolar adults may have perceived emotional faces as more salient emotional and sensory stimuli than healthy adults. Furthermore, in examining activity to separate emotions, the main findings included significantly greater amygdala activity to sad faces, which parallels previous findings of greater amygdala activity to sad faces in bipolar depressed adults (Almeida et al. 2010). For happy faces, we found not only elevated amygdala activity in bipolar relative to healthy adults, similar to findings from previous studies (Lawrence et al. 2004; Blumberg et al. 2005), but also, importantly, greater activity in bipolar than healthy adults in mPFC.
Third, and regarding our hypothesis 3, we were able to show significant differences in activity between bipolar and healthy adults during face identity processing. Contrary to our first hypothesis, significant activation was not shown in the mPFC across both groups in both conditions, but activity in this region identified as subserving social processing and self-referential processing did distinguish bipolar and healthy adults during face identity processing, in support of our third hypothesis. Specifically, our novel finding was that bipolar adults showed significantly greater activity during face identity processing in the right mPFC and the amygdala, which stands in contrast to healthy adults who showed deactivation in the mPFC to identity processing.
Studies have shown that the mPFC subserves social cognition, including self-related processing (Fossati et al. 2003; Amodio & Frith, 2006; Feinberg, 2011). The extant literature has demonstrated that euthymic individuals with bipolar disorder demonstrate decreased regional cerebral bloodflow (rCBF) in the mPFC during cognitive tasks (Blumberg et al. 1999) and during mood induction tasks using autobiographical scripts (Kruger et al. 2003) and emotional words (Malhi et al. 2007). We show for the first time, however, abnormally elevated activity in mPFC in euthymic bipolar adults during a face identity processing task and also during a positive face emotion processing, as opposed to healthy adults who showed mPFC deactivation during these conditions.
Taken together, our findings in euthymic adults with bipolar disorder during face identity and positive emotion processing suggest functional abnormalities in neural circuitry that is known to be responsible for supporting both social and emotion processing. It may be that, in turn, these abnormalities contribute to the alterations in self-related processing commonly seen in bipolar in the context of positive emotional state such as grandiosity, and inflated/poor self-esteem, and alterations in agency (First et al. 1995a; Jamison, 1995; Lyon et al. 1999; Inder et al. 2008). This is speculative, however, as we were not able to directly examine neural activity during social or self-processing, and we did not have measures of self-processing. This was one limitation of the study and therefore future studies should directly examine social and self-processing in bipolar and healthy adults.
There were other limitations of the present study. All bipolar adults were medicated, and some had a previous history of co-morbid anxiety disorder and/or co-morbid substance use disorders, a common confound in studies of bipolar disorder (Phillips et al. 2008b). Exploratory analyses, however, revealed very few relationships between activity in neural regions that differed significantly between bipolar and healthy adults and clinical, or even demographic and task performance, measures. The few relationships that were revealed through these analyses indicated that some medications, history of co-morbid anxiety disorders, and higher levels of subthreshold depression severity were in fact associated with lower rather than higher levels of amygdala or mPFC activity to emotional faces. These findings therefore suggest that psychotropic mediations and history of co-morbid anxiety or substance abuse disorders had normalizing, not confounding, effects upon neural activity to emotional faces in bipolar adults. Because of their exploratory nature, the correlations were obtained without correction for multiple comparisons and should therefore be interpreted with restraint, also taking into account the numerous relationships explored and the possibility of type I error and false positive results. The present study examined activity in euthymic individuals with bipolar disorder; however, further study during of neural activity in social processing neural circuitry, in particular during face identity processing, is needed in bipolar individuals during depressed and manic mood states.
Alternative study designs were also considered. The use of a neutral face as a baseline was considered but we decided against this approach secondary to need to account for the motion inherent in this emerging emotion. Use of the identity task as a baseline of comparison was rejected as appropriate given the distinctness of the associated neural system processing streams (Haxby et al. 2000); however, through the examination of the group×condition interaction we were able to directly contrast emotion versus identity through this use of the omnibus model. Lastly, to examine differences between individual emotion categories, the use of an additional 2×4 ANOVA model could have served as a fourth hypothesis and focus, but at the time we chose to focus on the between-group differences in activation.
Face emotion and face identity processing are important subprocesses within social processing. In this study both bipolar and healthy adults were found to recruit face and social processing neural circuitry to all faces in general, but bipolar adults demonstrated abnormally elevated activity during face identity and emotion processing in the mPFC and amygdala, key components of social processing neural circuitry. The presentation of emerging rather than static emotional faces in the present study may have allowed us to observe the pattern of elevated mPFC activity to happy faces, a finding that has not been observed consistently in previous studies of neural circuitry supporting face emotion processing in bipolar disorder (Lawrence et al. 2004; Malhi et al. 2004, 2007; Altshuler et al. 2005; Blumberg et al. 2005; Hassel et al. 2008; Almeida et al. 2010). Our findings highlight the need for future studies to examine neural circuitry during different social cognitive subprocesses, including non-emotional face processing, so as to gain a better understanding of the pathophysiology of bipolar disorder.
Acknowledgments
This work was supported by T32 grant MH18951 (Dr M. T. Keener under Dr D. Brent), and R01 MH076971-01 (Dr M. L. Phillips). All work was carried out within the Department of Psychiatry, University of Pittsburgh. Neuroimaging data were collected at the Brain Imaging Research Center, University of Pittsburgh, and Carnegie Mellon University. We thank Dr K. J. Jung, S. Kurdilla and D. Vizslay for their help acquiring neuroimaging data.
Footnotes
Declaration of Interest
None.
References
- Almeida JR, Versace A, Hassel S, Kupfer DJ, Phillips ML. Elevated amygdala activity to sad facial expressions : a state marker of bipolar but not unipolar depression. Biological Psychiatry. 2010;67:414–421. doi: 10.1016/j.biopsych.2009.09.027. [DOI] [PMC free article] [PubMed] [Google Scholar]
- Altshuler L, Bookheimer S, Proenza MA, Townsend J, Sabb F, Firestine A, Bartzokis G, Mintz J, Mazziotta J, Cohen MS. Increased amygdala activation during mania: a functional magnetic resonance imaging study. American Journal of Psychiatry. 2005;162:1211–1213. doi: 10.1176/appi.ajp.162.6.1211. [DOI] [PubMed] [Google Scholar]
- Amodio DM, Frith CD. Meeting of minds : the medial frontal cortex and social cognition. Nature Reviews Neuroscience. 2006;7:268–277. doi: 10.1038/nrn1884. [DOI] [PubMed] [Google Scholar]
- Angst J, Gamma A, Lewinsohn P. The evolving epidemiology of bipolar disorder. World Psychiatry. 2002;1:146–148. [PMC free article] [PubMed] [Google Scholar]
- Bechara A, Tranel D, Damasio H, Adolphs R, Rockland C, Damasio AR. Double dissociation of conditioning and declarative knowledge relative to the amygdala and hippocampus in humans. Science. 1995;269:1115–1118. doi: 10.1126/science.7652558. [DOI] [PubMed] [Google Scholar]
- Blumberg HP, Donegan NH, Sanislow CA, Collins S, Lacadie C, Skudlarski P, Gueorguieva R, Fulbright RK, McGlashan TH, Gore JC, Krystal JH. Preliminary evidence for medication effects on functional abnormalities in the amygdala and anterior cingulate in bipolar disorder. Psychopharmacology. 2005;183:308–313. doi: 10.1007/s00213-005-0156-7. [DOI] [PubMed] [Google Scholar]
- Blumberg HP, Stern E, Ricketts S, Martinez D, De Asis J, White T, Epstein J, Isenberg N, McBride PA, Kemperman I, Emmerich S, Dhawan V, Eidelber GD, Kocsis JH, Silbersweig DA. Rostral and orbital prefrontal cortex dysfunction in the manic state of bipolar disorder. American Journal of Psychiatry. 1999;156:1986–1988. doi: 10.1176/ajp.156.12.1986. [DOI] [PubMed] [Google Scholar]
- Bora E, Vahip S, Gonul AS, Akdeniz F, Alkan M, Ogut M, Eryavuz A. Evidence for theory of mind deficits in euthymic patients with bipolar disorder. Acta Psychiatrica Scandinavica. 2005;112:110–116. doi: 10.1111/j.1600-0447.2005.00570.x. [DOI] [PubMed] [Google Scholar]
- Bruce V, Young A. Understanding face recognition. British Journal of Psychology. 1986;77:305–327. doi: 10.1111/j.2044-8295.1986.tb02199.x. [DOI] [PubMed] [Google Scholar]
- Chen CH, Lennox B, Jacob R, Calder A, Lupson V, Bisbrown-Chippendale R, Suckling J, Bullmore E. Explicit and implicit facial affect recognition in manic and depressed states of bipolar disorder : a functional magnetic resonance imaging study. Biological Psychiatry. 2006;59:31–39. doi: 10.1016/j.biopsych.2005.06.008. [DOI] [PubMed] [Google Scholar]
- Dannlowski U, Ohrmann P, Konrad C, Bauer J, Kugel H, Schoning S, Kersting A, Baune BT, Arolt V, Heindel W, Zwitserlood P, Suslow T. Reduced amygdala prefrontal connectivity is associated with symptom severity in major depression. Pharmacopsychiatry. 2007;40:A004. [Google Scholar]
- Farah MJ. Is face recognition ‘special’? Evidence from neuropsychology. Behavioral Brain Research. 1996;76:181–189. doi: 10.1016/0166-4328(95)00198-0. [DOI] [PubMed] [Google Scholar]
- Feinberg TE. The nested neural hierarchy and the self. Consciousness and Cognition. 2011;20:4–15. doi: 10.1016/j.concog.2010.09.016. [DOI] [PubMed] [Google Scholar]
- First MB, Frances A, Pincus HA. DSM-IV Handbook of Differential Diagnosis. American Psychiatric Press; Washington, DC: 1995a. [Google Scholar]
- First MB, Spitzer RL, Gibbon M, Willians JBW. Structured Clinical Interview for DSM-IV Axis I Disorders (SCID version 2.0) Biometric Research Department, New York State Psychiatric Institute; New York: 1995b. [Google Scholar]
- Fossati P, Hevenor SJ, Graham SJ, Grady C, Keightley ML, Craik F, Mayberg H. In search of the emotional self : an FMRI study using positive and negative emotional words. American Journal of Psychiatry. 2003;160:1938–1945. doi: 10.1176/appi.ajp.160.11.1938. [DOI] [PubMed] [Google Scholar]
- Gallagher M, McMahan RW, Schoenbaum G. Orbitofrontal cortex and representation of incentive value in associative learning. Journal of Neuroscience. 1999;19:6610–6614. doi: 10.1523/JNEUROSCI.19-15-06610.1999. [DOI] [PMC free article] [PubMed] [Google Scholar]
- Getz GE, Shear PK, Strakowski SM. Facial affect recognition deficits in bipolar disorder. Journal of the International Neuropsychological Society. 2003;9:623–632. doi: 10.1017/S1355617703940021. [DOI] [PubMed] [Google Scholar]
- Goswami U, Sharma A, Khastigir U, Ferrier IN, Young AH, Gallagher P, Thompson JM, Moore PB. Neuropsychological dysfunction, soft neurological signs and social disability in euthymic patients with bipolar disorder. British Journal of Psychiatry. 2006;188:366–373. doi: 10.1192/bjp.188.4.366. [DOI] [PubMed] [Google Scholar]
- Hamilton M. A rating scale for depression. Journal of Neurology, Neurosurgery and Psychiatry. 1960;23:56–62. doi: 10.1136/jnnp.23.1.56. [DOI] [PMC free article] [PubMed] [Google Scholar]
- Hariri AR, Tessitore A, Mattay VS, Fera F, Weinberger DR. The amygdala response to emotional stimuli : a comparison of faces and scenes. NeuroImage. 2002;17:317–323. doi: 10.1006/nimg.2002.1179. [DOI] [PubMed] [Google Scholar]
- Hassel S, Almeida J, Kerr N, Nau S, Ladouceur C, Fissell K, Kupfer D, Phillips M. Elevated striatal and decreased dorsolateral prefrontal cortical activity in response to emotional stimuli in euthymic bipolar disorder : no associations with psychotropic medication load. Bipolar Disorders. 2008;10:916–927. doi: 10.1111/j.1399-5618.2008.00641.x. [DOI] [PMC free article] [PubMed] [Google Scholar]
- Haxby JV, Hoffman EA, Gobbini MI. The distributed human neural system for face perception. Trends in Cognitive Sciences. 2000;4:223–233. doi: 10.1016/s1364-6613(00)01482-0. [DOI] [PubMed] [Google Scholar]
- Haxby JV, Hoffman EA, Gobbini MI. Human neural systems for face recognition and social communication. Biological Psychiatry. 2002;51:59–67. doi: 10.1016/s0006-3223(01)01330-0. [DOI] [PubMed] [Google Scholar]
- Haxby JV, Horwitz B, Ungerleider LG, Maisog JM, Pietrini P, Grady CL. The functional organization of human extrastriate cortex : a PET-rCBF study of selective attention to faces and locations. Journal of Neuroscience. 1994;14:6336–6353. doi: 10.1523/JNEUROSCI.14-11-06336.1994. [DOI] [PMC free article] [PubMed] [Google Scholar]
- Hoffman EA, Haxby JV. Distinct representations of eye gaze and identity in the distributed human neural system for face perception. Nature Neuroscience. 2000;3:80–84. doi: 10.1038/71152. [DOI] [PubMed] [Google Scholar]
- Inder ML, Crowe MT, Moor S, Luty SE, Carter JD, Joyce PR. ‘I actually don’t know who I am ’: the impact of bipolar disorder on the development of self. Psychiatry. 2008;71:123–133. doi: 10.1521/psyc.2008.71.2.123. [DOI] [PubMed] [Google Scholar]
- Insel T. From Discovery to Cure. Report of the National Advisory Mental Health Council’s Workgroup. National Institutes of Health, National Institute of Mental Health, National Advisory Mental Health Council; 2010. Aug, ( http://www.nimh.nih.gov/about/advisory-boards-and-groups/namhc/reports/fromdiscoverytocure.pdf) [Google Scholar]
- Insel T, Cuthbert B, Garvey M, Heinssen R, Pine DS, Quinn K, Sanislow C, Wang P. Research domain criteria (RDoC) : toward a new classification framework for research on mental disorders. American Journal of Psychiatry. 2010;167:748–751. doi: 10.1176/appi.ajp.2010.09091379. [DOI] [PubMed] [Google Scholar]
- Jamison KR. Manic-depressive illness and creativity. Scientific American. 1995;272:62–67. doi: 10.1038/scientificamerican0295-62. [DOI] [PubMed] [Google Scholar]
- Kanwisher N, McDermott J, Chun MM. The fusiform face area: a module in human extrastriate cortex specialized for face perception. Journal of Neuroscience. 1997;17:4302–4311. doi: 10.1523/JNEUROSCI.17-11-04302.1997. [DOI] [PMC free article] [PubMed] [Google Scholar]
- Keener MT, Phillips ML. Neuroimaging in bipolar disorder : a critical review of current findings. Current Psychiatry Reports. 2007;9:512–520. doi: 10.1007/s11920-007-0070-2. [DOI] [PMC free article] [PubMed] [Google Scholar]
- Kruger S, Seminowicz D, Goldapple K, Kennedy SH, Mayberg HS. State and trait influences on mood regulation in bipolar disorder : blood flow differences with an acute mood challenge. Biological Psychiatry. 2003;54:1274–1283. doi: 10.1016/s0006-3223(03)00691-7. [DOI] [PubMed] [Google Scholar]
- Lawrence NS, Williams AM, Surguladze S, Giampietro V, Brammer MJ, Andrew C, Frangou S, Ecker C, Phillips ML. Subcortical and ventral prefrontal cortical neural responses to facial expressions distinguish patients with bipolar disorder and major depression. Biological Psychiatry. 2004;55:578–587. doi: 10.1016/j.biopsych.2003.11.017. [DOI] [PubMed] [Google Scholar]
- Lieberman MD. Social cognitive neuroscience: a review of core processes. Annual Review of Psychology. 2007;58:259–289. doi: 10.1146/annurev.psych.58.110405.085654. [DOI] [PubMed] [Google Scholar]
- Lyon HM, Startup M, Bentall RP. Social cognition and the manic defense : attributions, selective attention, and self-schema in bipolar affective disorder. Journal of Abnormal Psychology. 1999;108:273–282. doi: 10.1037//0021-843x.108.2.273. [DOI] [PubMed] [Google Scholar]
- Maldjian JA, Laurienti PJ, Kraft RA, Burdette JH. An automated method for neuroanatomic and cytoarchitectonic atlas-based interrogation of fMRI data sets. NeuroImage. 2003;19:1233–1239. doi: 10.1016/s1053-8119(03)00169-1. [DOI] [PubMed] [Google Scholar]
- Malhi GS, Lagopoulos J, Das P, Moss K, Berk M, Coulston CM. A functional MRI study of Theory of Mind in euthymic bipolar disorder patients. Bipolar Disorders. 2008;10:943–956. doi: 10.1111/j.1399-5618.2008.00643.x. [DOI] [PubMed] [Google Scholar]
- Malhi GS, Lagopoulos J, Owen AM, Ivanovski B, Shnier R, Sachdev P. Reduced activation to implicit affect induction in euthymic bipolar patients: an fMRI study. Journal of Affective Disorders. 2007;97:109–122. doi: 10.1016/j.jad.2006.06.005. [DOI] [PubMed] [Google Scholar]
- Malhi GS, Lagopoulos J, Sachdev P, Mitchell PB, Ivanovski B, Parker GB. Cognitive generation of affect in hypomania : an fMRI study. Bipolar Disorders. 2004;6:271–285. doi: 10.1111/j.1399-5618.2004.00123.x. [DOI] [PubMed] [Google Scholar]
- McClure-Tone E. Socioemotional functioning in bipolar disorder versus typical development: behavioral and neural differences. Clinical Psychology: Science and Practice. 2009;16:98–113. [Google Scholar]
- Murray CJ, Lopez AD. Evidence-based health policy – lessons from the Global Burden of Disease Study. Science. 1996;274:740–743. doi: 10.1126/science.274.5288.740. [DOI] [PubMed] [Google Scholar]
- Pelphrey KA, Morris JP, McCarthy G, Labar KS. Perception of dynamic changes in facial affect and identity in autism. Social Cognitive and Affective Neuroscience. 2007;2:140–149. doi: 10.1093/scan/nsm010. [DOI] [PMC free article] [PubMed] [Google Scholar]
- Phillips M. The emerging role of neuroimaging in psychiatry: characterizing treatment-relevant endophenotypes. American Journal of Psychiatry. 2007;164:697–699. doi: 10.1176/ajp.2007.164.5.697. [DOI] [PubMed] [Google Scholar]
- Phillips M, Ladouceur C, Drevets W. A neural model of voluntary and automatic emotion regulation : implications for understanding the pathophysiology and neurodevelopment of bipolar disorder. Molecular Psychiatry. 2008a;13:833–857. doi: 10.1038/mp.2008.65. [DOI] [PMC free article] [PubMed] [Google Scholar]
- Phillips ML, Travis MJ, Fagiolini A, Kupfer DJ. Medication effects in neuroimaging studies of bipolar disorder. American Journal of Psychiatry. 2008b;165:313–320. doi: 10.1176/appi.ajp.2007.07071066. [DOI] [PMC free article] [PubMed] [Google Scholar]
- Spielberger CD, Vagg PR. Psychometric properties of the STAI : a reply to Ramanaiah, Franzen, and Schill. Journal of Personality Assesment. 1984;48:95–97. doi: 10.1207/s15327752jpa4801_16. [DOI] [PubMed] [Google Scholar]
- Tottenham N, Tanaka J, Leon A, Mccarry T, Nurse M, Hare T, Marcus D, Westerlund A, Casey BJ, Nelson C. The NimStim set of facial expressions : judgments from untrained research participants. Psychiatry Research. 2009;168:242–249. doi: 10.1016/j.psychres.2008.05.006. [DOI] [PMC free article] [PubMed] [Google Scholar]
- Vuilleumier P, Pourtois G. Distributed and interactive brain mechanisms during emotion face perception : evidence from functional neuroimaging. Neuropsychologia. 2007;45:174–194. doi: 10.1016/j.neuropsychologia.2006.06.003. [DOI] [PubMed] [Google Scholar]
- Young RC, Biggs JT, Ziegler VE, Meyer DA. A rating scale for mania: reliability, validity and sensitivity. British Journal of Psychiatry. 1978;133:429–435. doi: 10.1192/bjp.133.5.429. [DOI] [PubMed] [Google Scholar]