
FIG 8.
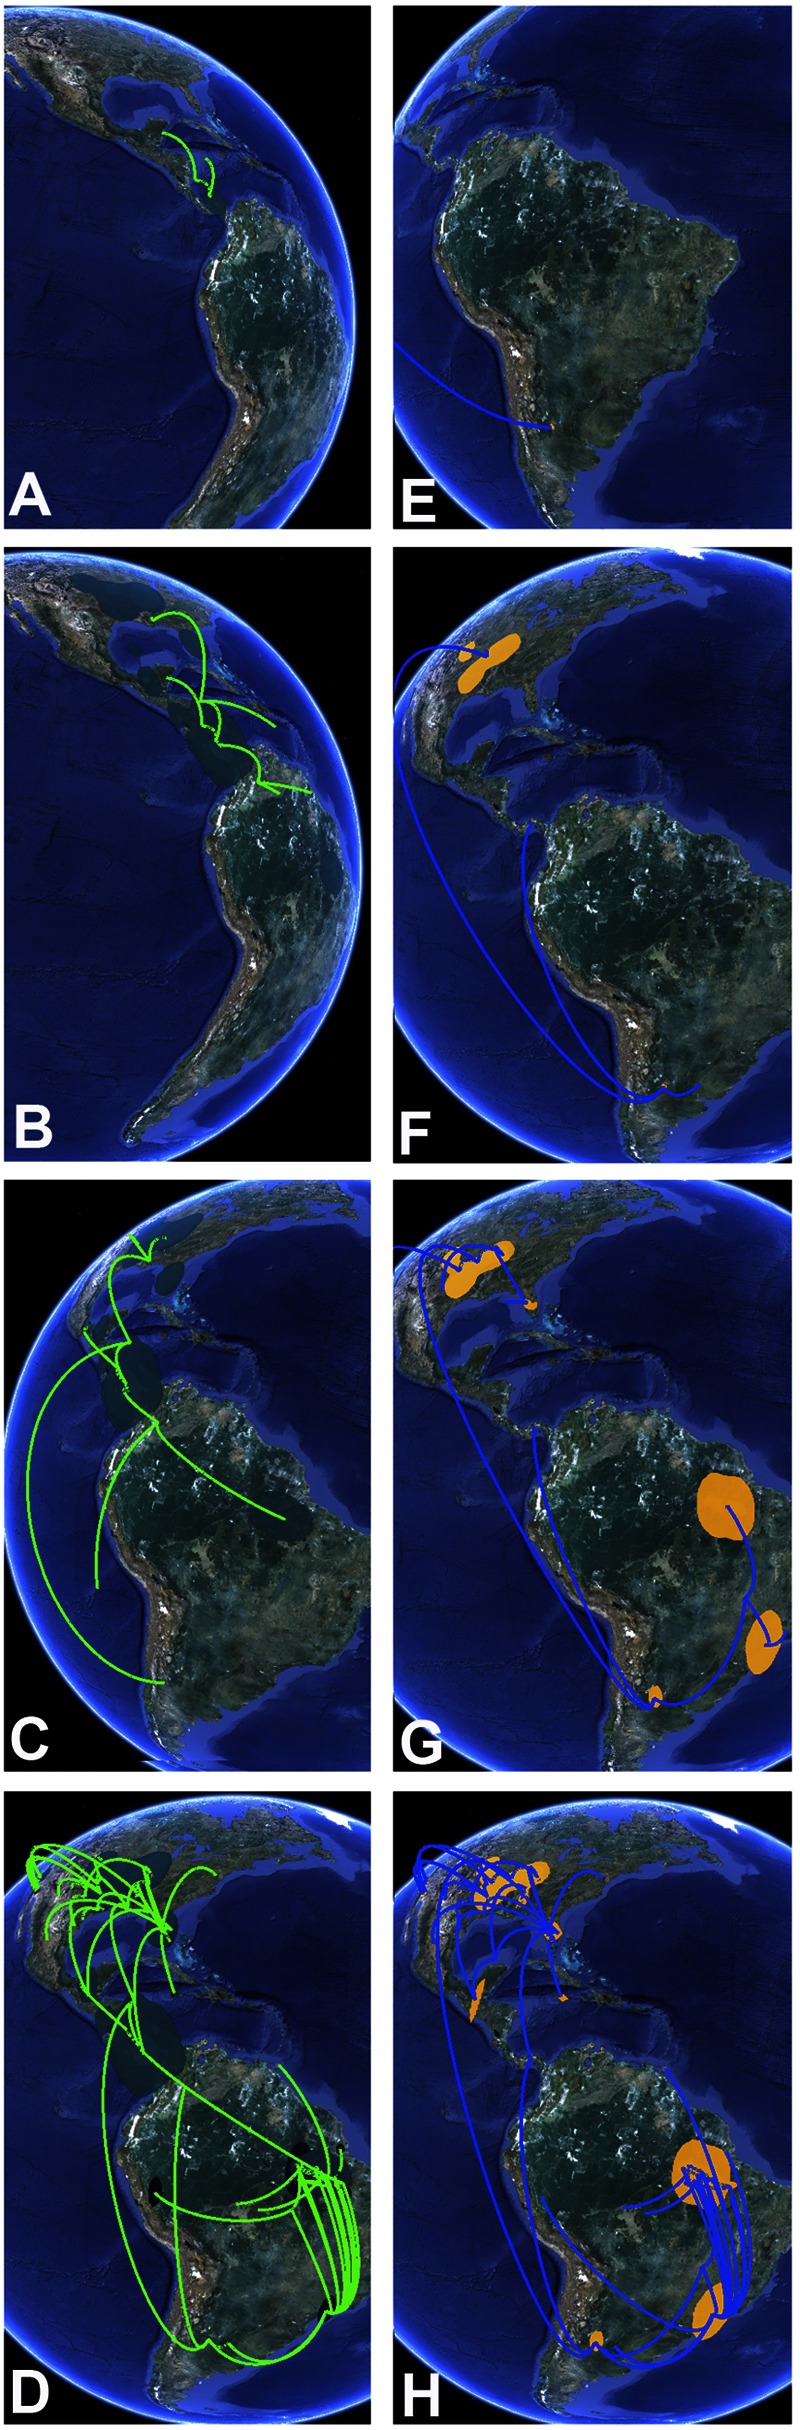
Excerpt from a continuous projection of SLEV phylogeography with and without knowledge of SLEV-Palenque. Shown is the projected spread of the geographic range of root point locations (colored polygons on the map), as well as hypothetical positions of major tree branches (lines) over time. A to D, snapshots from a reconstruction, including SLEV-Palenque; E to H, snapshots from a reconstruction after the removal of SLEV-Palenque. Panel elements represent snapshots taken in Google Earth by using different time ruler positions and appropriate globe rotation angles. Time projections in each panel element roughly correspond to the years 1710 (A), 1740 (B), 1870 (C), 2008 (D), 1750 (E), 1780 (F), 1890 (G), and 2008 (H). Map data: Google, Sanborn.