

Abstract
Background
The purpose of this study was to compare two methods of adherence calculation using administrative data for patients with multiple sclerosis (MS) who are prescribed disease-modifying drugs.
Methods
Pharmacy-billed disease-modifying drug prescription claims were selected from the 2007–2008 LifeLink™ Health Plan Claims Database. The index date was the first disease-modifying drug prescription claim. Two cohorts were created: all patients with a disease-modifying drug claim in 2007 and a subset with continuous eligibility for 12 months post-index. Adherence was calculated across all disease-modifying drugs for 12 months post-index. Medication possession ratios (MPRs) with variable (start to end of therapy) and fixed (365 days) duration denominators were calculated. Variable MPR was calculated by summing days supply from the first to the last prescription (inclusive) divided by time between the last prescription date plus days supply and the first prescription date. Variable MPR was evaluated for all patients and the continuously eligible cohort. Fixed MPR used the same numerator but divided by 365 days of follow-up and evaluated only for the continuously eligible cohort.
Results
There were 3405 patients with MS and a disease-modifying drug claim in 2007 and 2145 in the continuously eligible cohort. Means for variable MPR ranged from 87.5% ± 16.6% for the continuously eligible cohort to 90.5% ± 16.0% for the 2007 cohort. The comparable value for fixed MPR was 78.0% ± 28.2% for the continuously eligible cohort. Fixed MPR gave a consistently lower rate of adherence than variable MPR at an 80% adherence threshold.
Conclusion
Different adherence measures can yield different outcomes, especially when using different eligibility criteria. These results demonstrate the importance of full disclosure of methods used for calculations and specification of the study population.
Keywords: adherence, compliance, medication possession ratio, multiple sclerosis, disease-modifying drug
Introduction
The purpose of this analysis was to compare two commonly used methods of adherence calculation using administrative data for patients with multiple sclerosis (MS) prescribed disease-modifying drugs. While the study was limited to patients with MS, the general principles explored here are likely to be applicable to other patient populations. Further, because nonadherence with disease-modifying drugs among patients with MS has been shown to be associated with relapse,1 understanding the effect of calculation methods for medication possession ratios (MPRs) is critical. Of interest is the dependence of adherence results on the calculation methods used and the extent to which use of an eligibility criterion influences these results.
MS is a chronic, inflammatory, heterogeneous autoimmune disorder of the central nervous system that affects nearly 400,000 individuals in the United States and 2.1 million people worldwide.2 With regard to treatment regimens, many patients with MS experience challenges with adherence, which in many respects is similar to that in patients using medications for other chronic conditions. The list of reasons for nonadherence among patients with MS includes absence of symptoms, forgetfulness, presence of side effects, expense, and the failure to derive benefits from medication.3 These reasons create an interest in identifying nonadherent patients in whom these issues can be managed and thereby improve adherence. Therefore, it is important to have a valid and reliable measure of adherence to help guide interventions and clinical decisions.
The literature reports on a variety of adherence calculation methods based on tablet counts, electronic monitoring by medication containers, patient diaries, and use of adjudicated prescription claims from administrative databases. Studies of these various approaches show considerable divergence in the results. Lee et al compared tablet counts and the electronic Medication Event Monitoring System (MEMS) in African-Americans with kidney disease and hypertension using twice-daily dosing and found that, of patients considered adherent (≥80% of doses taken) by tablet count, only 3% were adherent by MEMS.4 Straka et al compared patient diaries with MEMS in patients on three times daily dosing and found 71% adherence by patient diaries and 55% by MEMS.5 Patients overestimated their adherence by 67%. Grymonpre et al compared patient diaries, tablet counts, and calculations from claims data and found adherence estimates of 65.1% for tablet counts, 94.8% by patient diaries, and 89.1% using claims data.6 Choo et al also compared tablet counts with MEMS and pharmacy claims, and included the same measures of adherence for the 12 months prior to the start date of their study.7 There was considerable consistency within measurement methods, but less consistency across methods. Tablet counts had an adherence rate of 91%, versus 95% for the claims data method and 86% for MEMS. The theme across all these studies is that patient diaries consistently produce higher estimates of adherence compared with other methods. Of methods not based on patient recall (eg, diaries and interviews), claims-based approaches are clearly the most feasible and least costly to perform on a continuing basis. The literature reflects this in terms of the numbers of studies using claims data to assess patient medication adherence.
Perhaps because of the frequent use of claims data for determining adherence, the International Society for Pharmacoeconomics and Outcomes Research (ISPOR) has published the results of an internal working group on this topic.8 ISPOR also supported a working group paper on definitions of compliance and persistence in an attempt to provide some standardization for adherence research based on claims data.9 In that document, and elsewhere, there is an acknowledgement that compliance and adherence are used interchangeably and the working group found, “… no authoritative evidence to support the assumption that ‘adherence’ is a less derogatory term or whether it is preferred by patients.” On the question of where to set a categorical standard for good adherence (eg, 80%), the working group’s review of the literature from 1966 to 2005 found that thresholds were generally unsupported when used. A study that provided outcome evidence associated with an 80% threshold for adherence was reported by Caro et al in which osteoporosis patients at least 80% adherent experienced a 16% lower fracture rate compared with those below 80%.10 The authors also tested different adherence thresholds by creating a multilevel adherence variable of <50% (poor compliance), 50%–80%, 80%–90%, and >90% (high compliance). A Cox proportional hazard model revealed a 16% difference in risk of fracture between high and low compliance groups. This differential effect remained consistent across compliance categories. The authors concluded that categorical adherence definitions are useful and favored because they are more easily understood. The ISPOR Terminology and Definitions paper provides a definition that is consistent with the commonly used technique of the MPR, noting it is a ratio of the number of doses dispensed relative to the dispensing period. Much of the basis for the MPR was developed by Steiner et al.11,12 Farmer was also an early contributor to the development of MPR, and published a comprehensive review of compliance calculation methods.13,14 The MPR explicitly recognizes that adherence measured with claims data provides evidence for receiving a drug, but no evidence that it has been used.
In general, the MPR expresses the percentage of days supply received divided by a period of time. Definitions in the literature have presented either variable or fixed periods for the period of time portion of the calculation. The difference in MPR denominator definition potentially creates some of the differences in research findings and complicates comparisons across studies. This study focuses on two methods of calculating MPR in an effort to identify any differences in findings for the same set of patients with MS.
Materials and methods
Data
Data for this study were extracted from the LifeLink™ Health Plan Claims Database, a national managed care database, for the years 2007 and 2008. This database contained claims for more than 70 million patients enrolled in more than 100 health plans. To be included in the study, patients had to meet the following criteria:
at least one prescription claim billed by National Drug Code for a disease-modifying drug (eligible products included interferon beta-1a for intramuscular injection, interferon beta-1b for subcutaneous injection, glatiramer acetate, interferon beta-1a for subcutaneous injection, and natalizumab [if billed as a pharmacy benefit]) in 2007
no Healthcare Common Procedure Coding System (HCPCS) codes for a disease-modifying drug (ie, claims billed through a physician’s office or facility).
A patient who had a natalizumab claim was included only if all of their disease-modifying drug claims were billed by National Drug Code (ie, as a pharmacy benefit). The HCPCS criterion removed all patients who had any disease-modifying drug claim reimbursed as a medical benefit. Expected days supply is not typically reported for HCPCS coded claims, making calculation of adherence problematic. Two variables in the prescription claims database were used for calculation of medication adherence. The first was the date the prescription was dispensed and the second was days supply on the claim as entered by the pharmacist.
Study design
This was a nonexperimental study comparing two different approaches to calculation of MPR over 12 months following the first disease-modifying drug claim (the index date) in 2007. Adherence was evaluated for two cohorts: all patients with a disease-modifying drug claim in 2007 and a subset with continuous eligibility for 12 months post-index. Continuous eligibility for insurance services was determined using a monthly eligibility marker provided by the data vendor. Patients in the continuously eligible cohort were required to have 12 months with no interruption of insurance eligibility after their index event.
MPR was calculated using two methods, ie, one using a variable duration denominator (VMPR) and the other using a fixed duration denominator (FMPR). The calculations were performed as follows:
“All days supply” = sum of days supply between the index date and last prescription dispensed (inclusive of the last prescription) and “elapsed days” = number of days between the index date and the last prescription dispensed (inclusive of days supply) during the 12-month observation period (last date of service minus first date of service plus 1). Any prescription days supply that spanned the 12-month end date was truncated at 12 months.
For fixed MPR, the denominator is fixed at 365 days, ie, the length of the observation period. The truncation rule applied to the variable MPR method also applies to the fixed MPR method.
In both methods of calculation, overlapping days supply was assumed to be used sequentially because multiple doses of disease-modifying drugs would not typically be administered simultaneously. This rule would likely be modified for other medication classes.
Figure 1 illustrates the calculation of variable MPR. In this example, days supply (the numerator) is 210 days. The denominator is 330 days [(March 25, 2008 to May 1, 2007) + 1] between the index date of May 1, 2007 and the date of the last prescription plus the 30 days supply of the last prescription (February 24, 2008 + 30 = March 25, 2008). Thus, the variable MPR is 0.636 (210 days divided by 330 days).
Figure 1.
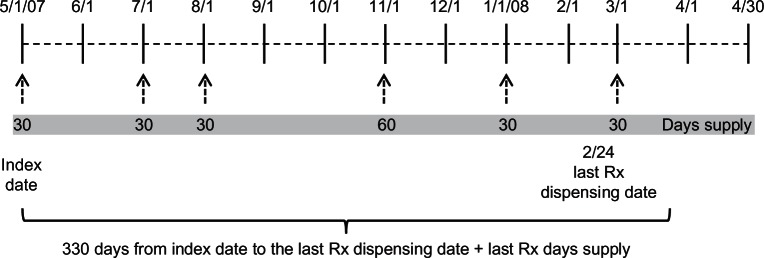
Illustration of prescription dispensing for calculating variable MPR.
Abbreviation: MPR, medication possession ratios.
Figure 2 depicts fixed MPR in which the fixed study period is 365 days (May 1, 2007 to April 29, 2008). Fixed MPR is 0.575 (210 days supply divided by 365 days of the study period). With a fixed study period (eg, 365 days), fixed MPR will always be less than or equal to variable MPR.
Figure 2.
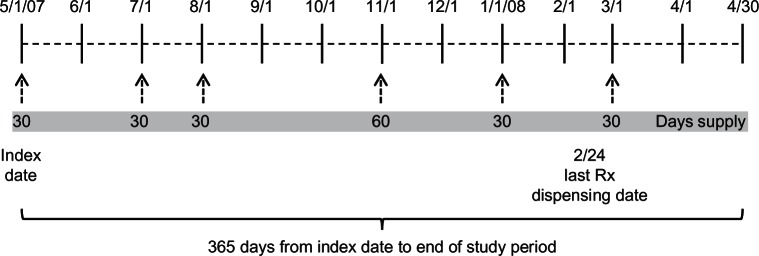
Illustration of prescription dispensing for calculating fixed MPR.
Abbreviation: MPR, medication possession ratios.
Because the variable MPR denominator is based on time from the index date to the last prescription, a measure of eligibility is not typically required and there is an assumption that patients were eligible for reimbursed services between the first and last prescription dates. The absence of plan enrollment information is one reason why a health plan or a specialty pharmacy might use variable MPR. However, fixed MPR should always have some measure of eligibility (eg, enrollment data or claim activity) to ensure that patients have prescription drug coverage for the entire study period regardless of the timing of their prescription claims. Eligibility information is essential for fixed MPR to be interpreted correctly because the period of time with no claim activity at the end of the observation period is included. This illustration of fixed MPR required that subjects were continuously eligible from the index date through the end of the study period. Variable MPR was evaluated for all patients and the continuously eligible cohort. Fixed MPR was only evaluated for the continuously eligible cohort.
Data were analyzed using SAS/STAT software, version 9.2, of the SAS System for Windows (SAS Institute, Cary NC; StatCorp, College Station, TX). Given the goals of the analysis, no formal hypothesis testing was undertaken. Confidence intervals were constructed in lieu of performing statistical tests.
Results
Demographics
A total of 3405 patients with MS on treatment with disease-modifying drugs met the study inclusion criteria for the 2007 cohort. Of these, a total of 2145 were continuously eligible for 12 months from their index date. A summary of descriptive statistics for the entire cohort, as well as the sample of patients with continuous eligibility, is shown in Table 1. Patients in both groups had a mean age of 44 years and approximately 77% were female. The distribution of patients by region was similar for the continuously eligible and no eligibility requirement samples, with the highest percentage in the East, followed by the Midwest, South, and West. The most notable difference was that the percentage of patients in the South was lower in the continuously eligible cohort than in the no eligibility cohort. In general, the subset of continuously eligible patients is very similar to that of the entire 2007 cohort.
Table 1.
Patient demographics
| Variable | Entire cohort (n = 3,405) | Continuously eligible (n = 2,145) |
|---|---|---|
| Age, years | ||
| Mean (SD) | 43.5 (10.7) | 43.9 (10.7) |
| Median (range) | 44.0 (1–86) | 45.0 (7–86) |
| Gender* – n (%) | ||
| Female | 2,626 (77.2) | 1,647 (76.8) |
| Male | 775 (22.8) | 498 (23.2) |
| Region – n (%) | ||
| East | 1,208 (35.5) | 844 (39.4) |
| Midwest | 935 (27.5) | 713 (33.2) |
| South | 869 (25.5) | 351 (16.4) |
| West | 393 (11.5) | 237 (11.0) |
Note:
There are 4 patients in the entire cohort with no reported gender.
Abbreviation: SD, standard deviation.
Adherence
Results of the adherence calculations for variable and fixed MPRs are shown in Table 2. Note that the medians were consistently higher than the means for all methods (ie, skewed data), and that variable MPR with no eligibility requirement had the highest mean and median values. Variable MPR with a continuous eligibility requirement was lower than variable MPR with no eligibility requirement. The lowest mean value was for fixed MPR with a continuous eligibility requirement. This ordering of results is not unexpected given the specifications for calculation, but the magnitude of the differences is of interest. It is also noted from the 95% confidence intervals that these sample sizes allow relatively high precision of estimation of the mean. None of the confidence intervals for the variable MPR with a continuous eligibility requirement, variable MPR with no eligibility requirement, and fixed MPR with a continuous eligibility requirement overlapped. While not a definitive result because patients could be in more than one cohort, the results suggest differences among the cohorts.
Table 2.
MPR comparisons by method of calculation and eligibility status for DMD self-injecting patients
| Variable | N | Mean | SD | Lower CI | Upper CI | Median |
|---|---|---|---|---|---|---|
| VMPR, no eligibility criteria | 3,405 | 90.5 | 16.0 | 90.2 | 90.7 | 98.6 |
| VMPR, continuous eligibility | 2,145 | 87.5 | 16.6 | 87.2 | 87.9 | 94.1 |
| FMPR, continuous eligibility | 2,145 | 78.0 | 28.2 | 77.4 | 78.6 | 92.1 |
Note: 95% confidence intervals around the mean.
Abbreviations: MPR, medication possession ratios; DMD, disease-modifying drug; VMPR, variable medication possession ratios; FMPR, fixed medication possession ratios; CI, confidence interval; SD, standard deviation.
A common practice when reporting adherence results is to convert continuous values to a dichotomous variable. Various dividing points have been reported in the literature, with 75% and 80% being common. The patient-level adherence scores have been converted to dichotomous variables and are plotted in Figure 3 using six different dividing values to show the percentage of patients defined as adherent by each method. The two variable MPR curves are somewhat similar from MPR70 to MPR80, but then fall off at very different rates. The fixed MPR line is uniformly lower, especially at the 70% end of the curve, and then converges with the variable MPR line based on continuous eligibility, as would be expected. All three curves show a marked decline, especially after the 80% category. These decreases occur because, by definition, adherent patients must be eligible for services.
Figure 3.

Percentage of adherent patients by cohort and different categorical adherent definitions.
Abbreviations: MPR, medication possession ratios; VMPR, variable medication possession ratios; FMPR, fixed medication possession ratios.
Limitations
This study has the same limitations as other studies based on retrospective data. The study was limited to patients with MS using self-injectable disease-modifying drugs; results may be different in other patient groups and those using other dosage forms. Further, MPR is only one approach to measuring adherence. Other calculation methods may yield different results. The purpose of this study was to compare alternative methods of measuring adherence. While the methods compared (variable and fixed MPR) are commonly used, there are still important conceptual differences for their calculation. For example, we included days supply of the last prescription in variable MPR. Another approach would be to exclude days supply because there is no evidence that the patient used the medication as prescribed. However, the point of this analysis was to highlight differences between approaches that would not be likely to change with that modification.
Discussion
Adherence measures are frequently presented in the literature; however, methods used for calculation are not always explicitly stated. This research considered two possible ways in which observation periods might be specified and suggests that results may differ depending on the approach used. More research is needed to understand the potential effects that alternative calculation methods have on the values reported. At a minimum, these results illustrate the importance of transparency when reporting adherence calculation results, including how the numerator and denominator were determined. They also highlight the importance of clearly indicating the method of calculation. Published reports of MPR sometimes do not indicate the particular form of MPR that was used. As our study results demonstrate, the method of calculation is important. Also important are the study population (inclusion and exclusion criteria) and the dosage form being studied. This study focused only on self-injectable products, so no dosage form comparisons were conducted, but such analyses are likely to be important when multiple dosage forms are studied or combined.
While not specifically addressed by this research, we note that there are other data characteristics that should also be described in adherence analyses. At a minimum, these include the data source, a discussion of the potential strengths or weaknesses of the data, and completeness of the data (eg, whether the data includes drugs administered while hospitalized, presence of over-the-counter medications, prescription limits, and sampling by physicians). There may also be significant issues with the validity of the days supply variable. Little published research exists regarding the effect of these potential limitations on calculated adherence values. While several national organizations are addressing medication adherence, there is a need for continuing dialog on methodological issues surrounding medication adherence calculations.
The variable MPR method used in this study includes the days supply on the last prescription to demonstrate its effect on adherence. However, the case can be made that the days supply of the last prescription should not be included because there is no evidence that it was used as prescribed. The last prescription date provides an indication that the days supply of the previous prescription was used, but we do not have that evidence for the last prescription. To illustrate this using Figure 1, variable MPR calculated with days supply of the last prescription included yielded a variable MPR of 0.636 (210 days supply/330 elapsed days). If variable MPR was calculated using Figure 1 but without days supply of the last prescription included, then variable MPR would be 0.600 (180 days supply/300 elapsed days). One reason why days supply of the last prescription may be used in studies is to make MPR calculations possible when there is only one prescription for a subject. This practice potentially inflates the MPR for patients with a single prescription because these subjects will always have an MPR of 1.0 (ie, days supply = elapsed days = 1.0). This is obvious when shown for one study subject, but less noticeable when these subjects are embedded in a cohort. Thus, for studies that include a high proportion of subjects with relatively few days supply, the average level of adherence can be overestimated for the group.
Variable MPR is easier to calculate because it does not require eligibility information, making it useful when only prescription claims are available. However, variable MPR provides adherence information only for the period of time when subjects are receiving drugs. That is, variable MPR provides a measure of consistency of use, but provides no information on persistency of use. Variable MPR does not provide information on those subjects who stop or interrupt therapy, which is a common practice in many medical conditions.
The use of variable MPR converted to a dichotomous measure (eg, 80%) provides the opportunity for significant overstatement of the number of adherent patients compared with the use of fixed MPR to make the same dichotomization. Achieving 80% adherence using fixed MPR, with a 365-day study period, requires 292 days supply. Achieving 80% adherence using variable MPR depends on the denominator. For example, if the denominator is 180 days, then only 144 days supply is needed to reach 80% adherence and at a denominator of 330 days, the days supply needed is 264, which is still less than that required for fixed MPR. Thus, subjects in this example considered adherent at 80% using variable MPR would not be considered adherent using fixed MPR. Using variable MPR for conditions requiring long-term therapy would erroneously categorize a significant portion of nonadherent subjects as being adherent.
The choice of how to calculate the numerator of the MPR ratio depends in part on the condition being studied and the products for which adherence is being calculated. For example, counting days supply for disease-modifying drugs to treat MS is an appropriate methodology because patients do not typically use two injections at the same time. However, for hypertension, it makes more sense to use days of treatment (eg, days with a drug) rather than days supply because patients often use multiple drugs at the same time and switch therapies to maintain blood pressure control. In some analyses, this has been referred to as the “proportion of days covered”. Results can clearly be affected by how days supply is determined for the numerator.
Use of fixed MPR is appropriate for medical conditions in which patients are expected to remain on long-term therapy (eg, hypertension, diabetes, MS). This form of MPR would not be appropriate for acute treatments such as antibiotics, pain medications, and corticosteroids.
Regardless of the aforementioned considerations, it is clear from these results that conceptualization of eligibility and how it is incorporated in the analysis can significantly influence the findings. Finally, the choice of a cutoff point for making a dichotomous variable has an effect on the percentage of patients considered adherent. This effect is especially pronounced at lower cutoff points (eg, less than 90%). While the debate about the proper cutoff point for labeling a patient adherent will no doubt continue, there is merit in reporting results by a categorical variable because it is easily understood and is a more stable measure. It would be more difficult to interpret, for example, the effect associated with an additional day of compliance.10
Conclusion
It is important to disclose all adherence calculation parameters when publishing MPR results. Specifically, this includes the medical condition, patient population, drug and dosage forms, role of eligibility, and formulation of MPR. All are necessary components for correct interpretation of the results.
Footnotes
Disclosure
This study was supported by EMD Serono Inc. EMD Serono is a subsidiary of Merck KGaA, Darmstadt, Germany. ALP and DMM are employees of EMD Serono Inc. CMK and MD received research support for this project from EMD Serono Inc.
References
- 1.Ivanova JI, Bergman RE, Birnbaum HG, Phillips AL, Steward M, Meletiche DM. Impact of medication adherence to disease-modifying drugs on severe relapse, and direct and indirect costs among employees with multiple sclerosis in the US. J Med Econ. 2012;15(3):601–609. doi: 10.3111/13696998.2012.667027. [DOI] [PubMed] [Google Scholar]
- 2.National Multiple Sclerosis Society multiple sclerosis: just the facts Available from: http://www.nationalmssociety.org/about-multiple-sclerosis/index.aspxAccessed March 27, 2012
- 3.National Multiple Sclerosis Society Adherence Available from: http://www.nationalmssociety.org/about-multiple-sclerosis/what-we-know-about-ms/treatments/adherence/index.aspxAccessed February 24, 2012
- 4.Lee JY, Kusek JW, Greene PG, et al. Assessing medication adherence by pill count and electronic monitoring in the African American Study of Kidney Disease and Hypertension (AASK) pilot study. Am J Hypertens. 1996;9(8):719–725. doi: 10.1016/0895-7061(96)00056-8. [DOI] [PubMed] [Google Scholar]
- 5.Straka RJ, Fish JT, Benson SR, Suh JT. Patient self-reporting of compliance does not correspond with electronic monitoring: an evaluation using isosorbide dinitrate as a model drug. Pharmacotherapy. 1997;17(1):126–132. [PubMed] [Google Scholar]
- 6.Grymonpre RE, Didur CD, Montgomery PR, Sitar PR. Pill count, self-report, and pharmacy claims data to measure medication adherence in the elderly. Ann Pharmacother. 1998;32(7–8):749–754. doi: 10.1345/aph.17423. [DOI] [PubMed] [Google Scholar]
- 7.Choo PW, Rand CS, Inui TS, et al. Validation of patient reports, automated pharmacy records, and pill counts with electronic monitoring of adherence to antihypertensive therapy. Med Care. 1999;37(9):846–857. doi: 10.1097/00005650-199909000-00002. [DOI] [PubMed] [Google Scholar]
- 8.Peterson AM, Nau DP, Cramer JA, Benner J, Gwadry-Sridhar F, Nichol M. A checklist for medication compliance and persistence studies using retrospective databases. Value Health. 2007;10(1):3–12. doi: 10.1111/j.1524-4733.2006.00139.x. [DOI] [PubMed] [Google Scholar]
- 9.Cramer JA, Roy A, Burrell A, et al. Medication compliance and persistence: terminology and definitions. Value Health. 2008;11(1):44–47. doi: 10.1111/j.1524-4733.2007.00213.x. [DOI] [PubMed] [Google Scholar]
- 10.Caro JJ, Ishak KJ, Huybrechts KF, Raggio G, Naujoks C. The impact of compliance with osteoporosis therapy on fracture rates in actual practice. Osteoporosis Int. 2004;15(12):1003–1008. doi: 10.1007/s00198-004-1652-z. [DOI] [PubMed] [Google Scholar]
- 11.Steiner JF, Koepsell TD, Fihn SD, Inui TS. A general method of compliance assessment using centralized pharmacy records: description and validation. Med Care. 1998;26(8):814–823. doi: 10.1097/00005650-198808000-00007. [DOI] [PubMed] [Google Scholar]
- 12.Steiner JF, Prochazka AV. The assessment of refill compliance using pharmacy records: methods, validity, and applications. J Clin Epidemiol. 1997;50(1):105–116. doi: 10.1016/s0895-4356(96)00268-5. [DOI] [PubMed] [Google Scholar]
- 13.Farmer KC, Jacobs EW, Phillips CR. Long-term patient compliance with prescribed regimens of calcium channel blockers. Clin Ther. 1994;16(2):316–326. [PubMed] [Google Scholar]
- 14.Farmer KC. Methods for measuring and monitoring medication regimen adherence in clinical trials and clinical practice. Clin Ther. 1999;21(6):1074–1090. doi: 10.1016/S0149-2918(99)80026-5. [DOI] [PubMed] [Google Scholar]