

Abstract
Manipulation of differentiation programs has therapeutic potential in a spectrum of human cancers and neurodegenerative disorders. In this study, we integrated computational and experimental methods to unravel the response of a lineage uncommitted precursor cell-line, HL-60, to Retinoic Acid (RA). HL-60 is a human myeloblastic leukemia cell-line used extensively to study human differentiation programs. Initially, we focused on the role of the BLR1 receptor in RA-induced differentiation and G1/0-arrest in HL-60. BLR1, a putative G protein-coupled receptor expressed following RA exposure, is required for RA-induced cell-cycle arrest and differentiation and causes persistent MAPK signaling. A mathematical model of RA-induced cell-cycle arrest and differentiation was formulated and tested against BLR1 wild-type (wt) knock-out and knock-in HL-60 cell-lines with and without RA. The current model described the dynamics of 729 proteins and protein complexes interconnected by 1356 interactions. An ensemble strategy was used to compensate for uncertain model parameters. The ensemble of HL-60 models recapitulated the positive feedback between BLR1 and MAPK signaling. The ensemble of models also correctly predicted Rb and p47phox regulation and the correlation between p21-CDK4-cyclin D formation and G1/0-arrest following exposure to RA. Finally, we investigated the robustness of the HL-60 network architecture to structural perturbations and generated experimentally testable hypotheses for future study. Taken together, the model presented here was a first step toward a systematic framework for analysis of programmed differentiation. These studies also demonstrated that mechanistic network modeling can help prioritize experimental directions by generating falsifiable hypotheses despite uncertainty.
1. Introduction
Understanding the molecular basis of differentiation, the process by which a cell becomes a more specialized cell, is one of the grand unmet challenges facing molecular cell biology. If differentiation programs could be rationally manipulated, advanced therapies could be developed to treat a spectrum of human cancers, spinal cord injuries and neurodegenerative disorders. However, the molecular basis of these fundamental programs are still emerging in both adult and embryonic models.1 To rationally reprogram these networks we must first understand their connectivity and regulation. Lessons learned in simple systems could perhaps inform analysis of more complex programs. One such model system for the study of differentiation is the lineage uncommitted human myloblastic cell line HL-60. HL-60 is an archetypal in vitro differentiation model studied since the late 1970’s.2–4 Depending upon the stimulus, HL-60 undergoes G1/0-arrest followed by either myeloid or monocytic differentiation. Retinoic acid (RA) or dimethyl sulfoxide (DMSO) causes G1/0-arrest and myeloid differentiation. On the other hand, 1,25-dihydroxy vitamin D3 (D3) or sodium butyrate causes arrest with monocytic differentiation. Stimuli such as RA or D3 drive MEK-dependent activation of the ERK1/2-MAPK pathway.5–8 Elevated MAPK signaling persists until cells G1/0-arrest and terminally differentiate. The onset of G1/0 arrest and terminal differentiation requires approximately 48 h. During this period, HL-60 cells undergo approximately two division cycles.9–12 Interestingly, during the first 24 h of treatment, called a precommitment period, cells are primed to differentiate without lineage specificity. Lineage specificity is determined in the second 24 h period. Disruption of MEK signaling leads to failure of ERK1/2 activation and HL-60 differentiation. Activation of both Retinoic acid receptor (RAR) and retinoid X receptor (RXR) is necessary for RA-induced G1/0-arrest, MAPK signal activation13–15 and myeloid differentiation.6–8,16
RA-induced differentiation is contingent on the early transcriptional up-regulation of BLR1 (Burkitt’s Lymphoma Receptor-1). BLR1, also known as CXCR5, is a putative serpentine heterotrimeric Gq protein-coupled receptor, with a sequence similar to IL-8 receptors.17 It was first discovered in a screen for differentially expressed genes that conferred metastatic capability to human B-cell lymphomas.17,18 BLR1 was identified as an early RA (or D3)-inducible gene in HL-60 cells using differential display,4,19 suggesting it had a broader function than lymphocyte regulation. Studies of the BLR1 promoter identified a 5′ 17 bp GT box approximately 1 kb upstream of the transcriptional start that conferred RA responsiveness.20 Over-expression of BLR1 in HL-60 cells enhanced ERK2 activation in both RA-untreated and treated cells and accelerated RA- and D3-induced differentiation and G1/0-arrest. Alternatively, BLR1 homologous knockout cells failed to produce a sustained MAPK response, arrest or differentiate. However, activation of MAPK signaling via constitutively active c-Raf over-expression was able to rescue the differentiation response. Furthermore, inhibiting MAPK activation via a c-Raf inhibitor or siRNA knockdown resulted in decreased BLR1 expression, and loss of differentiation and arrest.21 Thus, RA-induced BLR1 expression appears to contribute to sustained ERK2 activation and propulsion of induced differentiation and G0 arrest.
To analyze RA-induced arrest and differentiation in HL-60 we integrated experimental and computational methods. Many have suggested that the integration of experimental and computational research is required to unravel critical questions facing modern cell biology.22,23 Toward this end, mathematical modeling has become an important tool to understand biological complexity.24 A common method of modeling biological pathways is to formulate coupled ordinary differential equations (ODEs).25–36 However, to formulate and solve ODE models, both the network structure and parameter estimates are required. Yeast two-hybrid (Y2H),37–40 fluorescence resonance energy transfer (FRET)41 or chromatin immunoprecipitation (ChIP)-DNA microarray techniques42–45 have all been used to identify network interactions. Although error-prone,46,47 these techniques along with traditional low-throughput immunoprecipitation, have been the basis for most experimental network discoveries. Computational motif discovery,48–50 high-throughput network reconstruction51–54 or text processing,55 have also contributed significantly to network identification. The integration of these studies has led to comprehensive on-line network databases such as STRING,56 NetworKIN57,58 or KEGG.59–61 However, while network structural knowledge continues to evolve, the identification of model parameters remains a fundamental challenge.
Many forms of experimental data can be used to estimate the parameters and challenge physiochemical models. The direct simulation of metabolite, mRNA and protein concentrations provides a direct means of incorporating absolute or relative experimental measurements into the model identification process. In this study, we made use of protein and mRNA data from Western and Northern blot analysis. Blotting techniques are common, low throughput strategies to measure relative protein or mRNA levels. Relative levels of multiple proteins and post-translational modifications can also be measured by micro or multiplex Westerns,62–64 multi-parameter fluorescence techniques,65,66 and absolute values by HPLC-mass spectrometry.67,68 Data from high throughput RNA technologies, e.g., oligonucleotide arrays,69–71 are also valuable for constraining model parameters. Future data sets can be used to challenge the current model structure. Paradoxically, the best result of this type of challenge is catastrophic model failure; qualitative model failures often suggest new biology and helps focus experimental investigation. Thus, the real value of physiochemical modeling is not constructing a model that is consistent with current data. Rather, it is generating an integrated platform that can be used to systematically check consistency and help focus our understanding of complex biology.
2. Results
In this study, we tested the sufficiency of the BLR1-MAPK architecture to recapitulate persistent MAPK activation and to predict qualitative molecular features of RA-induced arrest and differentiation in HL-60. The model was organized around the regulation of seven transcription factors by ERK1/2 and PKCα and the subsequent RA-induced transcriptional program (Table 1). The signaling and transcription factor network architecture was assembled by aggregating information from online databases such as NetworKIN57 and TRANSFAC72 along with experimental literature. Model parameters and structures were re-identified to make the model HL-60 specific. The composite network included steroid/hormone activated nuclear transcription factor receptors.19,73 Yen and coworkers established that RA treatment induces BLR1 expression through a non-canonical retinoic acid-responsive element (RARE) in the BLR1 promoter.20 However, the mechanism by which BLR1 drives c-Raf activation in HL-60 remains uncertain. There is evidence suggesting that BLR1 acts as a Gq protein-coupled receptor.74,75 Moreover, Kolch et al. showed that protein kinase C activator (PKCα) phosphorylates c-Raf, at several sites, in NIH 3T3 fibroblasts.76 Here we hypothesized that RA-induced BLR1 activated PKCα through its Gq protein-coupled receptor activity and PKCα in turn phosphorylates c-Raf. The c-Raf driven MAPK signal then activates factors in the BLR1 transcriptional activator complex, resulting in positive feedback. We encoded this connectivity by re-identifying the Gq protein-coupled receptor model of Song and Varner33 in HL-60. To complete the loop, MAPK family members must be connected in some way with BLR1 expression. Components of the BLR1 transcriptional activator complex e.g., NFATc3 and CREB can be phosphorylated by ERK, JNK or p38 MAPK family members.77 In the model we encoded the simplest route, namely the phosphorylation of NFATc3 by ppERK1/2. The in vivo phosphorylation of NFATc3 by ppERK1/2 has been shown in a variety of blood cell types.77 PI3K/AKT/TOR mediated translation initiation78–80 and G1/0 mammalian cell-cycle regulation81 were also included. All molecular interactions, including transcription and translation, were modeled as elementary reactions using mass action kinetics. Mass balance equations describing the dynamics of network components were formulated as a system of non-linear ODEs. The deterministic system of ODEs modeled the average behavior of a cell culture population. Thus, we ignored stochastic effects in this study; both experimental and computational evidence suggest that cell populations act deterministically.82,83 While we assumed spatial homogeneity, we differentiated between cytosolic, membrane and nuclear localized processes using segregated compartments. In total, the model described 729 species and 1356 interactions (Fig. 1 and Table S1, ESI†). The model had 1462 unknown parameters (1356 kinetic constants and 106 initial conditions). The kinetic constants were of three types: association, dissociation or catalytic rate constants. Identification of these unknown model parameters posed a significant challenge. We addressed this challenge by identifying an ensemble of parameter sets consistent with the training data instead of a single best fit but uncertain parameter set. The ensemble of HL-60 models recapitulated the positive feedback between BLR1 and MAPK signaling. The ensemble of models was also capable of making important predictions. For example, the model ensemble correctly predicted Rb and p47phox regulation and the correlation between p21-CDK4-cyclin D formation and G0 arrest. Finally, we investigated the robustness of the HL-60 network subjected to structural perturbations and generated experimentally testable hypothesis for future study. Model parameters and all model codes are available in the ESI.†
Table 1.
Transcription factors (TFs), corresponding kinases and transcription factor target genes used in the transcription subnetwork.
| TF | Kinase | Targets | Citation |
|---|---|---|---|
| ETS | ERK | IRF | 93,108 |
| SRPK2 | |||
| p47Phox | |||
| CD45 | |||
| EIF2AK | |||
| SIIIp15 | |||
| BRN | — | IRF | 93 |
| SRPK2 | |||
| RhoGDI | |||
| p47Phox | |||
| CD45 | |||
| EIF2AK | |||
| SIIIp15 | |||
| CREB | PKCα | IRF | 21,93‡ |
| SRPK2 | |||
| RhoGDI | |||
| p47Phox | |||
| CD45 | |||
| EIF2AK | |||
| SIIIp15 | |||
| BLR1* | |||
| Oct1 | — | IRF | 21,93 |
| SRPK2 | |||
| RhoGDI | |||
| p47Phox | |||
| CD45 | |||
| EIF2AK | |||
| SIIIp15 | |||
| BLR1* | |||
| NFATc3 | ERK | BLR1* | 77 |
| E2F | — | CycE, E2F | 109 |
| AP1 | ERK | CycD | 108 |
TFs for BLR1 interact with each other to promote BLR1 transcription (AND relationship). Alternatively, the other TFs in the model were assumed to independently drive gene expression of their target genes (OR relationship).
Interaction determined via NetworKIN.57
Fig. 1.

Overview of BLR1-MAPK positive feedback loop driving RA induced HL-60 arrest and differentiation. RA signals are intercepted by a family of RAR/RXR nuclear receptors which in turn drive the expression of genes with RARE promoter elements. One key RA-regulated protein is BLR1. BLR1, a putative G protein-coupled transmembrane surface receptor, drives an atypical sustained MAPK signal which in turn activates the expression of genes required for the execution of the cell-cycle arrest and differentiation programs. MAPK also activates factors in the BLR1 transcriptional activator complex resulting in positive feedback.
2.1 Estimating an ensemble of HL-60 models
Signal transduction models often exhibit complex behavior.84–87 It is often not possible to identify model parameters, even with extensive training data and perfect models.88 Thus, despite identification standards89 and the integration of model identification with experimental design,90 parameter estimation remains challenging. In this study, an ensemble of plausible model parameters was estimated from the study of Wang and Yen.21 The data sets used for model training and validation along with the model error are summarized in Table 2. We used the time-course of MAPK activation and BLR1 expression following RA treatment to generate the HL-60 ensemble (Fig. 3). In addition, measurements of the MAPK-BLR1 signaling axis in genetically engineered HL-60 cell-lines were also used (Fig. 4). We employed a maximum likelihood random-walk strategy similar to Battogtokh et al.91 to identify the ensemble (Fig. 2A). We generated 2377 possible parameter sets and selected the most likely sets for inclusion in the ensemble (lowest mean squared error; N = 100). The use of multiple parameter sets allowed for quantitative estimation of the effect of parametric uncertainty.
Table 2.
Quantification of model training and validation error. The normalized mean squared error (NMSE) or the fraction of correct predictions was calculated over the parameter ensemble.
| Species | Simulation | NSME or Fraction correct | Purpose | Citation |
|---|---|---|---|---|
| Fig. 3 | ||||
| BLR1 mRNA | Panel A | 1.80 | Training | 21 |
| pRaf | Panel B | 0.83 | Training | 21 |
| pMek | Panel C | 2.31 | Training | 21 |
| pErk | Panel D | 10.58 | Training | 21 |
| Fig. 4 | ||||
| BLR1 mRNA | Panel A | — | Training | 21 |
| BLR1 mRNA | Panel B | — | Training | 21 |
| pRaf | Panel C | — | Training | 21 |
| Fig. 5 | ||||
| G1/0 Arrest | Panel A | — | Validation | 92 |
| Rb mRNA | Panel B | 0.07 | Validation | 92 |
| Rb protein | Panel B | 2.52 | Validation | This study |
| Table 3 | ||||
| p47Phox | — | 3/3 | Validation | 93 |
| SPRK2 | — | 3/3 | Validation | 93 |
| PRK | — | 2/3 | Validation | 93 |
| Cyclin D | — | 1/3 | Validation | 93 |
| RhoGDI | — | 1/3 | Validation | 93 |
| CD45 | — | 1/3 | Validation | 93 |
| IRF | — | 0/3 | Validation | 93 |
Fig. 3.

Model simulations over the parameter ensemble captured the sustained activation of MAPK following RA exposure (1 μM) at time=1 h. Dashed lines denote the simulation mean. Shaded regions denote one ensemble standard deviation. (A) Experimental and simulated levels of BLR1 mRNA following RA exposure. (B) Time profile of phosphorylated RAF1 activation following RA exposure. (C) Simulated versus measured phosphorylated MEK activation following RA exposure. (D) Simulated versus measured phosphorylated ERK following RA exposure. Data was adapted from Wang and Yen.21
Fig. 4.
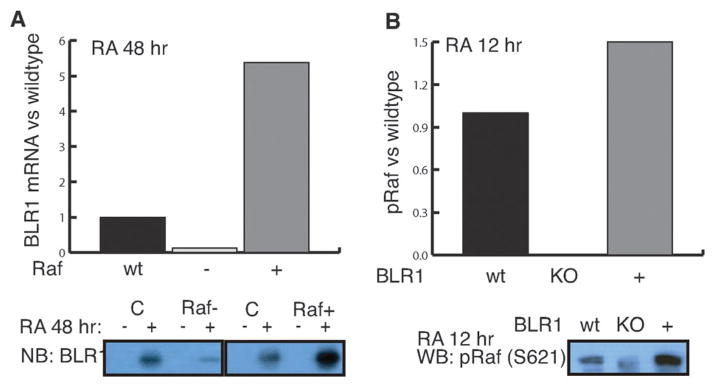
The model recapitulated RA-induced feedback between BLR1 expression and MAPK activation. (A) Simulated BLR1 expression normalized to wildtype (WT) with Raf inhibition (−, 50% decrease in Raf initial condition) and overexpression (+, 50% increase in Raf initial condition) 48 h after the addition of RA. (B) Simulated phosphorylated Raf levels normalized to wildtype (WT) with BLR1 knockout (KO, BLR1 gene initial condition set to zero) and over-expression (+, 50% increase in BLR1 gene initial condition) 12 h after the addition of RA. (bottom panel) Corresponding model training data adapted from Wang and Yen.21 First row: effect of Raf siRNA (left) and overexpression (right) on the expression of BLR1 (Northern). Second row: effect of BLR1 knockout and overexpression of the level of phosphorylated Raf (S621).
Fig. 2.
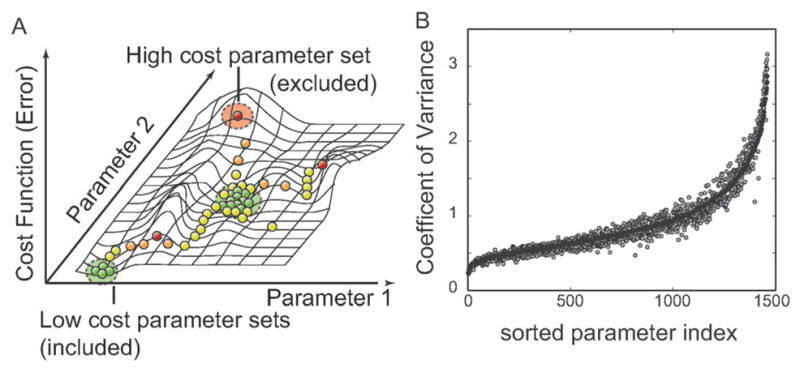
Parameter identification strategy. (A) Multiple Monte-Carlo trajectories were used to randomly explore parameter space. The simulation likelihood was used to generate a family of parameter sets used in the simulation study. We generated N = 2377 possible parameter sets and selected the 100 sets with the highest likelihood for inclusion in the ensemble. (B) Coefficient of Variation (CV; standard deviation of a parameter relative to its mean value) for the parameter ensemble used in this study. A small CV suggested a parameter was tightly constrained by the training data used for model identification. Black circles represent the CV values for the full N = 100 sets used in the ensemble. The gray circles indicate the CV values for a sub-ensemble (N = 47) selected from the main ensemble and used in the robustness analysis study. CV values were sorted from lowest to highest relative to the full ensemble.
The median binding affinity for interactions in the model (calculated over the ensemble) was approximately 100 nM, while the median kcat ≃ 0.5 s−1. Thus, although no specific constraint was applied, the parameters were physiologically reasonable. Additionally, the correlation between ensemble parameter sets showed that we sampled from at least two local minima (Fig. 8). This suggested that the ensemble was diverse and explored multiple possible local solutions. Seventy-two percent of parameters in the ensemble had a CV of less than 100% (Fig. 2B). Thus, the order of magnitude of approximately three-quarters of the model parameters was identified from the training data. Unconstrained parameters typically involved processes not activated by RA or not associated with BLR1 signaling.
Fig. 8.

Correlation between parameter sets in the HL-60 ensemble. Regions of red indicate high correlation, while blue regions denote low correlation.
2.2 The ensemble of HL-60 models recapitulated RA-induced BLR1 expression and MAPK activation
Wang and Yen demonstrated that RA-induced BLR1 expression was necessary for sustained MAPK activation.21 In this study, we explored whether a BLR1 control element was sufficient for sustained MAPK activation. We incorporated a putative BLR1-MAPK feedback architecture supported by literature. BLR1 acted as a Gq protein-coupled receptor74,75 which activated c-Raf via PKCα. The MAPK signaling axis was connected back to BLR1 expression through the regulation of the BLR1 transcriptional activator complex.
The HL-60 connectivity recapitulated RA-induced sustained MAPK activation and feedback between BLR1 and MAPK (Fig. 3 and 4). The ensemble of HL-60 models, following the addition of RA, captured the transient expression of BLR1 (Fig. 3A). BLR1 then drove c-Raf phosphorylation through its hypothesized Gq protein-coupled activity (Fig. 3B). Activated c-Raf was then free to activate downstream MAPK kinases (Fig. 3C and D). The median training error for RA-induced BLR1/MAPK signaling was ~2, where ppERK1/2 was the least constrained species (Table 2). An error of 1.0 indicated the model accuracy was equal to experimental error (assumed to be ±20% for the training blots). Thus, the model recapitulated three of the four species to within a neighbourhood around the experimental error. The ensemble of models also recapitulated aspects of BLR1/MAPK signaling following c-Raf and BLR1 perturbations (Fig. 4). Because the perturbation magnitudes were not reported, we assumed ±50% for all changes, excluding the BLR1 homologous knockout. A 50% decrease in c-Raf expression resulted in a significant reduction in BLR1 message after 48 h of RA exposure (Fig. 4A). Conversely, a 50% increase in c-Raf activation increased BLR1 transcription (Fig. 4A). Removal of BLR1 blocked RA-induced c-Raf activation, while increased BLR1 expression increased c-Raf phosphorylation (Fig. 4B). The BLR1-MAPK perturbation simulations were qualitatively consistent with experimental measurements (Fig. 4 bottom panel).
2.3 The HL-60 ensemble predicted RA-induced expression shifts and qualitative features of G1/0 cell-cycle arrest
We tested the ability of the model to predict qualitative features of RA-induced differentiation not included in the training data (Table 2). The model ensemble predicted that for Rb, a known cell-cycle regulator, protein levels decreased following RA treatment (Fig. 5B). Down-regulation of the Rb protein level was consistent with Western blot measurements, performed in this study, 24 h after RA treatment (Fig. 5B, lower inset). Interestingly, Rb protein levels decreased despite a stable mRNA signal, as demonstrated by Northern blot measurements taken from RA-induced HL-60 cells under similar conditions92 (Fig. 5B, top inset). Ultimately, the model suggested that competition for translational machinery resulted in decreased Rb protein levels. One might consider measuring either mRNA or protein levels to determine regulatory changes in a cell population. However, mRNA and protein levels are not always directly related. Our approach includes both transcription of genes into mRNA and translation of mRNA into proteins by directly modeling the mechanisms involved in these processes. This detailed mechanistic approach allowed us to directly simulate both mRNA and protein levels and to identify possible kinetic differences between the transcription and translation rates for proteins in the model. Thus, the model correctly predicted an unanticipated experimental observation. Other factors not present in the model, for example, RA-induced degradation mechanisms, could also play a role. In addition to shifts in Rb expression, the model ensemble also predicted other RA-induced cell-cycle responses. For example, the model ensemble predicted an increased association of p21 with the CDK4-cyclin D complex following RA-treatment (Fig. 5A). Because p21 is a known cell-cycle inhibitor, increased p21-CDK4-cyclin D levels may be representative of previous data on the kinetics of RA-induced G1/0-arrest (Fig. 5A, inset). However, there was some discrepancy between the previous arrest studies and the cyclin D expression data as cyclin D expression levels were not consistently predicted (Table 3).
Fig. 5.

Computationally predicted markers of RA-induced phenotypic shift. (A) Predicted p21-CDK4-cyclinD complex formation was consistent with the percentage of G1/0-arrested cells (insert). (B) Effect of RA on Rb expression. Rb transcript (top) remains constant while Rb protein (bottom) decreases. Rb transcript consistent with Northern analysis (top insert) while Rb protein levels were consistent with Western analysis (bottom insert). G1/0-arrest data was reproduced from Yen et al., Exp. Cell Res., 165: 193–151 1986. Rb Northern data was reproduced from Yen et al., Eur. J. Cell Biol., 65: 103–113 1994. Rb Western analysis was performed in our lab as described in the Experimental section. Dashed lines denote the simulation mean. Shaded regions denote one ensemble standard deviation.
Table 3.
Predicted and measured RA-induced protein expression shifts at 3, 12 and 24 h after the addition of 1 μM RA to exponentially growing HL-60 cells. Plus (+) indicates that the model and experiment agreed on the statistically significant direction of the shift (up, down or no change). Minus (−) indicates no match. The data was reproduced from Yen and coworkers.93
| Protein | 3 h | 12 h | 24 h |
|---|---|---|---|
| p47Phox | + | + | + |
| SPRK2 | + | + | + |
| PRK | + | + | − |
| RhoGDI | + | − | − |
| Cyclin D | − | + | − |
| CD45 | + | − | − |
| IRF | − | − | − |
Finally, we were interested in identifying the extent to which the current network captured the global RA-induced differentiation program. We predicted the expression of seven key proteins identified as being commonly regulated in HL-60 differentiation by Western blot analysis.93 These protein level measurements were not used in the model training. Unlike the cell-cycle, the model was not tailored to specifically account for the detailed mechanisms involved in regulating each of these proteins. Rather, regulatory information was limited to the identification of putative transcription factors (TRANSFAC72) and their phosphorylation dependent activation (NetworKIN57). The expression shift (up, down or unchanged) at three time points (3, 12 and 24 h) post RA-treatment was compared with model simulations. In total, the BLR1-MAPK control element was responsible for approximately half of the significant RA-induced protein shifts (Table 3). A completely random assignment of expression shift would be correct only one out of three times, indicating the model prediction was above random. For some key proteins, the given network structure and kinetics, although relatively limited, was sufficient to describe the expression profile. For example, the model ensemble consistently predicted the experimentally observed up-regulation of p47Phox, a component of oxidative metabolism important in the functional differentiation of mature myeloid cells.94 Consistently missed predictions, like IRF, indicated the involvement of important regulatory components beyond RA activated nuclear transcription factors and the MAPK cascade.
2.4 Robustness analysis identified essential nodes in RA-induced differentiation of HL-60
Signal transduction architectures often contain redundancy, feedback and crosstalk. These and other features make signaling networks robust to perturbation. However, robust networks which are highly optimized for specific tasks may also contain hidden fragility.95 Here, we generated falsifiable predictions about the fragility or robustness of structural features of the HL-60 network using robustness analysis. We calculated the direction of RA-induced concentration shifts for 729 markers following the deletion of 106 network components. The structural perturbations included the deletion of 80 constitutively expressed proteins, the genes for 20 regulated proteins or the removal of calcium, ATP, etc. Robustness coefficients were calculated to quantify the effect of perturbations where values > 1 indicated a marker increased compared to wild-type and values < 1 indicated a marker decreased. We identified markers that were statistically significantly shifted up (red) or down (blue) over the ensemble (Fig. 6A). We then rank-ordered the results from least (rank = 1) to most (rank=106) effective knock-down (x-axis) and least (rank=1) to most (rank = 729) affected marker (y-axis). Effectiveness was defined as the number of expression shifts caused or the number of perturbations a marker was affected by.
Fig. 6.

Robustness analysis. Each non-zero initial condition (conserved species) was removed, the model was run to approximate steady state and RA was added at time = 1 h. The area under the curve was calculated for each model species. (A) Qualitative coupling results. Removed species are along the x-axis from lowest to largest impact and observed model species are along the y-axis from least to most effected. Blue or red markers depict a statistical decrease or increase, respectively, in the area under the curve within a 90% confidence interval. (B) Coupling coefficients (area under the curve from the simulation with species removed over wild-type simulation) for three markers of differentiation: phosphorylated ERK, p47phox expression and p21-CDK4-cyclin D complex. Red circles indicate knock-downs which demonstrated a statistical decrease in all three markers: (left to right) RAR, RXR, BLR1, NFATc3, RNAp, eIF4E, Oct1, CREB, 40s and 60s ribosomes, met tRNA, EIF2, PABP, eIF4A, B, G, H, and eIF1, 1A, 3, 5, 5B. (C) Dendrogram of knockout species. The distance metric was the Euclidean norm and the linkage function was the inner square product (variance minimization algorithm). Each additional cluster is chosen to reduce the variance (y-axis). The color-threshold was chosen to be 200 which is 50% of the remaining variance after the initial division. General species and/or functions are indicated below each colored group. (D) Distinguishability is defined as the magnitude of the orthogonal components for all knockout species considered. Species are ordered from largest to smallest magnitudes. Red markers indicate species which are statistically significantly above 5. Specific species are identified as shown. Error bars show one standard deviation over the parameter ensemble.
The majority of deletions resulted in only small changes in the network output following the addition of RA. Approximately 80% of the entries in the robustness matrix were equal to zero indicating no significant shift (Fig. 6A, green). For those species that did influence the network state, there was approximately a 30% correlation between connectivity and influence. For example, deletion of RNA polymerase (RNAp) resulted in the largest number of statistically significant shifts, 468 or 64% of the network components. RNAp was also the most connected component with 191 connections (connected to approximately 26% of the network species). However, the Spearman rank correlation between connectivity and knockdown effectiveness was only 0.32. Globally, the largest impact was made by removing RNAp as well as components of translation initiation. Interestingly, while deletion of translation components affected many markers, there were only a limited number of perturbations that impacted translation. Deletion of other structural elements with much lower connectivity also produced global variation. For example, removal of BLR1 or the BLR1 transcription factor complex affected on average 280 markers, or 38% of the network. BLR1 or components of its transcriptional activator complex had an average connectivity of 11, or just 1.5% of the network. Small molecules such as calcium ions, ATP and GDP were also structurally critical, on average effecting 185 markers. Interestingly, MAPK species appeared nearly midway through the ordered list with ERK at rank 43/106 and MEK at rank 46/106. The most influential MAPK component was c-Raf at rank 59/106.
No single structural deletion led to enhanced differentiation of HL-60 following RA exposure. We considered three markers to represent a significant tendency towards HL-60 differentiation: ppERK1/2 represented sustained MAPK signaling; the p21-CDK4-cyclin D complex represented initial aspects of cell-cycle arrest; p47phox expression represented early aspects of the inducible reactive oxygen species machinery. Of the 106 deletions, none consistently up-regulated all three markers. Twenty-two network components (or 21% of those tested) were essential for differentiation (Fig. 6B). Sixteen of these involved translation and RNAp. The remaining six targets were members of the BLR1 transcription factor complex including RAR/RXR. Analysis of the shifts for the individual markers following the structural perturbations suggested functional relationships in the network. For example, deletion of 32 components (or 30% of those explored) reduced ppERK1/2 formation (Fig. 6B, top panel). These included BLR1, RXR/RAR, proteins in the Gq protein-coupled cascade connecting BLR1 with c-Raf, upstream kinases and MAPK phosphatases. Thirty-six perturbations (or 34% of those explored) influenced p21-CDK4-cyclin D formation (Fig. 6B, center panel). In addition to those perturbations associated with ppERK1/2, deletion of components involved with cyclin D expression also influenced p21-CDK4-cyclin D levels. For example, deletion of the phosphatase responsible for dephosphorylating AP1 (transcription factor for cyclin D) increased p21-CDK4-cyclin D levels. Twenty-seven perturbations (or 25% of those explored) shifted p47Phox expression (Fig. 6B, bottom panel). These structural perturbations were largely associated with the regulation of the transcription factors driving p47Phox expression.
2.5 Robustness coefficients identified distinguishable species and functional subnetworks
Direct observation of robustness coefficients for functional markers, while useful, provided very specific information about model behavior. Global analysis of the robustness coefficients provide a systems-level insight into the RA-induced HL-60 differentiation program. For our global analysis, we considered the log of the robustness coefficients (LRC) as the primary metric for measuring response to species knockouts. An LRC of +1 represents an order of magnitude increase from wild-type while a value of −1 represents a ten-fold decrease. The vectors in LRC space provide information on both the direction and the magnitude of a given knockout over all 729 markers. We constructed a dendrogram by separating the species knockouts into clusters which minimized the variance in LRC (Fig. 6C).
The most distinct separation was between infrastructure species, e.g. RNAp and components of the translation initiation complex, and the remaining signaling species. The segregation of infrastructure from signaling species reduced the initial variance by approximately two thirds (Fig. 6C colored groups). Clusters beyond the initial segregation represented distinct functional groups; cell-cycle, the MAPK-BLR1 control element, and transcriptionally regulated markers. Interestingly, although functional relationships emerged in each cluster, the correlation between elements in a cluster was minimal; of the 11 130 possible knockout pairs only 32 returned correlation coefficients above 0.95.
Approximately 50% of the responses following structural perturbation to the HL-60 network were redundant and shared by two or more structural perturbations. We computed the magnitude of the orthogonal component of these changes in LRC space for each knockout over the ensemble (Fig. 6D). The orthogonal component was used to establish a unique marker that could be associated with the different structural perturbations. Interestingly, all knockouts were found to have orthogonal components with magnitudes greater than one with a 95% confidence. This suggested that each of the 106 knockouts produced a unique order of magnitude, or more, shift from wild-type. Furthermore, half were found to be statistically significantly above five (Fig. 6D red).
3. Discussion
A grand challenge in tumor biology continues to be an understanding of the regulation of cell division and differentiation. The primary obstacle to understanding these programs has been their complexity and scale. Interrogating these systems species by species is simply intractable. A computational approach that allows in silico analysis versus experimental surveying would be a tool of widespread utility to push past this hurdle. Our ultimate objective is to develop a cell-type agnostic mathematical model of hormone/growth factor regulated cell division and differentiation. However, as an initial step towards this goal we focused on the archetypal in vitro cell line HL-60. Upon RA treatment, HL-60 undergoes growth arrest and myeloid differentiation. Our basic hypothesis has been that RA-induced cell differentiation is regulated by BLR1 which signals through a RAF/MEK/ERK axis. In turn, the MAPK cascade activates a limited number of transcription factors who then drive the expression of proteins mediating the phenotypic shift.20 The current network incorporates these basic signaling features. We established that a literature-based positive feedback loop between BLR1 and MAPK signaling was sufficient to generate the BLR1 expression and MAPK activation profiles observed experimentally (Fig. 3 and 4). Furthermore, we demonstrated that the current model was capable of making important predictions including the regulation of Rb and p47phox along with the correlation between the p21-CDK4-cyclin D complex and G0 arrest.
Robust networks or systems maintain performance despite structural or operational perturbations. In this study, we performed robustness analysis to estimate which architectural features of the HL-60 network promoted or destroyed differentiation. This analysis also generated falsifiable predictions on the role of individual model species and global insights into the network itself. For example, the core translation machinery was a robust yet fragile subsystem. Deletion of translation components effected roughly 60% of the entire network (Fig. 6A). However, translation was robust in that removal of other network species had little impact on its function. The majority of translation, save met-tRNA and eIF5, were in the lower third of effected markers. However, while necessary, the translation subnetwork may not be experimentally interesting.
To focus on phenotypic conversion we considered three markers of programmed differentiation and G1/0-arrest: ppERK1/2, p21-CDK4-cyclin D and p47phox. These markers were representative of sustained MAPK activity, cell-cycle arrest and early ROS machinery, respectively. Simulations of RA-induced phenotypic change in the wild-type model showed these markers were reliable compared to experimental data. None of the structural perturbations considered consistently up-regulated all three markers. This suggested that no single structural perturbation enhanced the effect of RA and that, given the current network, no components were blocking differentiation. Structural perturbations that consistently down-regulated all three markers were considered targets that would prevent differentiation. Again the translational core machinery along with RNAp proved to be necessary for differentiation. Beyond these global components, we also found that deletion of RAR, RXR, BLR1, NFATc3, Oct1 and CREB (Fig. 6B) also down-regulated differentiation. RAR and RXR were obvious candidates for mitigating the RA differentiation response.96 Removal of BLR1 has previously been shown to prevent differentiation21 and was indeed a motivating factor in the original model design. NFATc3, Oct1, and CREB were all required for transcriptional activation of the BLR1 gene and were therefore of similar importance.20 While this study identified key differentiation regulators, the list was not complete. For example, Yen et al. showed that Raf and MEK activation was also required for differentiation.21,97 In the current network, ERK deletion repressed only two (ppERK1/2 and p21-CDK4-cyclin D) of the three differentiation markers, not affecting p47phox. While ERK may regulate p47phox expression, it may also impact inducible ROS response at other points in the network. A more detailed model, including other differentiation markers, is required to fully unravel the key species in the differentiation program.
We demonstrated that there was a limited relationship between the direct connectivity of a node and the functional consequences of its removal. It has been suggested that many biological networks, including protein–protein interaction networks, have a non-random scale-free or hub and spoke topology.98 Scale-free networks contain many nodes with very few connections and a small number of highly connected nodes producing a power law connectivity distribution. In scale-free networks connectivity has been experimentally related to biological functions, such as mutation lethality in the S. cerevisiae protein–protein interaction network.99 However, increasingly persuasive evidence suggests a divergence between topological metrics like connectivity and importance.100–102 While the HL-60 model architecture was approximately scale free (Fig. 7), we observed a poor relationship (Spearman rank = 0.32) between the connectivity and influence of network nodes. Furthermore, the unique response to structural perturbation is linear unlike the degree distribution (Fig. 6D); one would expect an exponential decrease in response if connectivity alone dominated. Thus, both interaction topology and dynamics must be considered in complex biological programs such as differentiation.
Fig. 7.

The HL-60 network architecture exhibits scale free properties.
The initial model presented here was a step towards a systematic framework for the organization and prediction of hormone-induced programmed differentiation. However, there are several issues that should be addressed in subsequent studies. For example, a common criticism of large complex mathematical models is the poorly characterized effect of model uncertainty. Model uncertainty has two forms. Structural uncertainty is uncertainty in the biology, while parametric uncertainty is incomplete knowledge of model parameters. We used an ensemble approach to overcome parametric uncertainty. Ensemble approaches have successfully addressed uncertainty in systems biology and other fields like weather prediction.33,91,103–105 Their central value is the ability to constrain model predictions despite uncertainty. For example, Sethna and coworkers showed in a model of growth factor signaling that predictions were possible using ensembles despite incomplete parameter information (sometimes only order of magnitude estimates).85 They further showed that model ensembles were predictive using many different mathematical models.106 Consistent with these previous ensemble studies, the HL-60 ensemble predicted the expression of a panel of markers previously found to be important.93 These predictions were successful despite the large uncertainty in the model parameters. However, the prediction error rate was significant. This suggested that structural uncertainty was also important. It is likely that structural uncertainty was present both in terms of missing interactions (false negatives) and incorrect interactions (false positives). We partially mitigated structural uncertainty by associating each interaction with experimental studies or previously validated network models. However, in some cases connectivity had to be hypothesized from literature. For example, the connectivity between BLR1 signaling and c-Raf activation was hypothesized from studies in fibroblasts. G coupled-protein receptor (GCPR) signaling and the subsequent activation of PKCα was modeled as a sequential series of activating events. This basic architecture was sufficient to generate an RA-induced sustained MAPK signal. Furthermore, we demonstrated that all of the 106 conserved model species played a unique functional role. Removal of any of these resulted in an order of magnitude, or more, shift from wild-type that was orthogonal to all other knockout species (Fig. 6D). Despite the apparent importance of all modeled species, the exact connectivity remains to be validated in HL-60. To validate the proposed architecture, our laboratory is employing biochemical strategies to characterize intermediate complexes in the BLR1 signaling axis. False negative structural defects also represent a significant challenge. Current computational and biological limitations render a full cell model intractable. Thus, the choice of scope is an important aspect to modeling protein interaction networks. In this study, we focused on MAPK-BLR1 positive feedback. Inclusion of other signaling pathways or a more advanced transcriptional regulation networks will be required to capture the RA-induced expression shifts missed here as well as other HL-60 differentiation data. The framework provided in this study is amenable to expansion. The inclusion of more experimental data and a more detailed network architecture could improve the predictive power of the model and provide an in silico tool for understanding hormone-induced programmed differentiation.
4. Conclusions
In this study, we presented a mechanistic mathematical model of RA-induced differentiation of the hematopoietic cell line HL-60. We demonstrated that a BLR1-MAPK positive feedback mechanism was sufficient for sustained RA-induced MAPK activation. Furthermore, we demonstrated that, while limited in biological scope, this control element was sufficient to describe the transcriptional regulation of several proteins found to be important in HL-60 differentiation. Through in silico knockouts we also showed the model’s ability to generate falsifiable predictions. For example, we predicted that no knockout of the species considered resulted in an increased differentiation. Structurally, the HL-60 differentiation network demonstrated the divergence between simple topological metrics like connectivity and biological function. Interestingly, we found that conserved species, the majority of which have low connectivity, contributed a unique and distinguishable response to RA treatment. Finally, a systematic clustering analysis identified distinct subnetworks important to the differentiation response. One of these subnetworks, the protein synthesis/translation subnetwork, exhibited robust yet fragile behavior. While perturbations to translation resulted in general program failure, translation itself was robust to outside perturbation. This is a prime example of how biological networks are structured to protect against catastrophic failure. We believe that this study is a significant first step in providing a computational tool for understanding the pathways involved in hormone-induced programmed differentiation.
5. Experimental
5.1 Cell culture, RA treatment and western blot analysis
Human myeloblastic leukemia cells (HL-60) were grown in a humidified atmosphere of 5% CO2 at 37 °C and maintained in RPMI 1640 supplemented with 5% fetal bovine serum (Invitrogen). The cells were cultured in constant exponential growth as previously described.107 The experimental cultures were initiated at a cell density of 0.2 × 10⁶ cells ml−1. RA(Sigma) was dissolved in 100% ethanol with a stock concentration of 5 mM and used at a final concentration of 1 μM as previously described.107 For Western blot analyses, 1.2 × 10⁷ cells were lysed using 400 μl of M-Per lysis buffer (Pierce) and lysates were cleared by centrifugation at 16 950 × g in a microcentrifuge for 20 min at 4 °C. Equal amounts of protein lysates (20 μg) were resolved by 8% SDS-PAGE at 90 volts, transferred to nitrocellulose membranes and probed with a primary and secondary antibodies for visualization. Antibody solutions contained 10 μL of the appropriate antibody and 1 g bovine serum albumin dissolved in 20 mL 1X TBS, 0.1% Tween. The primary Retinoblastoma (Rb) antibody was purchased from Zymed. A GAPDH antibody (Cell Signaling, Beverly, MA) was used to check uniform loading. Anti-rabbit and anti-mouse horseradish peroxidase-linked secondary antibodies (Cell Signaling, Beverly, MA) were used for visualization.
5.2 Formulation and solution of the model equations
The HL-60 model was formulated as a set of coupled ordinary differential equations (ODEs):
| (1) |
The symbol S denotes the stoichiometric matrix (729 × 1356). The quantity x denotes the concentration vector of proteins or protein complexes (729 × 1). The term r(x,p) denotes the vector of reaction rates (1356 × 1). Each row in S described a protein while each column described the stoichiometry of network interactions. Thus, the (i, j) element of S, denoted by σij, described how protein i was involved in rate j. If σij< 0, then protein i was consumed in rj. Conversely, if σij > 0, protein i was produced by rj. Lastly, if σij = 0, there was no protein i in rate j.
We assumed mass action kinetics for each interaction in the network. The rate expression for protein–protein interaction or catalytic reaction q was given by:
| (2) |
The set {Rq} denotes reactants for reaction q. The kq term denotes the rate constant governing the qth interaction. Lastly, σjq denotes stoichiometric coefficients (elements of the matrix S). We treated every interaction in the model as non-negative. All reversible interactions were split into two irreversible steps. The mass action formulation, while expanding the dimension of the model, regularized the mathematical structure. The regular structure allowed automatic generation of the model equations using the UNIVERSAL code generation tool (http://code.google.com/p/universal-code-generator/). Mass-action kinetics also regularized the model parameters. Unknown model parameters were one of only three types: association, dissociation or catalytic rate constants. Thus, although mass action kinetics increased the number of parameters and species, they reduced the complexity of model analysis. In this study, we did not consider intracellular concentration gradients. However, we accounted for membrane, cytosolic and nuclear species by explicitly incorporating separate well mixed compartments.
5.3 Simulation protocol
A pseudo steady state was used as the starting point (t = 0 h) for all simulations presented in this study. For example, when calculating the response of HL-60 to the addition of RA, we first ran the model to steady state and then simulated the addition of RA. We assumed that a pseudo steady state was a reasonable approximation of the population average behavior of HL-60 growing in the exponential phase. The steady state was estimated numerically by repeatedly solving the model equations and estimating the difference between two subsequent time points:
| (3) |
The quantities x(t) and x(t + Δt) denote the simulated concentration vector at time t and t+Δt, respectively. The quantity ||·||2 denotes the L2 vector norm. In this study, we used Δt = 50 h of simulated time and ε = 0.01 for all simulations.
5.4 Estimating an ensemble of model parameters
The 1462 unknown model parameters (1356 kinetic constants and 106 non-zero initial conditions) were estimated using the experimental studies performed by Wang and Yen.21 The experimental work focused on the existence of a BLR1-MAPK positive feedback loop and included time course data and genetically engineered cell-lines to capture perturbations in both the BLR1 and MAPK signaling axis. The initial parameter guess p0 was used to generate an ensemble of parameters that maximized the likelihood of describing the training data. The difference between the measured and simulated value of species j at time or condition i, denoted by x̂i,j and x(pk)i,j respectively, was quantified by the normalized mean squared error, η:
| (4) |
where the sum was carried out over all species j and observations i. The quantities N and σ̂i,j denote the total number of observations and the measurement error of species j at time or condition i, respectively. If no experimental error was reported, we assumed a standard deviation equal to 10% of the reported observation. In cases where the quantification of the stimulus or observation was unclear an augmented error of 20–100% was applied to compensate for the added uncertainty. The scaling factor βj was chosen to minimize the normalized squared error for a given experiment and species j:104
| (5) |
Because of the scaling factor, the concentration units on simulation results were arbitrary (consistent with the arbitrary units associated with the majority of the training data). There was insufficient training data to properly constrain the model parameters. To account for parametric uncertainty, a Monte-Carlo approach similar to Battogtokh et al.91 was used to generate an ensemble of parameters. Consider a set of model parameters pi. Let the likelihood that model simulations with parameters pi describe the training data be defined as:
| (6) |
where η(pi) denotes the simulation error associated with parameter set pi. The quantity
 is a parameter used to tune the rate of acceptance. Further, let the acceptance probability, P(p′i+1|pi), of a new parameter set, p′i+1, be
if φ(p′i+1)<φ(pi) and 1 otherwise. P denotes the probability that p′i+1 will be accepted as the starting point for consecutive Monte-Carlo steps. Parameter sets were generated by applying a small additive random perturbation in log space:
is a parameter used to tune the rate of acceptance. Further, let the acceptance probability, P(p′i+1|pi), of a new parameter set, p′i+1, be
if φ(p′i+1)<φ(pi) and 1 otherwise. P denotes the probability that p′i+1 will be accepted as the starting point for consecutive Monte-Carlo steps. Parameter sets were generated by applying a small additive random perturbation in log space:
| (7) |
where
 (0, ν) is a normally distributed random number with zero mean and variance ν. The perturbation was applied in log space to account for the large variation in parameter scales and to ensure positivity. Monte-Carlo trajectories were generated starting from p0 where ν = 0.05 or 0.1 and
= 1 or 0.5. The autocorrelation function of each trajectory was calculated. The number of Monte-Carlo steps between parameter sets which were added to the ensemble was taken to be the number of steps after which the autocorrelation function dropped to 5% of its initial value. This was done to ensure independence between sets in the ensemble. To compensate for noise in the autocorrelation function an exponential fit was applied. We generated 2377 possible parameter sets from which we selected the 100 sets with the highest likely-hood for inclusion in the final ensemble.
(0, ν) is a normally distributed random number with zero mean and variance ν. The perturbation was applied in log space to account for the large variation in parameter scales and to ensure positivity. Monte-Carlo trajectories were generated starting from p0 where ν = 0.05 or 0.1 and
= 1 or 0.5. The autocorrelation function of each trajectory was calculated. The number of Monte-Carlo steps between parameter sets which were added to the ensemble was taken to be the number of steps after which the autocorrelation function dropped to 5% of its initial value. This was done to ensure independence between sets in the ensemble. To compensate for noise in the autocorrelation function an exponential fit was applied. We generated 2377 possible parameter sets from which we selected the 100 sets with the highest likely-hood for inclusion in the final ensemble.
5.5 Robustness analysis of the HL-60 architecture
Robustness coefficients of the form:
| (8) |
were calculated to understand the regulatory connectedness of the HL-60 network. The robustness coefficient α(i,j,t0,tf) is the ratio of the integrated concentration of a network output in the presence (numerator) and absence (denominator) of structural or operational perturbation. Here t0 and tf denote the initial and final simulation time, respectively. The network output was taken to be the network states. The quantity i denotes the index for a marker or reference species while j denotes the perturbation index, respectively. If α(i,j,t0,tf)>1, then the perturbation increases the output concentration. Conversely, if α(i,j,t0,tf) ≪ 1 the perturbation decreases the output concentration. Lastly, if α(i,j,t0,tf) ~1 the perturbation does not influence the output concentration. Because of computational constraints, we calculated the robustness coefficients using a sub-ensemble (N = 47) selected from the full ensemble (N = 100). The sub-ensemble had a CV distribution similar to the full ensemble (Fig. 2B, circles). While we sampled a sub-ensemble, this subset had a diversity similar to the full ensemble. Thus, we expect results calculated using the sub-ensemble will be similar to the full ensemble.
5.6 Species clustering and dendrogram
A dendrogram was derived by considering each of the 106 knockouts as variables and the average log of robustness coefficient (LRC) for each of the remaining 728 species as observations. We used the Euclidean norm in LRC space as the distance metric. The linkage function (objective function for identifying variable clusters) was the inner squared distance (minimum variance algorithm). The Statistical Toolbox of Matlab (The Mathworks, Natick, MA) was used to generate the distances, linkages and the final dendrogram.
5.7 Identification of distinguishable species
Robustness coefficients were used to rank-order knockout experiments in terms of the greatest unique responses and to identify species (network nodes) which were linearly distinguishable. As described above, 106 in silico knockouts were performed. The response of these knockouts was measured in terms of robustness coefficients. Here we considered the log of the robustness coefficients (LRC) as the primary metric formeasuring response. The LRC has desirable linear properties, such that no response (no change in trajectories from wildtype) returns a value of zero and similar negative and positive responses have different directions but similar magnitudes:
We considered the unique component of the response to be the orthogonal component in LRC space and the magnitude of the response to be the Euclidean norm. The orthogonal components and their magnitude were identified for each parameter set in the ensemble by first choosing the knockout with the greatest magnitude, x1, and placing it in the empty set V. The knockout x1 defines the orthogonal directions in LRC space. We then calculated the orthogonal components for all remaining knockouts relative to x1, and added the knockout species with the greatest orthogonal magnitude to set V. In general, the components of all remaining xi orthogonal to set V were calculated and the largest was moved into set V. This process was continued until all knockout species, xi were added to set V. Mathematically, two species were considered distinguishable if, and only if, they were linearly independent (the orthogonal components were non-zero). We considered a threshold value of one or five and performed a student t-test (Matlab Statistical Toolbox, The Mathworks, Natick, MA) to identify which species had orthogonal components above the threshold with a 95% confidence over the ensemble.
Supplementary Material
Insight, innovation, integration.
A molecular understanding of cellular differentiation programs represents an unmet medical challenge. A major barrier in this pursuit is the complexity and scale of the protein interaction networks involved. In this study, we integrated computational and experimental strategies to unravel the differentiation program of the uncommitted hematopoietic precursor cell HL-60. We used experimental results to generate an ensemble of mathematical models. The analysis demonstrated the sufficiency of an experimentally suggested BLR1/MAPK control architecture to recapitulate features of retinoic acid induced differentiation. In silico robustness analysis provided insight on critical species which may be valuable experimental targets. This work presents a computational framework for the integration of experimental data and hypothesis-generation using a novel, molecular level, differentiation model.
Acknowledgments
We acknowledge the gracious financial support of R.T. by a National Science Foundation IGERT Non-linear Systems Fellowship and the National Science Foundation CAREER (NSF #CBET-0846876) to J.V. for the support of R.T. We also acknowledge the generous financial support of the Office of Naval Research (ONR #N000140610293) to J.V. for the support of S.N. Lastly, we gratefully acknowledge support from the National Institutes of Health (NIH R01 #CA030555) and a New York State NYSTEM Dept. of Health grant to A.Y.
Footnotes
Electronic supplementary information (ESI) available. See DOI: 10.1039/c0ib00141d
References
- 1.Chen X, Xu H, Yuan P, Fang F, Huss M, Vega VB, Wong E, Orlov YL, Zhang W, Jiang J, Loh YH, Yeo HC, Yeo ZX, Narang V, Govindarajan KR, Leong B, Shahab A, Ruan Y, Bourque G, Sung WK, Clarke ND, Wei CL, Ng HH. Cell. 2008;133:1106–17. doi: 10.1016/j.cell.2008.04.043. [DOI] [PubMed] [Google Scholar]
- 2.Collins SJ, Gallo RC, Gallagher RE. Nature. 1977;270:347–349. doi: 10.1038/270347a0. [DOI] [PubMed] [Google Scholar]
- 3.Breitman TR, Selonick SE, Collins SJ. Proc Natl Acad Sci U S A. 1980;77:2936–2940. doi: 10.1073/pnas.77.5.2936. [DOI] [PMC free article] [PubMed] [Google Scholar]
- 4.Yen A. Hematology Review. 1990;4:5–46. [Google Scholar]
- 5.Yen A, Roberson MS, Varvayanis S, Lee AT. Cancer Res. 1998;58:3163–72. [PubMed] [Google Scholar]
- 6.Yen A, Sturgill R, Varvayanis S. In Vitro Cellular & Developmental Biology - Animal. 2000;36:249–255. doi: 10.1290/1071-2690(2000)036<0249:raiaop>2.0.co;2. [DOI] [PubMed] [Google Scholar]
- 7.Hong HY, Varvayanis S, Yen A. Differentiation. 2001;68:55–66. doi: 10.1046/j.1432-0436.2001.068001055.x. [DOI] [PubMed] [Google Scholar]
- 8.Wang X, Studzinski GP. J Cell Biochem. 2001;80:471–482. doi: 10.1002/1097-4644(20010315)80:4<471::aid-jcb1001>3.0.co;2-j. [DOI] [PubMed] [Google Scholar]
- 9.Yen A, Reece SL, Albright KL. J Cell Physiol. 1984;118:277–286. doi: 10.1002/jcp.1041180310. [DOI] [PubMed] [Google Scholar]
- 10.Yen A, Forbes M, deGala G, Fishbaugh J. Cancer Res. 1987;47:129–134. [PubMed] [Google Scholar]
- 11.Yen A, Brown D, Fishbaugh J. Exp Cell Res. 1987;173:80–84. doi: 10.1016/0014-4827(87)90333-8. [DOI] [PubMed] [Google Scholar]
- 12.Yen A, Forbes ME. Cancer Res. 1990;50:1411–1420. [PubMed] [Google Scholar]
- 13.Yen A, Cherington V, Schaffhausen B, Markes K, Varvayanis S. Exp Cell Res. 1991;248:538–551. doi: 10.1006/excr.1999.4423. [DOI] [PubMed] [Google Scholar]
- 14.Battle TE, Levine RA, Yen A. Exp Cell Res. 2000;254:287–298. doi: 10.1006/excr.1999.4766. [DOI] [PubMed] [Google Scholar]
- 15.Yen A, Norman AW, Varvayanis S. In Vitro Cellular & Developmental Biology - Animal. 2001;37:93–99. doi: 10.1290/1071-2690(2001)037<0093:NVDAAE>2.0.CO;2. [DOI] [PubMed] [Google Scholar]
- 16.Battle TE, Roberson MS, Zhang T, Varvayanis S, Yen A. Eur J Cell Biol. 2001;80:59–67. doi: 10.1078/0171-9335-00141. [DOI] [PubMed] [Google Scholar]
- 17.Dobner T, Wolf I, Emrich T, Lipp M. Eur J Immunol. 1992;22:2795–2799. doi: 10.1002/eji.1830221107. [DOI] [PubMed] [Google Scholar]
- 18.Emrich T, Forster R, Lipp M. Cell Mol Biol. 1994;40:413–419. [PubMed] [Google Scholar]
- 19.Mangelsdorf DJ, Kazaukiko U, Evans RM. The retinoid receptors. 2 Raven Press; 1994. [Google Scholar]
- 20.Wang J, Yen A. Mol Cell Biol. 2004;24:2423–2443. doi: 10.1128/MCB.24.6.2423-2443.2004. [DOI] [PMC free article] [PubMed] [Google Scholar]
- 21.Wang J, Yen A. J Biol Chem. 2008;283:4375–4386. doi: 10.1074/jbc.M708471200. [DOI] [PubMed] [Google Scholar]
- 22.Assmus HE, Herwig R, Cho KH, Wolkenhauer O. Expert Rev Mol Diagn. 2006;6:891–902. doi: 10.1586/14737159.6.6.891. [DOI] [PubMed] [Google Scholar]
- 23.Arnaud CA. Chem Eng News. 2006;84:17–26. [Google Scholar]
- 24.Kitano H. Nature. 2002;420:206–10. doi: 10.1038/nature01254. [DOI] [PubMed] [Google Scholar]
- 25.Huang CY, Ferrell JE. Proc Natl Acad Sci U S A. 1996;93:10078–10083. doi: 10.1073/pnas.93.19.10078. [DOI] [PMC free article] [PubMed] [Google Scholar]
- 26.Fussenegger M, Bailey JE, Varner J. Nat Biotechnol. 2000;18:768–774. doi: 10.1038/77589. [DOI] [PubMed] [Google Scholar]
- 27.Schoeberl B, Eichler-Jonsson C, Gilles ED, Müller G. Nat Biotechnol. 2002;20:370–5. doi: 10.1038/nbt0402-370. [DOI] [PubMed] [Google Scholar]
- 28.Stelling J, Gilles ED, Doyle F., Jr Proc Natl Acad Sci U S A. 2004;101:13210–13215. doi: 10.1073/pnas.0401463101. [DOI] [PMC free article] [PubMed] [Google Scholar]
- 29.Queralt E, Lehane C, Novak B, Uhlmann F. Cell. 2006;125:719–732. doi: 10.1016/j.cell.2006.03.038. [DOI] [PubMed] [Google Scholar]
- 30.Li H, Ung CY, Ma XH, Liu XH, Li BW, Low BC, Chen YZ. Cancer. 2009;115:4246–4263. doi: 10.1002/cncr.24485. [DOI] [PubMed] [Google Scholar]
- 31.Stites EC, Trampont PC, Ma Z, Ravichandran KS. Science. 2007;318:463–467. doi: 10.1126/science.1144642. [DOI] [PubMed] [Google Scholar]
- 32.Luan D, Zai M, Varner JD. PLoS Comput Biol. 2007;3:e142. doi: 10.1371/journal.pcbi.0030142. [DOI] [PMC free article] [PubMed] [Google Scholar]
- 33.Song SO, Varner J. PLoS One. 2009;4:e6758. doi: 10.1371/journal.pone.0006758. [DOI] [PMC free article] [PubMed] [Google Scholar]
- 34.Chen WW, Schoeberl B, Jasper PJ, Niepel M, Nielsen UB, Lauffenburger DA, Sorger PK. Mol Syst Biol. 2009;5:239. doi: 10.1038/msb.2008.74. [DOI] [PMC free article] [PubMed] [Google Scholar]
- 35.Klinke DJ., 2nd Cancer Res. 2010;70:1773–82. doi: 10.1158/0008-5472.CAN-09-3234. [DOI] [PMC free article] [PubMed] [Google Scholar]
- 36.Tasseff R, Nayak S, Salim S, Kaushik P, Rizvi N, Varner JD. PLoS One. 2010;5:e8864. doi: 10.1371/journal.pone.0008864. [DOI] [PMC free article] [PubMed] [Google Scholar]
- 37.Fields S, Sternglanz R. Trends Genet. 1994;10:282–292. doi: 10.1016/0168-9525(90)90012-u. [DOI] [PubMed] [Google Scholar]
- 38.Cagney G, Uetz P, Fields S. Methods Enzymol. 2000;328:3–14. doi: 10.1016/s0076-6879(00)28386-9. [DOI] [PubMed] [Google Scholar]
- 39.Uetz P, Giot L, Cagney G, Mansfield TA, Judson RS, Knight JR, Lockshon D, Narayan V, Srinivasan M, Pochart P, Qureshi-Emili A, Li Y, Godwin B, Conover D, Kalbfleisch T, Vijayadamodar G, Yang M, Johnston M, Fields S, Rothberg JM. Nature. 2000;420:623–627. doi: 10.1038/35001009. [DOI] [PubMed] [Google Scholar]
- 40.Ito T, Chiba T, Ozawa R, Yoshida M, Hattori M, Sakaki Y. Proc Natl Acad Sci U S A. 2001;98:4569–4574. doi: 10.1073/pnas.061034498. [DOI] [PMC free article] [PubMed] [Google Scholar]
- 41.You X, Nguyen AW, Jabaiah A, Sheff MA, Thorn KS, Daugherty PS. Proc Natl Acad Sci U S A. 2006;103:18458–18463. doi: 10.1073/pnas.0605422103. [DOI] [PMC free article] [PubMed] [Google Scholar]
- 42.Farmer TB, Caprioli RM. J Mass Spectrom. 1998;33:697–704. doi: 10.1002/(SICI)1096-9888(199808)33:8<697::AID-JMS711>3.0.CO;2-H. [DOI] [PubMed] [Google Scholar]
- 43.Gavin A, Bosche M, Krause R, Grandi P, Marzioch M, Bauer A, Schultz J, Rick J, Michon A, CC, et al. Nature. 2002;415:141–147. doi: 10.1038/415141a. [DOI] [PubMed] [Google Scholar]
- 44.Ho Y, Gruhler A, Heilbut A, Bader G, Moore L, Adams S, Millar A, Taylor P, Bennett K, Ba K, et al. Nature. 2002;415:180–183. doi: 10.1038/415180a. [DOI] [PubMed] [Google Scholar]
- 45.Lee TI, Rinaldi NJ, Robert F, Odom DT, Bar-Joseph Z, Gerber GK, Hannett NM, Harbison CT, Thompson C, Simon I, Zeitlinger J, Jennings E, Murray H, Gordon DB, Ren B, Wyrick J, Tagne JB, Volkert T, Fraenkel E, Gifford D, Young RA. Science. 2002;298:799–804. doi: 10.1126/science.1075090. [DOI] [PubMed] [Google Scholar]
- 46.Fields S. FEBS J. 2005;272:5391–5399. doi: 10.1111/j.1742-4658.2005.04973.x. [DOI] [PubMed] [Google Scholar]
- 47.von Mering C, Krause R, Snel B, Cornell M, Oliver SG, Fields S, Bork P. Nature. 2002;417:399–403. doi: 10.1038/nature750. [DOI] [PubMed] [Google Scholar]
- 48.Milo R, Shen-Orr S, Itzkovitz S, Kashtan N, Chklovskii D, Alon U. Science. 2002;298:824–827. doi: 10.1126/science.298.5594.824. [DOI] [PubMed] [Google Scholar]
- 49.Yeger-Lotem E, Sattath S, Kashtan N, Itzkovitz S, Milo R, Pinter RY, Alon U, Margalit H. Proc Natl Acad Sci U S A. 2004;101:5934–9. doi: 10.1073/pnas.0306752101. [DOI] [PMC free article] [PubMed] [Google Scholar]
- 50.Kashtan N, Itzkovitz S, Milo R, Alon U. Phys Rev E: Stat, Nonlinear, Soft Matter Phys. 2004;70:031909. doi: 10.1103/PhysRevE.70.031909. [DOI] [PubMed] [Google Scholar]
- 51.Yeung MKS, Tegnér J, Collins JJ. Proc Natl Acad Sci U S A. 2002;99:6163–8. doi: 10.1073/pnas.092576199. [DOI] [PMC free article] [PubMed] [Google Scholar]
- 52.Tegner J, Yeung MKS, Hasty J, Collins JJ. Proc Natl Acad Sci U S A. 2003;100:5944–9. doi: 10.1073/pnas.0933416100. [DOI] [PMC free article] [PubMed] [Google Scholar]
- 53.Gupta A, Varner J, Maranas C. Comput Chem Eng. 2005;29:565–576. [Google Scholar]
- 54.Locasale JW, Wolf-Yadlin A. PLoS One. 2009;4:e6522. doi: 10.1371/journal.pone.0006522. [DOI] [PMC free article] [PubMed] [Google Scholar]
- 55.Ananiadou S, Kell DB, Tsujii Ji. Trends Biotechnol. 2006;24:571–9. doi: 10.1016/j.tibtech.2006.10.002. [DOI] [PubMed] [Google Scholar]
- 56.Jensen LJ, Kuhn M, Stark M, Chaffron S, Creevey C, Muller J, Doerks T, Julien P, Roth A, Simonovic M, Bork P, von Mering C. Nucleic Acids Res. 2009;37:D412–6. doi: 10.1093/nar/gkn760. [DOI] [PMC free article] [PubMed] [Google Scholar]
- 57.Linding R, Jensen LJ, Ostheimer GJ, van Vugt MATM, Jørgensen C, Miron IM, Diella F, Colwill K, Taylor L, Elder K, Metalnikov P, Nguyen V, Pasculescu A, Jin J, Park JG, Samson LD, Woodgett JR, Russell RB, Bork P, Yaffe MB, Pawson T. Cell. 2007;129:1415–26. doi: 10.1016/j.cell.2007.05.052. [DOI] [PMC free article] [PubMed] [Google Scholar]
- 58.Linding R, Jensen LJ, Pasculescu A, Olhovsky M, Colwill K, Bork P, Yaffe MB, Pawson T. Nucleic Acids Res. 2008;36:D695–9. doi: 10.1093/nar/gkm902. [DOI] [PMC free article] [PubMed] [Google Scholar]
- 59.Aoki-Kinoshita KF, Kanehisa M. Methods Mol Biol. 2007;396:71–91. doi: 10.1007/978-1-59745-515-2_6. [DOI] [PubMed] [Google Scholar]
- 60.Kanehisa M, Araki M, Goto S, Hattori M, Hirakawa M, Itoh M, Katayama T, Kawashima S, Okuda S, Tokimatsu T, Yamanishi Y. Nucleic Acids Res. 2008;36:D480–4. doi: 10.1093/nar/gkm882. [DOI] [PMC free article] [PubMed] [Google Scholar]
- 61.Okuda S, Yamada T, Hamajima M, Itoh M, Katayama T, Bork P, Goto S, Kanehisa M. Nucleic Acids Res. 2008;36:W423–6. doi: 10.1093/nar/gkn282. [DOI] [PMC free article] [PubMed] [Google Scholar]
- 62.Ciaccio MF, Wagner JP, Chuu CP, Lauffenburger DA, Jones RB. Nat Methods. 2010;7:148–155. doi: 10.1038/nmeth.1418. [DOI] [PMC free article] [PubMed] [Google Scholar]
- 63.Bilsland AE, Hoare S, Stevenson K, Plumb J, Gomez-Roman N, Cairney C, Burns S, Lafferty-Whyte K, Roffey J, Hammonds T, Keith WN. PLoS One. 2009;4:e6459. doi: 10.1371/journal.pone.0006459. [DOI] [PMC free article] [PubMed] [Google Scholar]
- 64.Fujita KA, Toyoshima Y, Uda S, ichi Ozaki Y, Kubota H, Kuroda S. Sci Signaling. 2010;3:ra56. doi: 10.1126/scisignal.2000810. [DOI] [PubMed] [Google Scholar]
- 65.Mullassery D, Horton CA, Wood CD, White MRH. Essays Biochem. 2008;45:121–133. doi: 10.1042/BSE0450121. [DOI] [PMC free article] [PubMed] [Google Scholar]
- 66.Talbot CB, McGinty J, Grant DM, McGhee EJ, Owen DM, Zhang W, Bunney TD, Munro I, Isherwood B, Eagle R, Hargreaves A, Dunsby C, Neil MAA, French PMW. J Biophotonics. 2008;1:514–521. doi: 10.1002/jbio.200810054. [DOI] [PubMed] [Google Scholar]
- 67.Pedrioli PGA, Eng JK, Hubley R, Vogelzang M, Deutsch EW, Raught B, Pratt B, Nilsson E, Angeletti RH, Apweiler R, Cheung K, Costello CE, Hermjakob H, Huang S, Julian RK, Kapp E, McComb ME, Oliver SG, Omenn G, Paton NW, Simpson R, Smith R, Taylor CF, Zhu W, Aebersold R. Nat Biotechnol. 2004;22:1459–1466. doi: 10.1038/nbt1031. [DOI] [PubMed] [Google Scholar]
- 68.Kumar N, Wolf-Yadlin A, White FM, Lauffenburger DA. PLoS Comput Biol. 2007;3:e4. doi: 10.1371/journal.pcbi.0030004. [DOI] [PMC free article] [PubMed] [Google Scholar]
- 69.Huang E, Ishida S, Pittman J, Dressman H, Bild A, Kloos M, D’Amico M, Pestell RG, West M, Nevins JR. Nat Genet. 2003;34:226–230. doi: 10.1038/ng1167. [DOI] [PubMed] [Google Scholar]
- 70.Hwang KB, Kong SW, Greenberg SA, Park PJ. BMC Bioinformatics. 2004;5:159. doi: 10.1186/1471-2105-5-159. [DOI] [PMC free article] [PubMed] [Google Scholar]
- 71.Kirouac DC, Ito C, Csaszar E, Roch A, Yu M, Sykes EA, Bader GD, Zandstra PW. Mol Syst Biol. 2010;6:417. doi: 10.1038/msb.2010.71. [DOI] [PMC free article] [PubMed] [Google Scholar]
- 72.Choi C, Krull M, Kel A, Kel-Margoulis O, Pistor S, Potapov A, Voss N, Wingender E. Comp Funct Genomics. 2004;5:163–8. doi: 10.1002/cfg.386. [DOI] [PMC free article] [PubMed] [Google Scholar]
- 73.Mangelsdorf DJ, Ong ES, Dyck JA, Evans RM. Nature. 1990;345:224–229. doi: 10.1038/345224a0. [DOI] [PubMed] [Google Scholar]
- 74.Kaiser E, Förster R, Wolf I, Ebensperger C, Kuehl WM, Lipp M. Eur J Immunol. 1993;23:2532–9. doi: 10.1002/eji.1830231023. [DOI] [PubMed] [Google Scholar]
- 75.Forster R, Wolf I, Kaiser E, Lipp M. Cell Mol Biol. 1994;40:381–387. [PubMed] [Google Scholar]
- 76.Kolch W, Heidecker G, Kochs G, Hummel R, Vahidi H, Mischak H, Finkenzeller G, Marme D, Rapp UR. Nature. 1993;364:249–252. doi: 10.1038/364249a0. [DOI] [PubMed] [Google Scholar]
- 77.Yang TTC, Xiong Q, Enslen H, Davis RJ, Chow CW. Mol Cell Biol. 2002;22:3892–904. doi: 10.1128/MCB.22.11.3892-3904.2002. [DOI] [PMC free article] [PubMed] [Google Scholar]
- 78.Vivanco I, Sawyers CL. Nat Rev Cancer. 2002;2:489–501. doi: 10.1038/nrc839. [DOI] [PubMed] [Google Scholar]
- 79.Richter JD, Sonenberg N. Nature. 2005;433:477–480. doi: 10.1038/nature03205. [DOI] [PubMed] [Google Scholar]
- 80.Nayak S, Siddiqui J, Varner J. IET Syst Biol. 2011;5:2–14. doi: 10.1049/iet-syb.2009.0065. [DOI] [PubMed] [Google Scholar]
- 81.Nayak S, Salim S, Luan D, Zai M, Varner JD. PLoS One. 2008;3:e2016. doi: 10.1371/journal.pone.0002016. [DOI] [PMC free article] [PubMed] [Google Scholar]
- 82.Tsuchiya M, Tsuchyia M, Wong ST, Yeo ZX, Colosimo A, Palumbo MC, Farina L, Crescenzi M, Mazzola A, Negri R, Bianchi MM, Selvarajoo K, Tomita M, Giuliani A. FEBS J. 2007;274:2878–2886. doi: 10.1111/j.1742-4658.2007.05822.x. [DOI] [PubMed] [Google Scholar]
- 83.Goryachev AB, Toh DJ, Wee KB, Lee T, Zhang HB, Zhang LH. PLoS Comput Biol. 2005;1:e37. doi: 10.1371/journal.pcbi.0010037. [DOI] [PMC free article] [PubMed] [Google Scholar]
- 84.Asthagiri AR, Lauffenburger DA. Biotechnol Prog. 2001;17:227–239. doi: 10.1021/bp010009k. [DOI] [PubMed] [Google Scholar]
- 85.Brown KS, Hill CC, Calero GA, Myers CR, Lee KH, Sethna JP, Cerione RA. Phys Biol. 2004;1:184–95. doi: 10.1088/1478-3967/1/3/006. [DOI] [PubMed] [Google Scholar]
- 86.Mayawala K, Gelmi CA, Edwards JS. Biophys J. 2004;87:L01–2. doi: 10.1529/biophysj.104.051888. [DOI] [PMC free article] [PubMed] [Google Scholar]
- 87.Hornberg JJ, Binder B, Bruggeman FJ, Schoeberl B, Heinrich R, Westerhoff HV. Oncogene. 2005;24:5533–42. doi: 10.1038/sj.onc.1208817. [DOI] [PubMed] [Google Scholar]
- 88.Gadkar KG, Varner J, Doyle FJ. IEE Proc: Syst Biol. 2005;2:17–30. doi: 10.1049/sb:20045029. [DOI] [PubMed] [Google Scholar]
- 89.Gennemark P, Wedelin D. Bioinformatics. 2009;25:780–6. doi: 10.1093/bioinformatics/btp050. [DOI] [PMC free article] [PubMed] [Google Scholar]
- 90.Bandara S, Schlöder J, Eils R, Bock HG, Meyer T. PLoS Comput Biol. 2009;5:e1000558. doi: 10.1371/journal.pcbi.1000558. [DOI] [PMC free article] [PubMed] [Google Scholar]
- 91.Battogtokh D, Asch D, Case M, Arnold J, Shüttler HB. Proc Natl Acad Sci U S A. 2002;99:16904–16909. doi: 10.1073/pnas.262658899. [DOI] [PMC free article] [PubMed] [Google Scholar]
- 92.Yen A, Williams M, Platko JD, Der C, Hisaka M. Eur J Cell Biol. 1994;65:103–113. [PubMed] [Google Scholar]
- 93.Yen A, Lin DM, Lamkin TJ, Varvayanis S. In Vitro Cellular & Developmental Biology - Animal. 2004;40:216–241. doi: 10.1290/1543-706X(2004)40<216:RABATM>2.0.CO;2. [DOI] [PubMed] [Google Scholar]
- 94.Collins SJ, Ruscetti FW, Gallagher RE, Gallo RC. J Exp Med. 1979;149:969–74. doi: 10.1084/jem.149.4.969. [DOI] [PMC free article] [PubMed] [Google Scholar]
- 95.Carlson JM, Doyle J. Proc Natl Acad Sci U S A. 2002;99 doi: 10.1073/pnas.261714399. [DOI] [PMC free article] [PubMed] [Google Scholar]
- 96.Yang N, Schüle R, Mangelsdorf DJ, Evans RM. Proc Natl Acad Sci U S A. 1991;88:3559–63. doi: 10.1073/pnas.88.9.3559. [DOI] [PMC free article] [PubMed] [Google Scholar]
- 97.Yen A, Roberson MS, Varvayanis S, Lee AT. Cancer Res. 1998;58:3163–3172. [PubMed] [Google Scholar]
- 98.Barabsi AL, Oltvai ZN. Nat Rev Genet. 2004;5:101–113. doi: 10.1038/nrg1272. [DOI] [PubMed] [Google Scholar]
- 99.Jeong H, Mason SP, Barabsi AL, Oltvai ZN. Nature. 2001;411:41–42. doi: 10.1038/35075138. [DOI] [PubMed] [Google Scholar]
- 100.Hahn MW, Conant GC, Wagner A. J Mol Evol. 2004;58:203–211. doi: 10.1007/s00239-003-2544-0. [DOI] [PubMed] [Google Scholar]
- 101.Valente AXCN, Cusick ME. Nucleic Acids Res. 2006;34:2812–2819. doi: 10.1093/nar/gkl325. [DOI] [PMC free article] [PubMed] [Google Scholar]
- 102.Hase T, Tanaka H, Suzuki Y, Nakagawa S, Kitano H. PLoS Comput Biol. 2009;5:e1000550. doi: 10.1371/journal.pcbi.1000550. [DOI] [PMC free article] [PubMed] [Google Scholar]
- 103.Kuepfer L, Peter M, Sauer U, Stelling J. Nat Biotechnol. 2007;25:1001–1006. doi: 10.1038/nbt1330. [DOI] [PubMed] [Google Scholar]
- 104.Brown KS, Sethna JP. Phys Rev E: Stat Phys, Plasmas, Fluids, Relat Interdiscip Top. 2003;68:021904. [Google Scholar]
- 105.Palmer T, Shutts G, Hagedorn R, Doblas-Reyes F, Jung Y, Leutbecher M. Annu Rev Earth Planet Sci. 2005;33:163–193. [Google Scholar]
- 106.Gutenkunst RN, Waterfall JJ, Casey FP, Brown KS, Myers CR, Sethna JP. PLoS Comput Biol. 2007;3:1871–78. doi: 10.1371/journal.pcbi.0030189. [DOI] [PMC free article] [PubMed] [Google Scholar]
- 107.Brooks SC, Kazmer S, Levin AA, Yen A. Blood. 1996;87:227–237. [PubMed] [Google Scholar]
- 108.Wilkinson MG, Millar JB. FASEB J. 2000;14:2147–2157. doi: 10.1096/fj.00-0102rev. [DOI] [PubMed] [Google Scholar]
- 109.Ohtani K, DeGregori J, Nevins JR. Proc Natl Acad Sci U S A. 1995;92:12146–12150. doi: 10.1073/pnas.92.26.12146. [DOI] [PMC free article] [PubMed] [Google Scholar]
Associated Data
This section collects any data citations, data availability statements, or supplementary materials included in this article.