

Abstract
Many natural sounds are periodic and consist of frequencies (harmonics) that are integer multiples of a common fundamental frequency (F0). Such harmonic complex tones (HCTs) evoke a pitch corresponding to their F0, which plays a key role in the perception of speech and music. “Pitch-selective” neurons have been identified in non-primary auditory cortex of marmoset monkeys. Noninvasive studies point to a putative “pitch center” located in a homologous cortical region in humans. It remains unclear whether there is sufficient spectral and temporal information available at the level of primary auditory cortex (A1) to enable reliable pitch extraction in non-primary auditory cortex. Here we evaluated multiunit responses to HCTs in A1 of awake macaques using a stimulus design employed in auditory nerve studies of pitch encoding. The F0 of the HCTs was varied in small increments, such that harmonics of the HCTs fell either on the peak or on the sides of the neuronal pure tone tuning functions. Resultant response-amplitude-versus-harmonic-number functions (“rate-place profiles”) displayed a periodic pattern reflecting the neuronal representation of individual HCT harmonics. Consistent with psychoacoustic findings in humans, lower harmonics were better resolved in rate-place profiles than higher harmonics. Lower F0s were also temporally represented by neuronal phase-locking to the periodic waveform of the HCTs. Findings indicate that population responses in A1 contain sufficient spectral and temporal information for extracting the pitch of HCTs by neurons in downstream cortical areas that receive their input from A1.
Introduction
Human speech and many animal vocalizations contain periodic sounds consisting of frequencies (harmonics) that are integer multiples of a common fundamental frequency (F0). Such harmonic complex tones (HCTs) are heard as a single sound with a pitch corresponding to the F0. This “fundamental pitch,” which plays an important role in speech and music perception, persists even when spectral energy at the F0 is absent (Fig. 1). Hence, the pitch of HCTs is derived not from the detection of spectral energy at the F0, but rather from a process that recognizes the harmonic spectrum of HCTs (Fig. 1A), or the periodicity in their temporal waveform envelope (Fig. 1B). Indeed, behavioral findings in humans and nonhuman primates suggest that both spectral and temporal cues are used in pitch perception (Plack et al., 2005; Bendor et al., 2012).
Figure 1.

Pitch of the missing fundamental. A, Schematic illustration of the spectral content of three stimuli that elicit the same pitch: a pure tone (left column), an HCT (center column), and an HCT missing the F0 (right column). Frequency and time are represented along the vertical and horizontal axes, respectively. Frequency components of the stimuli are represented by the horizontal bars. While comprised of many components (harmonics) with frequencies corresponding to an integer multiple of the F0, an HCT is typically perceived as having a single pitch corresponding to that of a pure tone with a frequency equal to the F0 of the HCT. The pitch at the F0 persists even when spectral energy at the F0 is absent (right column; horizontal dashed line). B, Corresponding temporal waveforms of the stimuli shown in A. Waveforms of all three stimuli exhibit a periodicity that repeats at a rate equal to their F0.
Lesion studies indicate that primary auditory cortex (A1) and surrounding auditory cortical areas are necessary for accurate pitch perception (Whitfield, 1980; Zatorre, 1988; Tramo et al., 2002). However, neurophysiological studies in monkeys demonstrate that A1 responses reflect the spectral content rather than the pitch of HCTs (Schwarz and Tomlinson, 1990; Fishman et al., 1998), thus suggesting that pitch extraction occurs outside of A1. Indeed, “pitch-selective” neurons have been identified in a region immediately anterior and lateral to A1 in marmoset auditory cortex (Bendor and Wang, 2005). Correspondingly, noninvasive studies in humans support the existence of a homologous “pitch center” in non-primary auditory cortex located in anterolateral Heschl's gyrus (for a recent review, see Griffiths and Hall, 2012). Together, these findings imply a convergence of spectral and temporal information related to pitch in non-primary auditory cortex. The mechanisms by which pitch-selective neurons obtain this information and acquire their properties are still poorly understood (Wang and Walker, 2012). Auditory cortical fields located immediately adjacent to A1 receive major inputs from A1 (Morel et al., 1993; Hackett et al., 1998; de la Mothe et al., 2006). Therefore, it seems likely that pitch-selective neurons extract the F0 based, at least in part, on spectral and temporal cues represented in A1. However, it remains unclear whether A1 represents the harmonic spectrum and temporal envelope of HCTs with sufficient resolution and over a sufficiently broad range of F0s to support pitch perception.
Here we examine multiunit responses to HCTs in A1 of awake macaques using a stimulus design employed in auditory-nerve studies of pitch encoding (Cedolin and Delgutte, 2005). We find that neural populations in A1 represent the harmonic spectrum of HCTs (via a rate-place code) and their temporal envelope (via phase-locked responses) with sufficient resolution to enable the extraction (e.g., via “harmonic templates” or “periodicity detectors”) of the full range of F0s characteristic of human pitch perception. Our findings thus support hierarchical models of pitch extraction whereby A1 supplies essential pitch-related information to neurons in non-primary auditory cortex (Kumar et al., 2011; Kumar and Schönwiesner, 2012).
Materials and Methods
Two adult male macaque monkeys (Macaca fascicularis) were studied using previously described methods (Steinschneider et al., 2003; Fishman and Steinschneider, 2010). All experimental procedures were reviewed and approved by the Association for Assessment and Accreditation of Laboratory Animal Care International (AAALAC)-accredited Animal Institute of Albert Einstein College of Medicine and were conducted in accordance with institutional and federal guidelines governing the experimental use of primates. Animals were housed in our AAALAC-accredited Animal Institute under daily supervision of laboratory and veterinary staff. Before surgery, monkeys were acclimated to the recording environment and trained to perform a simple auditory discrimination task (see below) while sitting in custom-fitted primate chairs.
Surgical procedure.
Under pentobarbital anesthesia and using aseptic techniques, rectangular holes were drilled bilaterally into the dorsal skull to accommodate matrices composed of 18-gauge stainless steel tubes glued together in parallel. Tubes served to guide electrodes toward A1 for repeated intracortical recordings. Matrices were stereotaxically positioned to target A1 and were oriented to direct electrode penetrations perpendicular to the dorsal surface of the superior temporal gyrus, thereby satisfying one of the major technical requirements of one-dimensional current source density (CSD) analysis (Müller-Preuss and Mitzdorf, 1984; Steinschneider et al., 1992). Matrices and Plexiglas bars, used for painless head fixation during the recordings, were embedded in a pedestal of dental acrylic secured to the skull with inverted bone screws. Perioperative and postoperative antibiotic and anti-inflammatory medications were always administered. Recordings began after at least 2 weeks of postoperative recovery.
Pure tone and harmonic complex tone stimuli.
Stimuli were generated and delivered at a sample rate of 48.8 kHz by a PC-based system using an RX8 module (Tucker Davis Technologies). Frequency response functions (FRFs) based on pure tone responses characterized the spectral tuning of the cortical sites. Pure tones used to generate the FRFs ranged from 0.15 to 18.0 kHz, were 200 ms in duration (including 10 ms linear rise/fall ramps), and were randomly presented at 60 dB SPL with a stimulus onset-to-onset interval of 658 ms. Resolution of FRFs was 0.25 octaves or finer across the 0.15–18.0 kHz frequency range tested. Responses to 20–24 tones of different frequency were used to generate each FRF.
All stimuli were presented via a free-field speaker (Microsatellite; Gallo, Inc.) located 60° off the midline in the field contralateral to the recorded hemisphere and 1 m away from the animal's head (Crist Instruments). Sound intensity was measured with a sound level meter (type 2236; Bruel and Kjaer) positioned at the location of the animal's ear. The frequency response of the speaker was essentially flat (within ±5 dB SPL) over the frequency range tested.
Rate-place and temporal representations of the F0s of HCTs were evaluated using a stimulus design employed in auditory-nerve studies (Cedolin and Delgutte, 2005; Larsen et al., 2008). At each recording site, 89 HCTs with different F0s were presented in random order. HCTs were comprised of 12 equal-amplitude harmonics, each presented at 60 dB SPL, and added together in sine phase. When all harmonics fell within the flat frequency range of the speakers (0.15–18.0 kHz), the overall level of the HCTs was ∼71 dB SPL. HCTs were 225 ms in duration (including 10 ms linear rise/fall ramps). The particular F0s of the 89 HCTs were determined by the best frequency (BF) of the recording site, as defined below. The F0 of the HCTs was varied in small increments, such that the BF of the recording site occupied harmonic number positions 1 through 12 in one-eighth harmonic-number increments. The relationship between the frequency tuning of the site and spectral components of the HCT stimuli is schematically illustrated in Figure 2. The stimulus set was configured such that the HCT with the highest F0 had its lowest (first) harmonic (i.e., F0) set equal to the BF of the site, whereas the HCT with the lowest F0 had its highest (12th) harmonic set equal to the BF. Sampling at increments of one-eighth harmonic number yielded rate-place profiles (described below) with sufficient resolution to discern peaks in neural activity patterns corresponding to individual harmonics of the HCTs.
Figure 2.
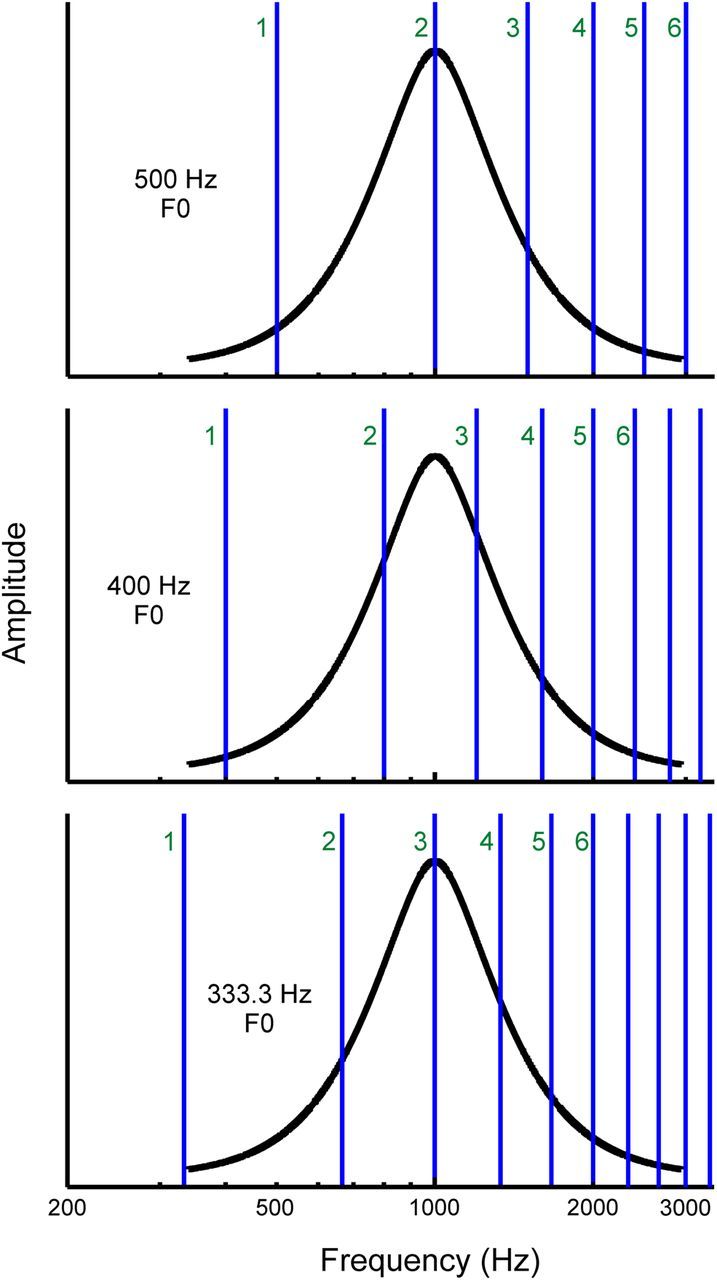
Schematic illustration of the HCT stimuli presented in the study. Stimulus amplitude and frequency are represented along the vertical and horizontal axes, respectively. The F0 of the HCTs is varied such that harmonics (vertical blue lines) fall either on the peak (at the BF, here equal to 1000 Hz) or on the sides of the neuronal FRF (black curve). This is equivalent to shifting the HCT spectrum across the FRF on a log frequency scale. The F0 of the HCT is indicated on the left within each plot; the first 6 harmonics are labeled. If individual harmonics of the HCT can be resolved by frequency-selective neurons in A1, then response amplitude as a function of F0 (or harmonic number: BF/F0) should display a peak when the frequency of a given harmonic overlaps the BF (top and bottom plots) and a trough when the BF falls in between two adjacent harmonics (middle panel).
Neurophysiological recordings.
Recordings were conducted in an electrically shielded, sound-attenuated chamber. Monkeys were monitored via video camera throughout each recording session. Animals performed a simple auditory discrimination task (detection of a randomly presented noise burst interspersed with test stimuli) to promote attention to the sounds during the recordings. An investigator entered the recording chamber and delivered preferred treats to the animals before the beginning of each stimulus block to further maintain the alertness of the animals.
Local field potentials (LFPs) and multiunit activity (MUA) were recorded using linear-array multicontact electrodes comprised of 16 contacts, evenly spaced at 150 μm intervals (U-Probe; Plexon). Individual contacts were maintained at an impedance of ∼200 kΩ. An epidural stainless steel screw placed over the occipital cortex served as the reference electrode. Neural signals were bandpass filtered from 3 to 3000 Hz (roll-off 48 dB/octave), and were digitized at 12,207 Hz using an RA16 PA Medusa 16-channel preamplifier connected via fiber-optic cables to an RX5 data acquisition system (Tucker-Davis Technologies). LFPs time locked to the onset of the sounds were averaged on-line by computer to yield auditory evoked potentials (AEPs). CSD analyses of the AEPs characterized the laminar pattern of net current sources and sinks within A1, and were used to identify the laminar location of concurrently recorded AEPs and MUA. CSD was calculated using a 3-point algorithm that approximates the second spatial derivative of voltage recorded at each recording contact (Freeman and Nicholson, 1975; Nicholson and Freeman, 1975).
MUA was derived from the spiking activity of neural ensembles recorded within lower lamina 3, as identified by the presence of a large-amplitude initial current sink that was balanced by concurrent superficial sources in upper lamina 3 (Steinschneider et al., 1992; Fishman et al., 2001). Previous studies have localized the initial sink to thalamorecipient zone layers of A1 (Müller-Preuss and Mitzdorf, 1984; Steinschneider et al., 1992; Sukov and Barth, 1998; Metherate and Cruikshank, 1999). MUA is a measure of the envelope of summed action potential activity of neuronal ensembles within a sphere estimated to be ∼100 μm in diameter (Vaughan and Arezzo, 1988; Brosch et al., 1997; Supèr and Roelfsema, 2005). To derive MUA, bandpass-filtered signals (3–3000 Hz) were high-pass filtered at 500 Hz (roll-off 48 dB/octave) to extract neuronal spiking activity, full-wave rectified, and then low-pass filtered at 520 Hz (roll-off 48 dB/octave) to extract the envelope before digitization and averaging (for a methodological review, see Supèr and Roelfsema, 2005). Using an electrode impedance similar to that used in the present study, MUA and single-unit recordings in primary visual cortex were shown to yield similar results with regard to orientation tuning (Supèr and Roelfsema, 2005). While MUA displays greater response stability than single-unit activity (Nelken et al., 1994; Stark and Abeles, 2007), details of activity occurring in single neurons are lost. However, the primary aim of the present study was to determine whether F0-related information is reliably represented via concerted activity of neural populations in A1, which could effectively drive neurons in non-primary auditory areas that receive their input from A1 (Eggermont, 1994; deCharms and Merzenich, 1996).
Positioning of electrodes was guided by on-line examination of click-evoked AEPs. Pure tone stimuli were delivered when the electrode channels bracketed the inversion of early AEP components and when the largest MUA and initial current sink were situated in middle channels. Evoked responses to 40 presentations of each pure tone or HCT stimulus were averaged with an analysis time of 500 ms that included a 100 ms prestimulus baseline interval. The BF of each cortical site was defined as the pure tone frequency eliciting the maximal MUA within a time window of 0–75 ms post-stimulus onset. This time window includes the transient “On” response elicited by sound onset and the decay to a plateau of sustained activity in A1 (see Fishman and Steinschneider, 2009). Following determination of the BF, HCT stimuli were presented.
At the end of the recording period, monkeys were deeply anesthetized with sodium pentobarbital and transcardially perfused with 10% buffered formalin. Tissue was sectioned in the coronal plane (80 μm thickness) and stained for Nissl substance to reconstruct the electrode tracks and to identify A1 according to previously published physiological and histological criteria (Merzenich and Brugge, 1973; Morel et al., 1993; Kaas and Hackett, 1998). Based upon these criteria, all electrode penetrations considered in this report were localized to A1, though the possibility that some sites situated near the low-frequency border of A1 were located in field R cannot be excluded.
Analysis and interpretation of responses to HCTs.
Responses to HCTs were analyzed to determine whether A1 contains sufficient spectral and temporal information to reliably extract the F0 of HCTs via spectral harmonic templates or temporal periodicity detectors, respectively. The former requires sufficient neuronal resolution of individual harmonics of the HCTs (Plack et al., 2005); the latter requires accurate neural phase-locking to the F0 (Cariani and Delgutte, 1996).
At each recording site, the F0 of HCTs was varied in small increments, such that harmonics fell either on the peak or, in a progressive manner, on the sides of the neuronal pure tone tuning functions (Fig. 2). The resulting neuronal firing rate-versus-harmonic number functions are called rate-place profiles. If individual harmonics of HCTs are resolved by frequency-selective neural populations in A1, then rate-place profiles should display a periodicity, with peaks in response amplitude occurring at integer values of harmonic number and with troughs occurring at noninteger values of harmonic number. Periodicity in each rate-place profile was quantified by computing its discrete Fourier transform (DFT). The salience of the periodicity is reflected by the amplitude of the DFT at a frequency of 1.0 cycle/harmonic number. The statistical significance of peaks in the DFTs was assessed using a nonparametric permutation test (Ptitsyn et al., 2006; Womelsdorf et al., 2007), which involves randomly shuffling the data points in the rate-place profile, computing the DFT of the shuffled data, and measuring the spectral amplitude at 1.0 cycle/harmonic number. Repeating this process 1000 times yields a “null” reference distribution of spectral amplitudes. The probability of obtaining a spectral amplitude equal to or greater than the value observed, given the null, can be estimated by computing the proportion of the total area under the distribution at values equal to and greater than the observed value. This method of quantification is illustrated in Figure 3E. Spectral amplitudes yielding p values <0.05 were considered statistically significant and were interpreted as indicating neural representation of the HCT harmonic spectrum via a rate-place code. Portions of rate-place profiles corresponding to lower harmonics (1–6) and upper harmonics (7–12) were analyzed separately.
Figure 3.
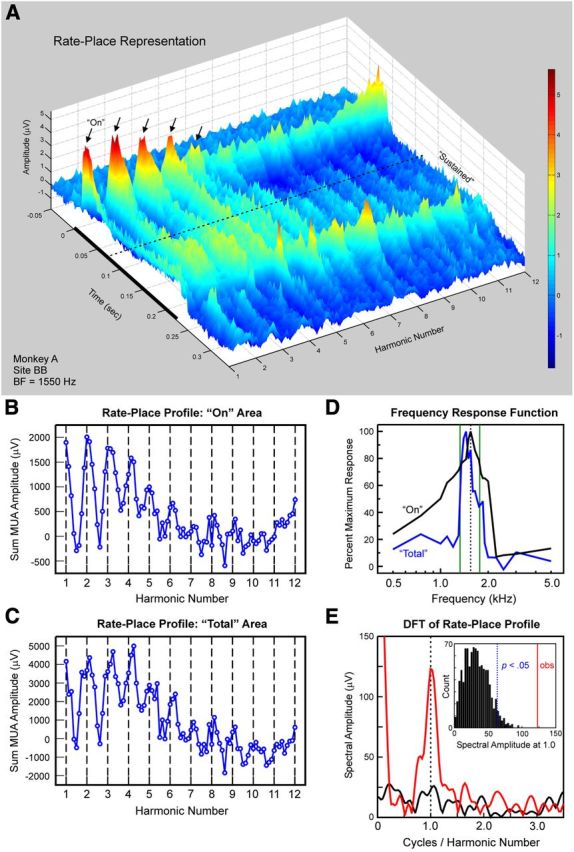
A, Rate-place representations of responses evoked by HCTs at a site with a BF of 1550 Hz. A, Composite of responses to 89 HCTs represented as a three-dimensional contour plot, with axes representing harmonic number (BF/F0), time, and response amplitude in microvolts (also color coded), as indicated. The black bar represents the duration of the stimuli (225 ms). Amplitude of On and Sustained activity displays a periodicity with prominent peaks (indicated by black arrows) occurring at or near integer values of harmonic number. B, C, Corresponding rate-place profiles based on the area under the MUA waveform within the On (B) and Total (C) time windows. Integer values of harmonic number are indicated by the dashed vertical lines. D, Pure tone FRFs based on the area under the MUA waveform within the On and Total time windows (black and blue curves, respectively). Frequencies corresponding to the third and fourth harmonics of an HCT with an F0 of 443 Hz are indicated by the vertical green lines (see Results for details). E, DFT of the rate-place profile shown in B (red curve: harmonic numbers 1–6; black curve: harmonic numbers 7–12). Periodicity in the rate-place profile for harmonic numbers 1–6 is reflected by the peak in the DFT at 1.0 cycle/harmonic number. The amplitude of this peak is statistically significant (p < 0.001), as evaluated via a nonparametric permutation test. The x-axis is limited to <3.5 cycles/harmonic number, as there were no statistically significant peaks in the DFT above that value. The inset shows a histogram of amplitudes at 1.0 cycle/harmonic number in the DFT of randomly shuffled rate-place data. The histogram represents an empirical null distribution relative to which the probability of obtaining a spectral amplitude equal to or greater than the value observed in the DFT of the unshuffled rate-place data can be estimated. The observed spectral amplitude is indicated by the vertical red line in the inset; the spectral amplitude corresponding to an estimated probability of 0.05, given the null distribution, is indicated by the dashed vertical blue line (for details, see Materials and Methods).
Three response time windows were analyzed as follows: On (0–75 ms), “Sustained” (75–225 ms), and “Total” (0–225 ms) (for analyses of pure tone responses in A1 based on similar time windows, see Fishman and Steinschneider, 2009). The rationale for examining the responses to HCTs in different time windows is based on the observation that On and Sustained responses may display a differential capacity to represent the spectral fine-structure of the HCTs. Moreover, given that pitch may be reliably conveyed by sounds as brief as 75 ms (Plack et al., 2005), if spectral information represented in A1 is sufficient for extracting the pitch of HCTs, one would predict that On responses contain sufficient information for deriving the F0s of the HCTs. The rationale for analyzing the Total response window is motivated by the possibility that auditory cortical areas that are putatively involved in pitch extraction and receive their input from A1 integrate neural activity occurring over the entire duration of the HCT stimuli.
If the F0s of the HCTs are temporally represented in A1 by neuronal discharges phase-locked to the F0s of the HCTs, then there should be significant periodicity in neural responses at the F0s of the HCTs. Phase-locking at the F0 was quantified by computing the DFT of the Total response (0–225 ms) and measuring the spectral amplitude at the frequency corresponding to the F0. Statistical significance of phase-locking at the F0 was evaluated via the same nonparametric permutation test used to evaluate the significance of periodicity in rate-place profiles, except that it was based on random shuffling of MUA waveform time samples. Permutation test results yielding p values <0.05 were considered to indicate statistically significant neuronal phase-locking at the F0.
“Harmonic number” versus “adjusted harmonic number”.
The BF derived from pure tone responses may differ from that reflected in responses to the HCTs. The reasons for this include nonlinear interactions between responses to components of the complex sounds, inadequate sampling of the FRF leading to misidentification of the BF, or differences in frequency tuning between onset responses and later sustained responses in A1 (Fishman and Steinschneider, 2009). This discrepancy will lead to misalignment in neuronal rate-place profiles such that periodic peaks occur at noninteger values of harmonic number. For instance, the rate-place profile based on Sustained responses to HCT stimuli may be misaligned if their frequency tuning differs from that of On responses used to derive the BF of the site and accordingly to determine the F0s of the HCTs presented. Potential misalignment was corrected off-line by a process that varied the “assumed” BF in small increments and measured the resulting amplitude in the DFT of the rate-place profiles at 1.0 cycle/harmonic number. The “adjusted” BF was that which maximized the DFT amplitude. The x-axis of the rate-place profile was modified accordingly, such that the harmonic number was set equal to the adjusted BF/F0, and is labeled “Adjusted Harmonic Number” to distinguish it from the harmonic number of the BF as derived from On responses to pure tones.
Testing the scaling invariance assumption.
By invoking the principle of scaling invariance (Larsen et al., 2008), the rate-place profile derived at a single recording site may be used to infer the rate-place representation of an arbitrary HCT across the tonotopic map in A1. According to the scaling invariance assumption, the relative bandwidth (BW) of frequency tuning (BW/BF) is constant across BF. This corresponds to a linear relationship with a slope of 1.0 on a log-log plot of bandwidth versus BF. To examine whether scaling invariance holds across BF in A1, we fit the pure tone FRFs with an asymmetric rounded-exponential (roexp) function separately for each recording site (Patterson, 1976; Fishman and Steinschneider, 2006). The function had five free parameters corresponding to the BF, dynamic range (vertical stretch), baseline (vertical shift), and the upper and lower slopes of the filter. Fitting was performed by minimizing the mean squared error between the data and the predictions. Linear interpolation was used to determine the 3 dB bandwidths of the fitted roexp functions. Bootstrap distributions of relevant model-based estimates of BF and BW were obtained by repeatedly resampling the data (with replacement) and recomputing the fit for every new draw (100 bootstrap samples). The bootstrap samples thus produced were then used to repeatedly compute the slope of the best-fitting regression line (in a least-squares sense) through the log-transformed data. This yielded a mean estimate of the slope of the regression line, as well as 95% confidence intervals. The extent to which the scaling invariance assumption is justified for population responses in A1 is evaluated in the Results.
Results
Results are based on MUA recorded in 29 electrode penetrations into A1 of two monkeys (15 and 14 sites in monkey A and L, respectively; 12 and 17 sites in the right and left hemisphere, respectively). Seven additional sites were excluded from analysis because they did not respond to any of the HCTs presented, were characterized by “Off”-dominant responses, had aberrant CSD profiles, or displayed FRFs that were too broad to accurately determine a BF. Sites that showed no responses to the HCTs had BFs <300 Hz and were clustered near the border between A1 and field R. Sites that showed broad frequency tuning were situated along the lateral border of A1. For all sites examined, responses occurring within the On response time window (0–75 ms post-stimulus onset) displayed sharp frequency tuning characteristic of small neural populations in A1 (Fishman and Steinschneider, 2009). Mean onset latency and mean 6 dB bandwidths of FRFs of MUA recorded in lower lamina 3 were ∼14 ms and ∼0.6 octaves, respectively. These values are comparable to those reported for single neurons in A1 of awake monkeys (Recanzone et al., 2000). BFs of recording sites ranged from 240 to 16,500 Hz.
Rate-place representation of harmonic spectra in A1
Neural population responses in A1 can resolve individual harmonics of HCTs. This capacity is illustrated in Figure 3, which depicts the rate-place representation of HCTs based on MUA recorded at a site whose BF was 1550 Hz. Figure 3A shows a composite of responses to 89 HCTs represented as a three-dimensional contour plot, with axes representing harmonic number (BF/F0), time, and response amplitude (also color coded). Periodicity with respect to harmonic number is evident in the rate-place representation for both On and Sustained activity. Prominent peaks in response amplitude occurring at integer values of harmonic number are indicated by the black arrows. Corresponding rate-place profiles based on the area under the MUA waveform within the On and Total time window are shown in Figure 3, B and C, respectively. Importantly, periodicity in the rate-place profiles is more prominent at lower harmonic numbers (1–6) than at higher harmonic numbers (7–12), thus indicating a greater capacity of neural responses to resolve lower harmonics of the HCTs. A similar periodicity is observed in the rate-place profile for Sustained responses (data not shown). Pure tone FRFs based on the area under the MUA waveform within the On and Total time window are shown in Figure 3D. Frequencies corresponding to the third and fourth harmonics of an HCT with an F0 of 443 Hz are indicated by the vertical green lines in Figure 3D to illustrate the relationship between HCT responses and the FRFs. The On FRF peaks at 1550 Hz, the nominal BF of the site. When the BF corresponds to a noninteger value of harmonic number (in this case, 3.5), the frequency components of the HCT fall on the shoulders rather than the peak of the On FRF, thus accounting for the trough observed in the On rate-place profile at a harmonic number of 3.5. On the other hand, the Total FRF peaks at 1450 Hz, a frequency close to that of the third harmonic of the HCT with an F0 of 443 Hz (left-most green line at 1329 Hz). The difference in FRFs between On and Total responses may therefore account for the difference between their rate-place profiles. Specifically, peaks in the rate-place profile for Total responses occur at values slightly higher than integer values of harmonic number. Hence, frequencies of the HCT components must be lower to elicit a peak in the Total response. Correspondingly, the BF of Total responses must have a higher harmonic number with respect to the F0 of the HCTs than the BF of On responses. Periodicity in the rate-place profile for On responses at 1.0 cycle/harmonic number is statistically significant, as evaluated via a nonparametric permutation test based on the DFT of the rate-place profile (Fig. 3E; p < 0.001; for details, see Materials and Methods). Periodicity in rate-place profiles for Total and Sustained responses is also statistically significant (p < 0.001; data not shown).
Similar results from another example site whose BF was 8250 Hz are shown in Figure 4. The rate-place profile based on Total responses displays a prominent periodicity (Fig. 4B). However, as also exemplified in Figure 3 C, peaks in activity occur at noninteger values of harmonic number. This misalignment may reflect a discrepancy between the BF of On responses used to determine the F0s of the HCT stimuli and the BF of Total responses. Figure 4C shows the rate-place profile after the harmonic number axis is adjusted to correct for this misalignment (as described in Materials and Methods). Accordingly, the axis is labeled adjusted harmonic number. Following this adjustment, the “adjusted” BF for Total responses is 8750 Hz. Periodicity in the rate-place profile for Total responses at 1.0 cycle/adjusted harmonic number is statistically significant (Fig. 4E; p < 0.001). Periodicity in rate-place profiles for On and Sustained responses is also statistically significant (p < 0.001; data not shown). Pure tone FRFs based on the area under the MUA waveform within the On and Total time window are shown in Figure 4D. Frequencies corresponding to the third and fourth harmonics of an HCT with an F0 of 2357 Hz are indicated by the vertical green lines in Figure 4D to illustrate the relationship between HCT responses and the FRFs. The On FRF has a single peak at 8250 Hz, the nominal BF of the site. On the other hand, the Total FRF has a secondary peak occurring at a frequency near that of the fourth harmonic of the HCT with an F0 of 2357 Hz (right-most green line superimposed on the FRF at 9428 Hz). The misalignment of peaks in the rate-place profile shown in Figure 4B can thus be explained by differences between FRFs based on MUA occurring within the On and Total time windows (Fig. 4D). In particular, when the F0 of the HCT is 2357 Hz, the harmonic number of the unadjusted BF (8250 Hz) corresponds to a noninteger value (namely, 3.5), which may explain the peak near 3.5 in the unadjusted rate-place profile (Fig. 4B).
Figure 4.
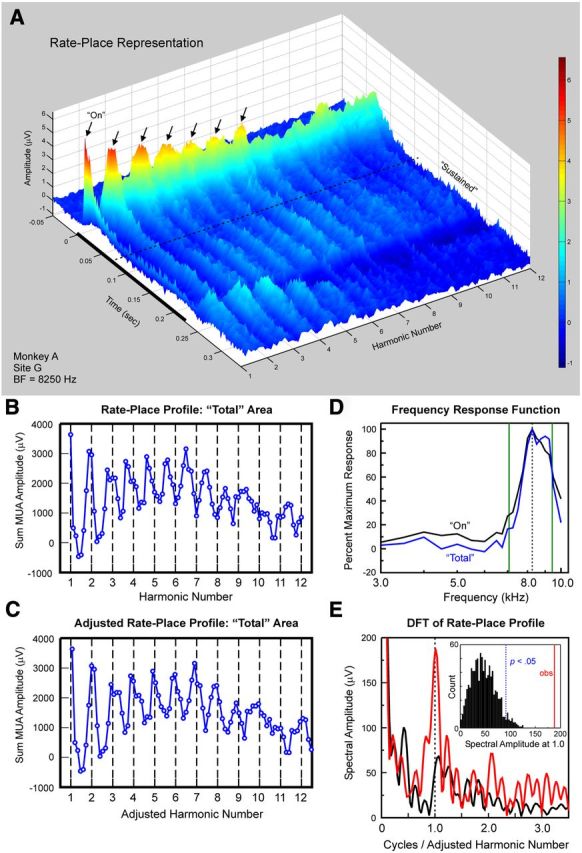
Rate-place representations of responses evoked by HCTs at a site with a BF of 8250 Hz. A, Rate-place representation (same conventions as in Fig. 3A). B, Unadjusted rate-place profile based on Total responses. C, Same rate-place profile as in B following adjustment of x-axis to adjusted harmonic number (see Materials and Methods for details). D, FRFs derived from On (black curve) and Total (blue curve) responses. Vertical green lines indicate frequencies corresponding to the third and fourth harmonics of an HCT with an F0 of 2357 Hz (for details, see Results). E, DFT of rate-place profile shown in C (same conventions as in Fig. 3E).
Figure 5 depicts adjusted rate-place profiles based on Total MUA from five sites with different BFs to demonstrate the generality of the periodicity in rate-place profiles across sites in A1. Similar rate-place profiles are obtained for On MUA (data not shown). Periodicity in all rate-place profiles shown is statistically significant (p < 0.001).
Figure 5.
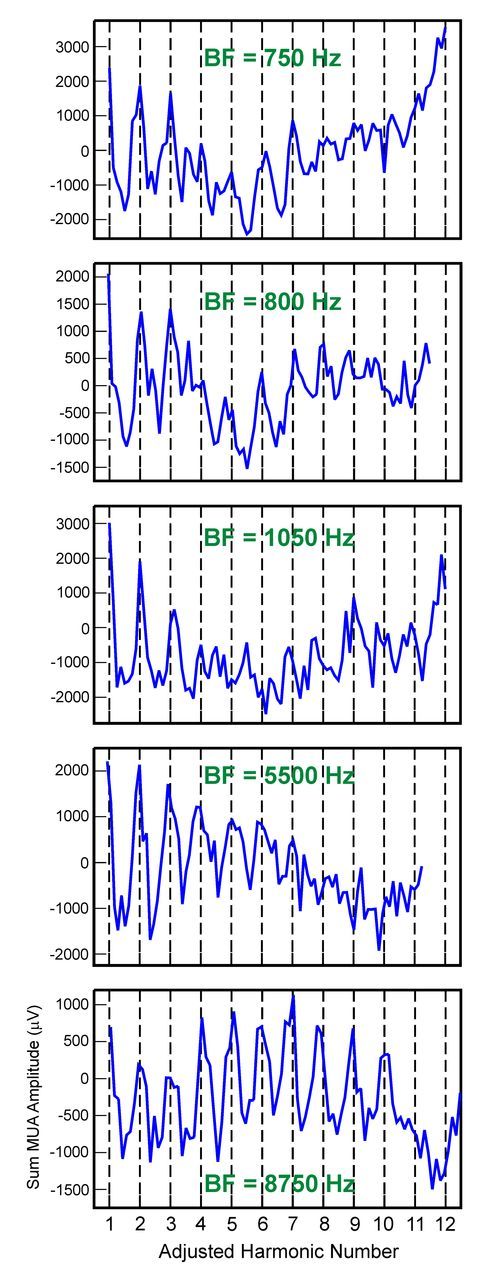
Rate-place profiles based on Total MUA recorded at five additional sites with different BFs. BFs of the sites are indicated in green. The x-axis of the rate-place profiles has been changed to adjusted harmonic number, as described in Materials and Methods. Note periodicity in rate-place profiles, with peaks in response amplitude occurring at or near integer values of harmonic number.
Estimated probability of the observed periodicity in rate-place profiles based on the area under the MUA waveform is plotted as a function of BF in Figure 6. Results based upon On, Sustained, and Total MUAs are shown in Fig. 6A–C, respectively. Results for lower harmonics (1–6) and upper harmonics (7–12) are plotted separately in the left and right columns, respectively. Lower probability values indicate greater periodicity at 1.0 cycle/(adjusted) harmonic number and a correspondingly greater capacity of responses to resolve individual harmonics of the HCTs.
Figure 6.

Estimated probability of the observed periodicity in rate-place profiles based on the area under the MUA waveform, given the null distribution derived from random shuffling of points in the rate-place profile, plotted as a function of BF. Results for On, Sustained, and Total MUA are plotted in separate rows, as indicated. Results based on rate-place data corresponding to harmonic numbers 1–6 and 7–12 are plotted in the left and right columns, respectively. Lower-probability values indicate greater periodicity at 1.0 cycle/(adjusted) harmonic number and a correspondingly greater capacity of neural responses to resolve individual harmonics of the HCTs. As probability values >0.05 are considered nonsignificant, for display purposes, values ≥0.05 are plotted along the same row, as marked by the upper horizontal dashed line at 0.05 along the ordinate. As permutation tests were based on 1000 shuffles of rate-place data, probability values <0.001 could not be evaluated. Therefore, probability values ≤0.001 are plotted along the same row, as marked by the lower horizontal dashed line at 0.001 along the ordinate.
Lower harmonics (1–6) are better resolved in rate-place profiles than higher harmonics (7–12). Whereas for harmonic numbers 1–6, 20 of 29 sites (69%) showed significant periodicity in rate-place profiles, for harmonic numbers 7–12, only 6 of 29 sites (21%) showed significant periodicity in rate-place profiles. For On and Total responses, the proportion of sites showing significant periodicity in rate-place profiles was significantly greater for harmonic numbers 1–6 than for harmonic numbers 7–12 (χ2 test: χ2 (1) = 11.88, p = 0.0006 for On responses; χ2 (1) = 5.59, p = 0.0181 for Total responses). The difference in proportions was not statistically significant for Sustained responses (χ2 (1) = 3.44, p = 0.0634).
Sites with higher BFs are better able to resolve individual harmonics of the HCTs than sites with lower BFs. For On and Total responses, a significantly greater proportion of low-BF sites (<1500 Hz) than high-BF sites (>1500 Hz) showed significant periodicity in rate-place profiles for harmonic numbers 1–6 (χ2 test: χ2 (1) = 9.96, p = 0.0016 for On responses; χ2 (1) = 5.60, p = 0.0180 for Total responses). No such statistically significant differences were observed for Sustained responses, or for harmonic numbers 7–12. Importantly, however, lower harmonics (below the sixth) could still be clearly resolved at sites with BFs as low as 400 Hz. Therefore, based on the present findings, the lowest F0 values that can be extracted from rate-place representations in A1 lie between 80 Hz (400 Hz/fifth harmonic) and 400 Hz (400 Hz/first harmonic).
Results indicate that neural populations across tonotopically organized A1 can represent the harmonic spectrum of HCTs via a rate-place code. The viability of this code for extracting the pitch of HCTs depends on the extent to which the (adjusted) BF derived from HCT responses matches the BF derived from pure tone responses (see Materials and Methods for the definition of adjusted BF). The reason for this is that the pitch of a pure tone is generally matched to the pitch of an HCT with an F0 equal to the frequency of the pure tone. Hence, the ability to match the pitch of a pure tone and that of an HCT depends on their being a close correspondence between BFs obtained using these two types of stimuli. Figure 7A shows BFs derived from pure tone responses (Pure Tone-Derived BF) plotted against BFs derived from HCT responses (HCT-Derived BF) occurring within the On time window. BFs derived from pure tone and HCT responses show a remarkable concordance, with values lying on or close to the diagonal identity line (Spearman correlation coefficient = 0.99).
Figure 7.

A, BFs derived from pure tone responses (Pure Tone-Derived BF) plotted against BFs derived from HCT responses (HCT-Derived BF) occurring within the On time window. Data from the nine sites that did not show significant periodicity in rate-place profiles are not represented, as their HCT-derived BF could not be determined. The diagonal line represents identity. The insets in Figure 7A show the absolute difference (in hertz) and relative difference (difference in hertz/pure tone BF in Hz) between BFs derived using pure tones and HCTs as a function of pure tone BF. B, The 3 dB frequency tuning bandwidth as a function of BF. The solid line represents a best fit to the data, and the dashed line represents values predicted according to the scaling invariance assumption. See Results for details.
Evaluation of scaling invariance
The ability to reliably infer the response to an arbitrary HCT across frequency-selective neurons in A1 from rate-place profiles obtained at a single site depends upon the degree to which the scaling invariance assumption holds in A1. Figure 7B shows a plot of BF versus 3 dB BW, as estimated using roexp fits (for details, see Materials and Methods). The solid line represents a best fit to the data (calculated using log-transformed values). Consistent with previous results (Bartlett et al., 2011), we found that tuning bandwidths increase approximately linearly with BF. According to the scaling invariance assumption, BW should equal a constant proportion of BF. This implies a line with a slope of 1.0 on log-log coordinates, as represented by the dashed line in Figure 7B. While the data fall close to the dashed line, the slope of the best-fit line through log(BF) versus log(BW) is significantly different from 1.0, being equal to 0.81 (95% confidence interval, [0.79- 0.83]). The slight departure from strict scaling invariance is primarily due to sites with higher BFs having narrower relative tuning bandwidths than sites with lower BFs. This narrower tuning may partly explain why higher BF sites are better able to resolve harmonics of the HCTs than lower BF sites (Fig. 6). Consequently, the extent of neural resolvability of harmonics at higher (lower) BF sites would be slightly underestimated (overestimated) if inferred based on rate-place profiles obtained at lower (higher) BF sites. Nonetheless, the scaling invariance assumption remains a good approximation when applied over a local region of BFs covered by the range of harmonics comprising the HCT stimuli used in the present study.
Temporal representation of F0 in A1
F0s of HCTs are also represented by neural responses phase-locked to the periodic temporal envelope of the sounds. Temporal encoding of F0 is illustrated in rate-place data from a site with a BF of 1500 Hz (Fig. 8). Periodicity at the F0 of the HCTs is evident in the waveform of the responses (Fig. 8A, black arrows). In contrast, periodicity is lacking with respect to the harmonic number axis in the rate-place representation (Fig. 8A). Thus, whereas responses are unable to resolve individual harmonics of the HCTs via a rate-place code, they are able to represent the F0s of HCTs by a temporal code. At this site, significant neural phase-locking at the F0 is observed for stimulus F0s up to 300 Hz (Fig. 8B). Qualitatively similar results from another example site with a BF of 350 Hz are illustrated in Figure 9. Here, significant phase-locking at the F0 is observed for stimulus F0s up to 175 Hz (Fig. 9B).
Figure 8.

Temporal representation of F0: example site 1. A, Rate-place representations from a site (BF = 1500 Hz) showing phase-locking of MUA to the periodicity at the F0 in the temporal envelope of the HCTs. Note the absence of periodicity in response amplitude with respect to harmonic number, thus indicating the inability of this site to resolve individual harmonics of the HCTs. Same conventions as in Figures 3A and 4A. Graph axes have been rotated relative to those in Figures 3A and 4A to facilitate visualization of phase-locked responses. B, Spectral amplitude at the F0 in the DFT of Total MUA as a function of harmonic number (lower x-axis) and stimulus F0 (upper x-axis). Data points lying at and to the right of the dashed vertical blue line represent statistically significant (p < 0.05) phase-locking at the F0, as evaluated via a nonparametric permutation test. At this site, significant phase-locking at the F0 is observed for stimulus F0 values up to 300 Hz, as further demonstrated in the inset showing the DFT of the response to the HCT with an F0 of 300 Hz (red line). The amplitude of the peak in the DFT at 300 Hz substantially exceeds the 95% confidence interval calculated from the null distribution of the permutation test (gray line).
Figure 9.

Temporal representation of F0: example site 2. A, Rate-place representations from another site (BF = 350 Hz) showing phase-locking of MUA to the periodicity at the F0 of the HCTs. Same conventions as in Figure 8A. B, Corresponding spectral amplitude at the F0 in the DFT of Total MUA as a function of harmonic number (lower x-axis) and stimulus F0 (upper x-axis). Same conventions as in Figure 8B. At this site, significant phase-locking at the F0 is observed for stimulus F0 values up to 175 Hz (dashed vertical blue line).
Results pertaining to the temporal representation of F0 are summarized in Figure 10. The highest and lowest F0 values at which statistically significant phase-locking was observed (represented by red and blue symbols, respectively) are plotted as a function of BF. The red and blue lines indicate the highest and lowest F0 tested at each site, as constrained by the experimental design of the stimulus sets. Sites showing no significant phase-locking at any of the F0s tested are represented by black symbols. F0s at which significant phase-locking occurred ranged from 20 to 433 Hz, with many upper limits falling in the 100–300 Hz range. Thus, given that rate-place representations of harmonic spectra can be used to extract the pitch of HCTs with F0s as low as 80–400 Hz (as described above), the entire range of human pitch perception (F0s ranging from 30 to 5000 Hz) can be represented, without gaps, by combining the spectral and temporal information available in A1.
Figure 10.

Temporal representation of F0 in A1: summary of results. Highest and lowest F0 values at which statistically significant phase-locking at the F0 was observed (red and blue symbols, respectively) are plotted as a function of BF. Red and blue lines indicate the highest and lowest F0 tested at each site, as constrained by the design of the stimulus sets. Black symbols denote sites showing no significant phase-locking at any of the F0s tested. See Results for details.
Discussion
Using a stimulus design employed in auditory nerve studies of pitch encoding (Cedolin and Delgutte, 2005; Larsen et al., 2008), the present study examined whether spectral and temporal information sufficient for extracting the F0 of HCTs is available at the level of A1. We found that neural populations in A1 are able to resolve individual harmonics of HCTs. Lower harmonics (1–6) were better resolved than higher harmonics (7–12), consistent with the increase in behavioral and physiological auditory filter bandwidths with increasing stimulus frequency in both monkeys and humans (Serafin et al., 1982; Shera et al., 2002; Bartlett et al., 2011; Joris et al., 2011). Sites with higher BFs displayed a greater capacity to resolve harmonics than sites with lower BFs, consistent with the former's narrower relative frequency tuning bandwidths (BW/BF; Fig. 7B; Fishman and Steinschneider, 2009). Importantly, sites with BFs as low as 400 Hz were able to resolve the lower harmonics of HCTs, which play a predominant role in human pitch perception (Plack et al., 2005). F0 values <433 Hz were also represented by temporal discharges phase-locked to the periodic waveform envelope of the HCTs, consistent with previous findings based on single-neuron and neural population responses in A1 of unanesthetized animals (De Ribaupierre et al., 1972; Steinschneider et al., 1998; Fishman et al., 2000; Bendor and Wang, 2010) and humans (Nourski and Brugge, 2011). We conclude that A1 contains sufficient spectral and temporal information to derive the pitch of HCTs across the entire range of F0 values associated with pitch perception in humans (30–5000 Hz; Plack et al., 2005). Theoretically, pitch could be extracted from this information by neurons that receive the output of A1 and implement the functional equivalent of harmonic templates or temporal periodicity detectors.
Accordingly, neurons have been identified in non-primary auditory cortex of marmosets that respond to the missing F0 (Fig. 1) but not to the individual harmonics of HCTs (Bendor and Wang, 2005, 2006). These pitch-selective neurons are found exclusively in a region immediately anterior and lateral to A1 (the putative pitch center in marmosets). How these neurons derive their pitch-selective properties remains unclear. Non-pitch-selective neurons within the putative pitch center displaying harmonically related peaks in their frequency tuning functions provide compelling evidence for the integration of information reflecting the spectral fine-structure of HCTs (Bendor et al., 2012). While A1 may not be necessary for pitch extraction by pitch-selective neurons (which may derive their properties from non-A1 sources), it seems likely that pitch-selective neurons would partially rely on information from A1, which sends connections to more anterior and lateral auditory cortical fields (Morel et al., 1993; Hackett et al., 1998; de la Mothe et al., 2006). Importantly, neural representations of spectral and temporal features of HCTs in macaque A1 are remarkably consistent with the properties of pitch-selective neurons in marmoset non-primary auditory cortex. Specifically, pitch-selective neurons with Best F0s <450 Hz use temporal envelope information to extract pitch, whereas neurons with Best F0s >450 Hz use spectral information (Bendor et al., 2012). In principle, the entire range of F0s typical of human pitch perception can be extracted, without gaps, by combining the spectral and temporal information available in A1. For instance, while the harmonic spectrum of an HCT with an F0 of 50 Hz would not generally be resolved by neurons in A1, its F0 could still be represented by phase-locked responses at 50 Hz. On the other hand, due to phase-locking limitations, an HCT with an F0 of 500 Hz would not be represented by a temporal code in A1, but its lower, resolved harmonics could be reliably represented by a rate-place code. Our results are therefore consistent with a dual pitch-processing mechanism, whereby pitch is ultimately extracted from temporal envelope cues for lower pitch sounds composed of higher-order harmonics, and from spectral fine-structure cues for higher pitch sounds with lower-order harmonics (Carlyon and Shackleton, 1994; see also Steinschneider et al., 1998; Bendor et al., 2012). As the range of F0s that can theoretically be extracted from the information in A1 extends beyond the upper and lower limits of pitch, some features of pitch perception may depend on the particular properties of downstream neurons that might use this information for pitch extraction.
The present findings build upon those of Schwarz and Tomlinson (1990) and Steinschneider et al. (1998), who showed that single neurons and neural populations in A1 of awake macaques can resolve several lower harmonics of HCTs and click trains, respectively. However, the stimulus design used here provided finer sampling at higher harmonic numbers in rate-place profiles than in the aforementioned studies, which may have underestimated the neural resolvability of higher harmonics due to coarser sampling of the F0 axis. A further advantage of the present study is that HCTs contained harmonics up to the 12th, which include upper harmonics that are considered “unresolved” in humans (Shackleton and Carlyon, 1994), whereas in Schwarz and Tomlinson's (1990) study only harmonics 1–8 were examined. This extended range allowed us to better compare the neural resolvability of psychoacoustically “resolved” and unresolved harmonics in A1.
Neural resolvability of HCT harmonics in A1 is comparable to or greater than that observed in the auditory nerve of the anesthetized cat, where responses tend to saturate at moderate-to-high stimulus levels (Cedolin and Delgutte, 2010). Despite their relatively high level in the present study (60 dB SPL per component), many of the lower harmonics of the HCTs were well resolved in rate-place profiles. Thus, spectral information is preserved, and perhaps even enhanced, as it ascends from periphery to cortex. Enhancement of spectral contrast could occur via lateral suppression in A1 and in subcortical auditory nuclei (Shamma and Symmes, 1985; Ehret and Merzenich, 1988; Fishman and Steinschneider, 2006; Sadagopan and Wang, 2010; Pollak et al., 2011). Alternatively, the high fidelity of spectral fine-structure encoding in A1 may reflect a transformation of temporal representations of individual HCT components in peripheral structures into a rate code at higher levels of the auditory pathway (Buonomano and Merzenich, 1995; Wang et al., 2008). The auditory periphery contains abundant temporal information from which, in principle, the pitch of HCTs may be derived (Cariani and Delgutte, 1996). While peripheral neurons can phase-lock to stimulus periodicities up to several thousand hertz (Rose et al., 1967; Langner, 1992), a purely temporal code for pitch is not viable at the cortical level, where upper limits of phase-locking are too low to account for the full range of F0 values characteristic of human pitch perception. Hence, a temporal code for pitch needs to be either supplemented or replaced by a mechanism at the level of auditory cortex that derives pitch from a rate-place representation of individual harmonics of HCTs.
The present demonstration that the spectral fine-structure of HCTs can be reliably represented by population responses in A1 is important, given that synchronized activity of neural ensembles in auditory cortex may convey pitch-related information more robustly than single-unit responses (Eggermont, 1994; Bizley et al., 2010). For instance, pooling of responses of single units in A1 to periodically amplitude-modulated sounds improves the reliability of neuronal phase-locking at the amplitude modulation frequency (Yin et al., 2011) and yields a better correspondence with behavioral thresholds for amplitude modulation detection than responses of individual neurons (Johnson et al., 2012). Thus, concerted activity of neural populations may be better suited for temporal encoding of pitch than the activity of individual neurons and more likely to drive neurons in downstream cortical areas to firing threshold (Eggermont, 1994; deCharms and Merzenich, 1996; Tiesinga et al., 2008; Wang et al., 2010). Furthermore, as pitch-related electromagnetic responses in humans reflect the synchronous activity of neural populations (Krumbholz et al., 2003; Griffiths et al., 2010; Nourski and Brugge, 2011; Sedley et al., 2012; Steinmann and Gutschalk, 2012), the present results help to bridge the gap between single-unit and population representations of pitch in auditory cortex of monkeys and humans.
Together, the present results indicate that harmonic spectra of HCTs with higher F0 values are represented in A1 by a tonotopic rate-place code, while lower F0 values are represented by neuronal phase-locking to the waveform envelope. Findings are consistent with a hierarchical model of pitch extraction whereby A1 supplies pitch-related spectral and temporal information to neurons in non-primary auditory cortex (Lewis et al., 2009; Kumar and Schönwiesner, 2012). Whether pitch is, in fact, ultimately represented in the brain by a “labeled line” code (Bendor et al., 2012), or rather in a distributed or multiplexed fashion (Nelken et al., 2008; Walker et al., 2011), continues to be explored.
Footnotes
This research was supported by NIH Grant DC00657. We are grateful to Jeannie Hutagalung and Kyoko Kamishima for invaluable assistance with animal training, surgery, and data collection; and to Dr. Steven Walkley for providing histological facilities. We also thank three anonymous reviewers for helpful comments on an earlier version of the article.
The authors declare no competing financial interests.
References
- Bartlett EL, Sadagopan S, Wang X. Fine frequency tuning in monkey auditory cortex and thalamus. J Neurophysiol. 2011;106:849–859. doi: 10.1152/jn.00559.2010. [DOI] [PMC free article] [PubMed] [Google Scholar]
- Bendor D, Wang X. The neuronal representation of pitch in primate auditory cortex. Nature. 2005;436:1161–1165. doi: 10.1038/nature03867. [DOI] [PMC free article] [PubMed] [Google Scholar]
- Bendor D, Wang X. Cortical representations of pitch in monkeys and humans. Curr Opin Neurobiol. 2006;16:391–399. doi: 10.1016/j.conb.2006.07.001. [DOI] [PMC free article] [PubMed] [Google Scholar]
- Bendor D, Wang X. Neural coding of periodicity in marmoset auditory cortex. J Neurophysiol. 2010;103:1809–1822. doi: 10.1152/jn.00281.2009. [DOI] [PMC free article] [PubMed] [Google Scholar]
- Bendor D, Osmanski MS, Wang X. Dual-pitch processing mechanisms in primate auditory cortex. J Neurosci. 2012;32:16149–16161. doi: 10.1523/JNEUROSCI.2563-12.2012. [DOI] [PMC free article] [PubMed] [Google Scholar]
- Bizley JK, Walker KM, King AJ, Schnupp JW. Neural ensemble codes for stimulus periodicity in auditory cortex. J Neurosci. 2010;30:5078–5091. doi: 10.1523/JNEUROSCI.5475-09.2010. [DOI] [PMC free article] [PubMed] [Google Scholar]
- Brosch M, Bauer R, Eckhorn R. Stimulus-dependent modulations of correlated high frequency oscillations in cat visual cortex. Cereb Cortex. 1997;7:70–76. doi: 10.1093/cercor/7.1.70. [DOI] [PubMed] [Google Scholar]
- Buonomano DV, Merzenich MM. Temporal information transformed into a spatial code by a neural network with realistic properties. Science. 1995;267:1028–1030. doi: 10.1126/science.7863330. [DOI] [PubMed] [Google Scholar]
- Cariani PA, Delgutte B. Neural correlates of the pitch of complex tones. I. Pitch and pitch salience. J Neurophysiol. 1996;76:1698–1716. doi: 10.1152/jn.1996.76.3.1698. [DOI] [PubMed] [Google Scholar]
- Carlyon RP, Shackleton TM. Comparing the fundamental frequencies of resolved and unresolved harmonics: evidence for two pitch mechanisms? J Acoust Soc Am. 1994;95:3541–3554. doi: 10.1121/1.409971. [DOI] [PubMed] [Google Scholar]
- Cedolin L, Delgutte B. Pitch of complex tones: rate-place and interspike interval representations in the auditory nerve. J Neurophysiol. 2005;94:347–362. doi: 10.1152/jn.01114.2004. [DOI] [PMC free article] [PubMed] [Google Scholar]
- Cedolin L, Delgutte B. Spatiotemporal representation of the pitch of harmonic complex tones in the auditory nerve. J Neurosci. 2010;30:12712–12724. doi: 10.1523/JNEUROSCI.6365-09.2010. [DOI] [PMC free article] [PubMed] [Google Scholar]
- de la Mothe LA, Blumell S, Kajikawa Y, Hackett TA. Cortical connections of the auditory cortex in marmoset monkeys: core and medial belt regions. J Comp Neurol. 2006;496:27–71. doi: 10.1002/cne.20923. [DOI] [PubMed] [Google Scholar]
- deCharms RC, Merzenich MM. Primary cortical representation of sounds by the coordination of action-potential timing. Nature. 1996;381:610–613. doi: 10.1038/381610a0. [DOI] [PubMed] [Google Scholar]
- De Ribaupierre F, Goldstein MH, Jr, Yeni-Komshian G. Intracellular study of the cat's primary auditory cortex. Brain Res. 1972;48:185–204. doi: 10.1016/0006-8993(72)90178-3. [DOI] [PubMed] [Google Scholar]
- Eggermont JJ. Neural interaction in cat primary auditory cortex II. Effects of sound stimulation. J Neurophysiol. 1994;71:246–270. doi: 10.1152/jn.1994.71.1.246. [DOI] [PubMed] [Google Scholar]
- Ehret G, Merzenich MM. Complex sound analysis (frequency resolution, filtering and spectral integration) by single units of the inferior colliculus of the cat. Brain Res. 1988;472:139–163. doi: 10.1016/0165-0173(88)90018-5. [DOI] [PubMed] [Google Scholar]
- Fishman YI, Steinschneider M. Spectral resolution of monkey primary auditory cortex (A1) revealed with two-noise masking. J Neurophysiol. 2006;96:1105–1115. doi: 10.1152/jn.00124.2006. [DOI] [PubMed] [Google Scholar]
- Fishman YI, Steinschneider M. Temporally dynamic frequency tuning of population responses in monkey primary auditory cortex. Hear Res. 2009;254:64–76. doi: 10.1016/j.heares.2009.04.010. [DOI] [PMC free article] [PubMed] [Google Scholar]
- Fishman YI, Steinschneider M. Neural correlates of auditory scene analysis based on inharmonicity in monkey primary auditory cortex. J Neurosci. 2010;30:12480–12494. doi: 10.1523/JNEUROSCI.1780-10.2010. [DOI] [PMC free article] [PubMed] [Google Scholar]
- Fishman YI, Reser DH, Arezzo JC, Steinschneider M. Pitch vs. spectral encoding of harmonic complex tones in primary auditory cortex of the awake monkey. Brain Res. 1998;786:18–30. doi: 10.1016/S0006-8993(97)01423-6. [DOI] [PubMed] [Google Scholar]
- Fishman YI, Reser DH, Arezzo JC, Steinschneider M. Complex tone processing in primary auditory cortex of the awake monkey. I. Neural ensemble correlates of roughness. J Acoust Soc Am. 2000;108:235–246. doi: 10.1121/1.429460. [DOI] [PubMed] [Google Scholar]
- Fishman YI, Volkov IO, Noh MD, Garell PC, Bakken H, Arezzo JC, Howard MA, Steinschneider M. Consonance and dissonance of musical chords: neural correlates in auditory cortex of monkeys and humans. J Neurophysiol. 2001;86:2761–2788. doi: 10.1152/jn.2001.86.6.2761. [DOI] [PubMed] [Google Scholar]
- Freeman JA, Nicholson C. Experimental optimization of current source-density technique for anuran cerebellum. J Neurophysiol. 1975;38:369–382. doi: 10.1152/jn.1975.38.2.369. [DOI] [PubMed] [Google Scholar]
- Griffiths TD, Hall DA. Mapping pitch representation in neural ensembles with fMRI. J Neurosci. 2012;32:13343–13347. doi: 10.1523/JNEUROSCI.3813-12.2012. [DOI] [PMC free article] [PubMed] [Google Scholar]
- Griffiths TD, Kumar S, Sedley W, Nourski KV, Kawasaki H, Oya H, Patterson RD, Brugge JF, Howard MA. Direct recordings of pitch responses from human auditory cortex. Curr Biol. 2010;20:1128–1132. doi: 10.1016/j.cub.2010.04.044. [DOI] [PMC free article] [PubMed] [Google Scholar]
- Hackett TA, Stepniewska I, Kaas JH. Subdivisions of auditory cortex and ipsilateral cortical connections of the parabelt auditory cortex in macaque monkeys. J Comp Neurol. 1998;394:475–495. doi: 10.1002/(SICI)1096-9861(19980518)394:4<475::AID-CNE6>3.0.CO%3B2-Z. [DOI] [PubMed] [Google Scholar]
- Johnson JS, Yin P, O'Connor KN, Sutter ML. Ability of primary auditory cortical neurons to detect amplitude modulation with rate and temporal codes: neurometric analysis. J Neurophysiol. 2012;107:3325–3341. doi: 10.1152/jn.00812.2011. [DOI] [PMC free article] [PubMed] [Google Scholar]
- Joris PX, Bergevin C, Kalluri R, Mc Laughlin M, Michelet P, van der Heijden M, Shera CA. Frequency selectivity in Old-World monkeys corroborates sharp cochlear tuning in humans. Proc Natl Acad Sci U S A. 2011;108:17516–17520. doi: 10.1073/pnas.1105867108. [DOI] [PMC free article] [PubMed] [Google Scholar]
- Kaas JH, Hackett TA. Subdivisions of auditory cortex and levels of processing in primates. Audiol Neurootol. 1998;3:73–85. doi: 10.1159/000013783. [DOI] [PubMed] [Google Scholar]
- Krumbholz K, Patterson RD, Seither-Preisler A, Lammertmann C, Lütkenhöner B. Neuromagnetic evidence for a pitch processing center in Heschl's gyrus. Cereb Cortex. 2003;13:765–772. doi: 10.1093/cercor/13.7.765. [DOI] [PubMed] [Google Scholar]
- Kumar S, Schönwiesner M. Mapping human pitch representation in a distributed system using depth-electrode recordings and modeling. J Neurosci. 2012;32:13348–13351. doi: 10.1523/JNEUROSCI.3812-12.2012. [DOI] [PMC free article] [PubMed] [Google Scholar]
- Kumar S, Sedley W, Nourski KV, Kawasaki H, Oya H, Patterson RD, Howard MA, 3rd, Friston KJ, Griffiths TD. Predictive coding and pitch processing in the auditory cortex. J Cogn Neurosci. 2011;23:3084–3094. doi: 10.1162/jocn_a_00021. [DOI] [PMC free article] [PubMed] [Google Scholar]
- Langner G. Periodicity coding in the auditory system. Hear Res. 1992;60:115–142. doi: 10.1016/0378-5955(92)90015-F. [DOI] [PubMed] [Google Scholar]
- Larsen E, Cedolin L, Delgutte B. Pitch representations in the auditory nerve: two concurrent complex tones. J Neurophysiol. 2008;100:1301–1319. doi: 10.1152/jn.01361.2007. [DOI] [PMC free article] [PubMed] [Google Scholar]
- Lewis JW, Talkington WJ, Walker NA, Spirou GA, Jajosky A, Frum C, Brefczynski-Lewis JA. Human cortical organization for processing vocalizations indicates representation of harmonic structure as a signal attribute. J Neurosci. 2009;29:2283–2296. doi: 10.1523/JNEUROSCI.4145-08.2009. [DOI] [PMC free article] [PubMed] [Google Scholar]
- Merzenich MM, Brugge JF. Representation of the cochlear partition of the superior temporal plane of the macaque monkey. Brain Res. 1973;50:275–296. doi: 10.1016/0006-8993(73)90731-2. [DOI] [PubMed] [Google Scholar]
- Metherate R, Cruikshank SJ. Thalamocortical inputs trigger a propagating envelope of gamma-band activity in auditory cortex in vitro. Exp Brain Res. 1999;126:160–174. doi: 10.1007/s002210050726. [DOI] [PubMed] [Google Scholar]
- Morel A, Garraghty PE, Kaas JH. Tonotopic organization, architectonic fields, and connections of auditory cortex in macaque monkeys. J Comp Neurol. 1993;335:437–459. doi: 10.1002/cne.903350312. [DOI] [PubMed] [Google Scholar]
- Müller-Preuss P, Mitzdorf U. Functional anatomy of the inferior colliculus and the auditory cortex: current source density analyses of click-evoked potentials. Hear Res. 1984;16:133–142. doi: 10.1016/0378-5955(84)90003-0. [DOI] [PubMed] [Google Scholar]
- Nelken I, Prut Y, Vaadia E, Abeles M. Population responses to multifrequency sounds in the cat auditory cortex: one- and two-parameter families of sounds. Hear Res. 1994;72:206–222. doi: 10.1016/0378-5955(94)90220-8. [DOI] [PubMed] [Google Scholar]
- Nelken I, Bizley JK, Nodal FR, Ahmed B, King AJ, Schnupp JW. Responses of auditory cortex to complex stimuli: functional organization revealed using intrinsic optical signals. J Neurophysiol. 2008;99:1928–1941. doi: 10.1152/jn.00469.2007. [DOI] [PMC free article] [PubMed] [Google Scholar]
- Nicholson C, Freeman JA. Theory of current source-density analysis and determination of conductivity tensor for anuran cerebellum. J Neurophysiol. 1975;38:356–368. doi: 10.1152/jn.1975.38.2.356. [DOI] [PubMed] [Google Scholar]
- Nourski KV, Brugge JF. Representation of temporal sound features in the human auditory cortex. Rev Neurosci. 2011;22:187–203. doi: 10.1515/RNS.2011.016. [DOI] [PubMed] [Google Scholar]
- Patterson RD. Auditory filter shapes derived with noise stimuli. J Acoust Soc Am. 1976;59:640–654. doi: 10.1121/1.380914. [DOI] [PubMed] [Google Scholar]
- Plack CJ, Oxenham AJ, Popper AN, Fay RR, editors. Pitch: neural coding and perception. New York: Springer; 2005. [Google Scholar]
- Pollak GD, Xie R, Gittelman JX, Andoni S, Li N. The dominance of inhibition in the inferior colliculus. Hear Res. 2011;274:27–39. doi: 10.1016/j.heares.2010.05.010. [DOI] [PMC free article] [PubMed] [Google Scholar]
- Ptitsyn AA, Zvonic S, Gimble JM. Permutation test for periodicity in short time series data. BMC Bioinformatics. 2006;7(Suppl 2):S10. doi: 10.1186/1471-2105-7-S2-S10. [DOI] [PMC free article] [PubMed] [Google Scholar]
- Recanzone GH, Guard DC, Phan ML. Frequency and intensity response properties of single neurons in the auditory cortex of the behaving macaque monkey. J Neurophysiol. 2000;83:2315–2331. doi: 10.1152/jn.2000.83.4.2315. [DOI] [PubMed] [Google Scholar]
- Rose JE, Brugge JF, Anderson DJ, Hind JE. Phase-locked response to low-frequency tones in single auditory nerve fibers of the squirrel monkey. J Neurophysiol. 1967;30:769–793. doi: 10.1152/jn.1967.30.4.769. [DOI] [PubMed] [Google Scholar]
- Sadagopan S, Wang X. Contribution of inhibition to stimulus selectivity in primary auditory cortex of awake primates. J Neurosci. 2010;30:7314–7325. doi: 10.1523/JNEUROSCI.5072-09.2010. [DOI] [PMC free article] [PubMed] [Google Scholar]
- Schwarz DW, Tomlinson RW. Spectral response patterns of auditory cortex neurons to harmonic complex tones in alert monkey (Macaca mulatta) J Neurophysiol. 1990;64:282–298. doi: 10.1152/jn.1990.64.1.282. [DOI] [PubMed] [Google Scholar]
- Sedley W, Teki S, Kumar S, Overath T, Barnes GR, Griffiths TD. Gamma band pitch responses in human auditory cortex measured with magnetoencephalography. Neuroimage. 2012;59:1904–1911. doi: 10.1016/j.neuroimage.2011.08.098. [DOI] [PMC free article] [PubMed] [Google Scholar]
- Serafin JV, Moody DB, Stebbins WC. Frequency selectivity of the monkey's auditory system: psychophysical tuning curves. J Acoust Soc Am. 1982;71:1513–1518. doi: 10.1121/1.387851. [DOI] [PubMed] [Google Scholar]
- Shackleton TM, Carlyon RP. The role of resolved and unresolved harmonics in pitch perception and frequency modulation discrimination. J Acoust Soc Am. 1994;95:3529–3540. doi: 10.1121/1.409970. [DOI] [PubMed] [Google Scholar]
- Shamma SA, Symmes D. Patterns of inhibition in auditory cortical cells in awake squirrel monkeys. Hear Res. 1985;19:1–13. doi: 10.1016/0378-5955(85)90094-2. [DOI] [PubMed] [Google Scholar]
- Shera CA, Guinan JJ, Jr, Oxenham AJ. Revised estimates of human cochlear tuning from otoacoustic and behavioral measurements. Proc Natl Acad Sci U S A. 2002;99:3318–3323. doi: 10.1073/pnas.032675099. [DOI] [PMC free article] [PubMed] [Google Scholar]
- Stark E, Abeles M. Predicting movement from multiunit activity. J Neurosci. 2007;27:8387–8394. doi: 10.1523/JNEUROSCI.1321-07.2007. [DOI] [PMC free article] [PubMed] [Google Scholar]
- Steinmann I, Gutschalk A. Sustained BOLD and theta activity in auditory cortex are related to slow stimulus fluctuations rather than to pitch. J Neurophysiol. 2012;107:3458–3467. doi: 10.1152/jn.01105.2011. [DOI] [PubMed] [Google Scholar]
- Steinschneider M, Tenke CE, Schroeder CE, Javitt DC, Simpson GV, Arezzo JC, Vaughan HG., Jr Cellular generators of the cortical auditory evoked potential initial component. Electroencephalogr Clin Neurophysiol. 1992;84:196–200. doi: 10.1016/0168-5597(92)90026-8. [DOI] [PubMed] [Google Scholar]
- Steinschneider M, Reser DH, Fishman YI, Schroeder CE, Arezzo JC. Click train encoding in primary auditory cortex of the awake monkey: evidence for two mechanisms subserving pitch perception. J Acoust Soc Am. 1998;104:2935–2955. doi: 10.1121/1.423877. [DOI] [PubMed] [Google Scholar]
- Steinschneider M, Fishman YI, Arezzo JC. Representation of the voice onset time (VOT) speech parameter in population responses within primary auditory cortex of the awake monkey. J Acoust Soc Am. 2003;114:307–321. doi: 10.1121/1.1582449. [DOI] [PubMed] [Google Scholar]
- Sukov W, Barth DS. Three-dimensional analysis of spontaneous and thalamically evoked gamma oscillations in auditory cortex. J Neurophysiol. 1998;79:2875–2884. doi: 10.1152/jn.1998.79.6.2875. [DOI] [PubMed] [Google Scholar]
- Supèr H, Roelfsema PR. Chronic multiunit recordings in behaving animals: advantages and limitations. Prog Brain Res. 2005;147:263–282. doi: 10.1016/S0079-6123(04)47020-4. [DOI] [PubMed] [Google Scholar]
- Tiesinga P, Fellous JM, Sejnowski TJ. Regulation of spike timing in visual cortical circuits. Nat Rev Neurosci. 2008;9:97–107. doi: 10.1038/nrn2315. [DOI] [PMC free article] [PubMed] [Google Scholar]
- Tramo MJ, Shah GD, Braida LD. Functional role of auditory cortex in frequency processing and pitch perception. J Neurophysiol. 2002;87:122–139. doi: 10.1152/jn.00104.1999. [DOI] [PubMed] [Google Scholar]
- Vaughan HG, Jr, Arezzo JC. The neural basis of event-related potentials. In: Picton TW, editor. Human event-related potentials, EEG handbook, revised series. Vol 3. New York: Elsevier; 1988. pp. 45–96. [Google Scholar]
- Walker KM, Bizley JK, King AJ, Schnupp JW. Multiplexed and robust representations of sound features in auditory cortex. J Neurosci. 2011;31:14565–14576. doi: 10.1523/JNEUROSCI.2074-11.2011. [DOI] [PMC free article] [PubMed] [Google Scholar]
- Wang HP, Spencer D, Fellous JM, Sejnowski TJ. Synchrony of thalamocortical inputs maximizes cortical reliability. Science. 2010;328:106–109. doi: 10.1126/science.1183108. [DOI] [PMC free article] [PubMed] [Google Scholar]
- Wang X, Walker KM. Neural mechanisms for the abstraction and use of pitch information in auditory cortex. J Neurosci. 2012;32:13339–13342. doi: 10.1523/JNEUROSCI.3814-12.2012. [DOI] [PMC free article] [PubMed] [Google Scholar]
- Wang X, Lu T, Bendor D, Bartlett E. Neural coding of temporal information in auditory thalamus and cortex. Neuroscience. 2008;157:484–494. doi: 10.1016/j.neuroscience.2008.07.050. [DOI] [PubMed] [Google Scholar]
- Whitfield IC. Auditory cortex and the pitch of complex tones. J Acoust Soc Am. 1980;67:644–647. doi: 10.1121/1.383889. [DOI] [PubMed] [Google Scholar]
- Womelsdorf T, Schoffelen JM, Oostenveld R, Singer W, Desimone R, Engel AK, Fries P. Modulation of neuronal interactions through neuronal synchronization. Science. 2007;316:1609–1612. doi: 10.1126/science.1139597. [DOI] [PubMed] [Google Scholar]
- Yin P, Johnson JS, O'Connor KN, Sutter ML. Coding of amplitude modulation in primary auditory cortex. J Neurophysiol. 2011;105:582–600. doi: 10.1152/jn.00621.2010. [DOI] [PMC free article] [PubMed] [Google Scholar]
- Zatorre RJ. Pitch perception of complex tones and human temporal-lobe function. J Acoust Soc Am. 1988;84:566–572. doi: 10.1121/1.396834. [DOI] [PubMed] [Google Scholar]