

Abstract
The brain represents sensory information in the coordinated activity of neuronal ensembles. Although the microcircuits underlying olfactory processing are well characterized in Drosophila, no studies to date have examined the encoding of odor identity by populations of neurons and related it to the odor specificity of olfactory behavior. Here we used two-photon Ca2+ imaging to record odor-evoked responses from >100 neurons simultaneously in the Drosophila mushroom body (MB). For the first time, we demonstrate quantitatively that MB population responses contain substantial information on odor identity. Using a series of increasingly similar odor blends, we identified conditions in which odor discrimination is difficult behaviorally. We found that MB ensemble responses accounted well for olfactory acuity in this task. Kenyon cell ensembles with as few as 25 cells were sufficient to match behavioral discrimination accuracy. Using a generalization task, we demonstrated that the MB population code could predict the flies' responses to novel odors. The degree to which flies generalized a learned aversive association to unfamiliar test odors depended upon the relative similarity between the odors' evoked MB activity patterns. Discrimination and generalization place different demands on the animal, yet the flies' choices in these tasks were reliably predicted based on the amount of overlap between MB activity patterns. Therefore, these different behaviors can be understood in the context of a single physiological framework.
Introduction
Understanding the relationship between neural activity and sensory perception remains one of the fundamental problems in systems neuroscience (Parker and Newsome, 1998; Rieke et al., 1999). The issue has long been studied in vertebrates (Sparks et al., 1976; Georgopoulos et al., 1986; Shadlen and Newsome, 1998), but the complexity of large brains makes it difficult to link identified neural circuits to behavior. Invertebrates have relatively simple brains yet boast a rich behavioral repertoire, making them ideal models for studying neural coding in well defined microcircuits (Camhi and Levy, 1989; Theunissen and Miller, 1991; Briggman et al., 2005).
The olfactory system of Drosophila is anatomically well defined and genetically manipulable (Vosshall and Stocker, 2007), making it an excellent platform for linking circuit-level neural activity to behavior. Odors with innate meaning, such as pheromones or alarm signals (Suh et al., 2004; Sachse et al., 2007; Datta et al., 2008; Root et al., 2008; Ruta et al., 2010), tend to evoke neural activity in specific “labeled lines.” However, most odorants are chemically diverse (Koulakov and Rinberg, 2011) and their variety cannot be captured by a small number of labeled lines. Therefore, when learning to identify arbitrary odors, the animal must have access to the combinatorial representation that originates in the pattern of responding sensory neurons (de Bruyne et al., 2001; Hallem and Carlson, 2006). Information from the periphery is propagated through the antennal lobe to the mushroom body (MB), an area necessary for olfactory learning and memory (de Belle and Heisenberg, 1994; Dubnau et al., 2001; McGuire et al., 2001). The odor responses of Kenyon cells (KCs), the principle neurons of the MB, are substantially more selective than their antennal lobe inputs (Laurent and Naraghi, 1994; Perez-Orive et al., 2002; Turner et al., 2008; Wang et al., 2008; Honegger et al., 2011). Theoretical studies suggest that these more sparse responses are useful for accurate learning because they minimize overlap between response patterns to different odors (Kanerva, 1988; Laurent, 2002). But how much overlap exists between different MB odor representations? Does overlap influence how accurately animals learn to discriminate similar odorants and generalize responses to novel stimuli?
We used cellular-resolution Ca2+ imaging to examine odor representations in large KC ensembles (typically >100 cells). This enabled us to directly characterize the overlap between different representations in individual flies. We assessed how effectively KC activity patterns convey odor identity using linear classification techniques. First, we examined odor specificity in a fine discrimination task using odor blends. Pairs of similar blends that were difficult for the animals to discriminate were also difficult for our classifier to distinguish. Olfactory information was distributed across the population, but ensembles of only 25 KCs were sufficient to produce classification accuracy that matched behavior. Second, we investigated whether we could use the activity patterns we measured to predict flies' behavioral responses to novel odors in a generalization task. We found that associations learned with one odor were reliably generalized to odors evoking similar (but distinct) MB activity patterns. Therefore, one feature, the overlap between odor representations, was a good predictor of behavior in both discrimination and generalization tasks. Furthermore, we found that activity patterns in naive flies were sufficient to make this prediction.
Materials and Methods
Animal preparation
Flies carrying the genetically encoded calcium sensor UAS-GCaMP3 (Tian et al., 2009) were crossed with OK107-Gal4 flies (Connolly et al., 1996) to drive GCaMP3 expression in essentially all KCs (Lee and Luo, 1999; Aso et al., 2009). All experiments were conducted on female F1 heterozygotes from this cross, aged 2–5 d post-eclosion. Procedures for animal preparation were as described previously (Turner et al., 2008; Murthy and Turner, 2010; Honegger et al., 2011). Flies were anesthetized temporarily on ice and inserted into a small hole cut in the recording platform. The animal's head was tilted forward, exposing the olfactory organs to the odor delivery nozzle located on the underside of the platform. The fly was fixed in place with fast-drying epoxy (Devcon 5 min epoxy). The top of the fly was bathed in oxygenated saline (Wilson et al., 2004) and the cuticle overlying the brain was dissected away. Air sacs overlying the MBs were pushed aside, but we did not attempt to remove the perineural sheath. To minimize movement of the brain inside the head capsule, we removed the pulsatile organ at the neck and the proboscis retractor muscles that pass over the caudal aspect of the optic lobes.
Odor delivery
The following chemicals were used as stimuli: 2-heptanone (CAS #110-43-0), 3-octanol (CAS #589-98-0), 6-methyl-5-hepten-2-one (CAS #110-93-0), α-humulene (CAS #6753-98-6), benzaldehyde (CAS #100-52-7), ethyl lactate (CAS #97-64-3), ethyl octanoate (CAS #106-32-1), hexanal (CAS #66-25-1), isoamyl acetate (CAS #123-92-2), 4-methylcyclohexanol (CAS #589-91-3), methyl octanoate (CAS #111-11-5), diethyl succinate (CAS #123-25-1), pentanal (CAS #110-62-3), butyl acetate (CAS #123-86-4), 1-octen-3-ol (CAS #3391-86-4), 1-hepten-3-ol (CAS #4938-52-7), and pentyl acetate (CAS #628-63-7).
Odors were presented using a custom-built delivery system that uses serial air dilutions to control odor concentration while maintaining a constant total airflow of 1 L/min at the fly. Experiments were conducted at an odor dilution of 1:100 or, where appropriate, adjusted to match the concentrations used behaviorally. We used a photo-ionization detector (Aurora Scientific) to match concentrations between the imaging rig and the T-maze and to monitor odor delivery throughout each imaging experiment. Odor pulses were created by switching between clean and odorized air streams using a synchronous two-way valve (N-Research). This final valve was located ∼50 cm from the fly, leading to a delay of ∼300 ms between valve switching and the odor reaching the fly. The flow path was 1/8 inch in diameter throughout, which enabled the system to work near atmospheric pressure at these flow rates. The distance of the valve from the fly and the large tubing diameter virtually eliminated pressure transients caused by valve switching, as measured by the photo-ionization detector and a hot-wire anemometer.
Calcium imaging
Two-photon imaging was performed using a Prairie Ultima system (Prairie Technologies) and a Ti-Sapphire laser (Chameleon XR; Coherent) tuned to 920 nm delivering 8–10 mW at the sample. All images were acquired with Olympus water-immersion objectives (LUMPlanFl/IR, 60×, numerical aperture 0.9; LUMPlanFl/IR, 40×, numerical aperture 0.8). Imaging planes were selected to maximize the number of visible KCs. Typically imaging frames were ∼300 × 300 pixels, acquired with a pixel dwell time of 1.6 μs, yielding frame rates near 3.8 Hz. On average, 120 KCs (range: 60–170) were monitored in one plane.
Custom MATLAB (MathWorks) routines were used to control odor presentation and synchronize stimulus delivery with data acquisition. Data were acquired in 20 s sweeps with a 1 s odor pulse triggered 8 s after sweep onset. The interstimulus interval was 25 s. Stimuli were presented in randomly interleaved fashion, adjusted so that the same odor was never presented twice in succession.
Imaging analysis
Data were analyzed using MATLAB and R (http://www.R-project.org). To correct for motion within the field of view, frames were aligned using 2D image registration approaches. In many cases, a Fourier-based subpixel translation correction was sufficient (Guizar-Sicairos et al., 2008). Some animals required an affine transform to cope with global distortions, such as rotational movement of the brain (Thirion, 1998). Where necessary a nonrigid transform was used to correct more localized distortions (Klein et al., 2010).
Fluorescent neural tissue was automatically segmented from the surrounding regions. Pixel intensity values from the area outside this boundary were considered to represent background (tissue autofluorescence plus shot noise) and the mean pixel intensity value from the background was then subtracted from the overall image.
To quantify the response of the KCs a small, circular region of interest 6–8 pixels in diameter was applied to each cell body. This allowed averaging of the pixel intensity values from each cell, treating individual KCs as separate units. Care was taken to ensure that each selected cell remained within its region of interest over the whole imaging session. Response amplitudes were calculated as the mean change in fluorescence (dF/F) in the 0.5–4.5 s window after stimulus onset. Note that a subset of the imaging data (those shown in Fig. 1 and some of the pure odors in Fig. 3) were used to estimate sparseness in Honegger et al. (2011).
Figure 1.
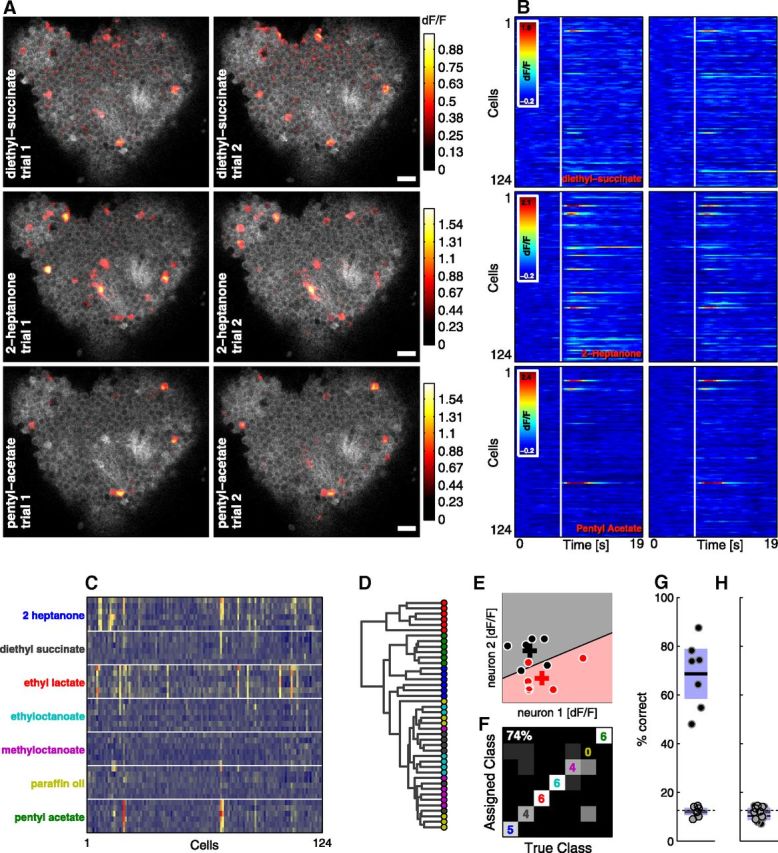
Two-photon calcium imaging demonstrates that MB population activity accurately conveys odor identity. A, Odor response patterns in the cell body layer of the MB. dF/F responses (color bar) are shown overlaid on baseline fluorescence (grayscale). The six panels show the first two presentations of three different odors. Stimuli are randomly interleaved. Scale bar, 10 μm. (B) dF/F time courses of 124 KCs extracted from the data shown in A. The white line indicates the onset of a 1 s odor pulse. C, Mean evoked dF/F responses of the 124 KCs (columns) to individual odor presentations (rows), showing reliable, distinct responses to different odors. Rows are grouped by odor for display purposes. D, Dendrogram showing Euclidean distances between the rows (response vectors) shown in C. Colors correspond to odor labels in C. E, Schematic of our classification algorithm. Circles show evoked responses for single presentations of two different odors (red and black) for two cells. Crosses indicate mean responses (centroids) to each odor. The black line (decision boundary) is determined by the classification algorithm and separates the groups. F, Confusion matrix showing odor classification assignments for the example recording in C. Three odors were classified correctly in six of six trials. Overall classification accuracy across the entire stimulus set was 74%. Colors correspond to odor labels in C. G, Overall classification accuracy is consistently high in different flies (black points; n = 7). Dashed line indicates theoretical chance performance (14%), whereas gray points show chance performance determined by randomizing odor labels. Each point is the mean of 50 randomized runs. Black lines indicate means, and blue shaded boxes represent 95% confidence intervals for the mean. H, Compares classifier chance performance (same gray points and dashed line as G) to performance when cell identity is randomized independently on each trial (black points).
Figure 3.
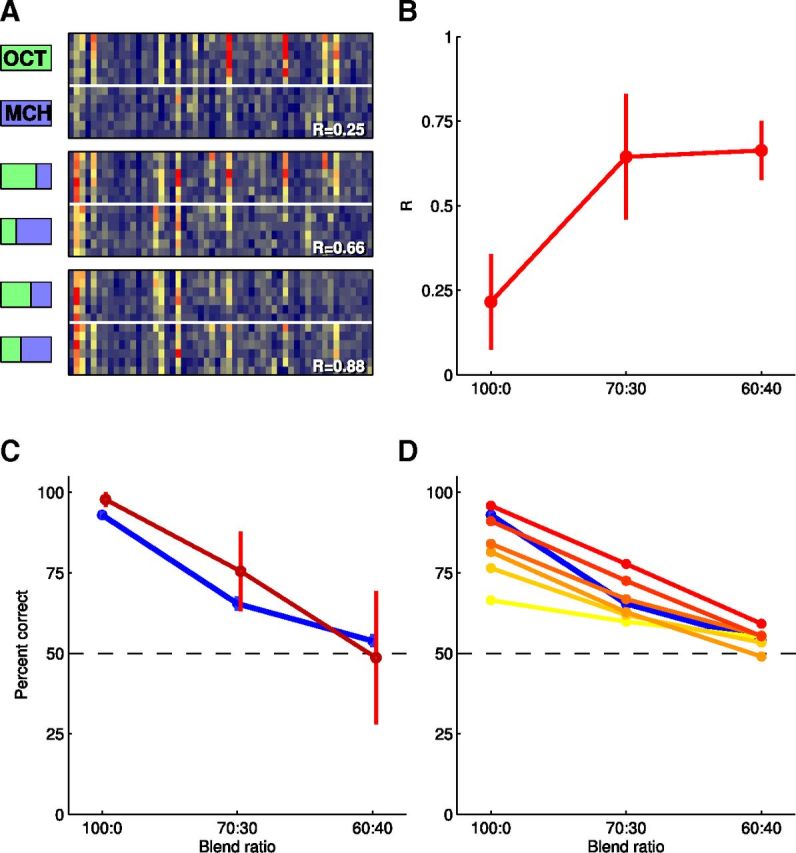
Predicting behavioral discrimination accuracy from neural activity. A, Mean evoked dF/F from 54 cells recorded in one experiment in which all three blend pairs (colored bars) were presented. Each stimulus was presented six times each in a random order. Data grouped by blend for display purposes. R-values indicate correlation coefficient between mean responses to each blend pair. B, Correlation coefficients between blend pairs obtained from 11 animals. Errors bars are 95% confidence interval for the mean. C, Discrimination accuracy predicted by a linear classifier (red line; neurometric function). Blue line: psychometric function reproduced from Figure 2B. D, The performance of the classifier across a range of different neuronal population sizes (colors going from yellow to red: k = 3, 6, 9, 12, 25, 50). Blue line: psychometric function reproduced from Figure 2B.
A statistical test originally described in Honegger et al. (2011) was used to determine whether a KC responded significantly on a given trial. Briefly, the SD of the baseline activity was obtained 8 s before stimulus onset. The response time course was then smoothed using a five-point running average to control for outliers. The peak dF/F in the 0.5–4.5 s window after stimulus onset was determined. The response was judged to be significant if this peak was 2.33 SDs greater than the baseline, which corresponds to a one-tailed significance test where α = 0.01.
Odor classification
A linear classification algorithm was used to predict odor identity based upon neural activity. This approach was chosen because it is well established (Fisher, 1936), has been commonly used both within (MacLeod et al., 1998; Friedrich and Laurent, 2001; Broome et al., 2006; Bhandawat et al., 2007; Silbering et al., 2008; Cury and Uchida, 2010) and outside olfaction (Briggman et al., 2005; Walker et al., 2008), and can be implemented biologically with simple integrate-and-fire neurons. The population responses of KCs are represented by points in a space and our algorithm uses the Euclidean distance between these points as a measure of similarity (Gochin et al., 1994; MacLeod et al., 1998). Each axis in this space represents the response magnitude of one KC. The number of different axes (i.e., the dimensionality of this space) corresponds to the number of KCs recorded in one imaging session. This multidimensional representation was used to classify the odor response patterns observed on single trials based on their similarity to the average response patterns for each of the different odors. Classification was implemented using leave-one-out cross-validation to avoid overfitting. In this method, the response pattern of interest is removed from the dataset. Then, for each odor, response patterns of individual trials are averaged to yield a mean response. In the multidimensional space, these means are the centroids of the individual responses to each of the different odors. In this way, the missing odor response does not contribute to calculating the centoids, which could lead to overfitting. The odor identity of the withheld response pattern is then classified by assigning it to the centroid nearest in Euclidean space. Biologically, linear classification could be readily implemented by a downstream neuron that linearly integrates KC inputs with different synaptic weights, with a spike threshold set so it responds selectively to one class of KC activity patterns.
Our classifier is similar to linear discriminant analysis (LDA; Fisher, 1936) because it effectively draws a straight classification boundary between each pair of groups. Different algorithms make different assumptions about the structure of the data and can produce different results (Hung et al., 2005). To evaluate the generality of our findings, our data were also run through other classifiers (Venables and Ripley, 1999) such as LDA, support vector machines (SVM), and a perceptron-based neural network (Hamel, 2009; SVM was performed using a freely available package, LIBSVM, http://www.csie.ntu.edu.tw/cjlin/libsvm). The distance-based algorithm was selected because, unlike LDA, it does not require an initial dimensionality reduction step and, unlike SVM and perceptrons, it generalizes naturally to multiple groups. Finally, our classifier could be adapted easily for studying generalization (see Fig. 4 and Results for a description of the adaptation). For more detail on applying discriminant analysis to neural data, see the supplemental material of Briggman et al. (2005) and Campbell et al. (2008).
Figure 4.

Discrimination and generalization of similar odors. A, Three example MB recordings showing response patterns evoked by the odors PA, BA, and EL, averaged across all trials. Responses to BA and PA are similar and distinct from EL. B, Venn diagram showing overlap of significantly responding cells from all recordings (n = 24). Many neurons tend to respond to both PA and BA, whereas most EL-responsive KCs respond only to EL. C, Correlation scores for each pair of odors. Each point is the correlation score calculated from the average MB response to each odor within a single recording (n = 24 recordings). The correlation between PA and BA is significantly (see main text) greater than the other two. Dark gray box indicates 95% confidence interval; light gray box indicates 1 SD; black line is the mean. D, Euclidean distances between odor responses within recordings (circles). Distances are based upon average MB response patterns. Each point indicates the PA-BA distance (x-axis) versus either the PA-EL (orange) or BA-EL (brown) distance (y-axis). Statistics reported in D–F are results of a one-tailed binomial test. E, Linear classifier based on Euclidean distance distinguishes PA from BA (left) and BA from PA (right) above chance (dashed line at 50%) for all recordings. Black line is the mean. F, When the classifier is trained to detect PA, but tested with BA versus EL, BA is consistently chosen over EL (left). Likewise, when trained to BA, PA is chosen more often (right). G, Flies can discriminate PA and BA. Gray lines show choices of yoked control/experimental group pairs. Pairing PA with shock significantly reduces the number of flies choosing PA compared with un-shocked controls (paired t test, one-tailed). Black line indicates the mean across experiments. The label “PA: PA vs BA” indicates that flies in the experimental group were shocked to PA, then given a choice between PA and BA. Odor preference was calculated against PA in this case. Similar results were obtained in the reciprocal case, “BA: BA vs PA” (right). H, Flies generalize across PA and BA when tested against EL. Flies shocked to PA and given a choice between BA and EL chose BA less often (paired t test, two-tailed) than the PA-exposed-only control group (left). Right panel shows reciprocal experiment with flies shocked to BA. In only one case was the proportion of flies choosing PA greater in the shocked group than its yoked control (red).
Behavioral experiments
Behavioral experiments were done using the T-maze olfactory learning paradigm (Tully and Quinn, 1985) with the Canton-S w1118 (iso1CJ) fly strain (Blum et al., 2009). Groups of ∼100 flies were loaded into an electrifiable chamber, where odor presentation was paired with shock (12 60 V stimuli of 1.5 s duration presented over a period of 1 min). Flies were then lowered to a choice point at the junction of two odorized chambers, each containing a different odor. Two conditioning protocols were used, as described below.
Odor blend discrimination experiments.
For the experiments shown in Figure 2 and Figure 3, flies were presented with one odor paired with shock, followed by presentation of a second odor in the absence of shock. Flies were then given a choice between the two odors experienced during the training phase. Performance was quantified as the proportion of flies correctly avoiding the odor previously paired with shock. In these experiments, odor concentrations were set so that naive flies distributed evenly between the two choices, so chance performance was 50%. A reciprocal experimental design was used in which, for a pair of odors, one group of flies was trained to avoid one odor and a separate group of flies was trained to avoid the other. For example, with the 70:30 blends, in the first phase of the experiment, one group of flies was shocked in the presence of 70 3-octanol (OCT) to 30 4-methylcyclohexanol (MCH) and then exposing them to 30 OCT: 70 MCH without shock. These flies were then given a choice between these two blends. In the second phase, a different set of flies was shocked in the presence of 30 OCT: 70 MCH, exposed to 70 OCT: 30 MCH, and then given the same choice in the testing phase. The mean of the scores from the two halves of the reciprocal experiment constituted a single data point in Figure 2B; performance was very similar for the reciprocal tests.
Figure 2.
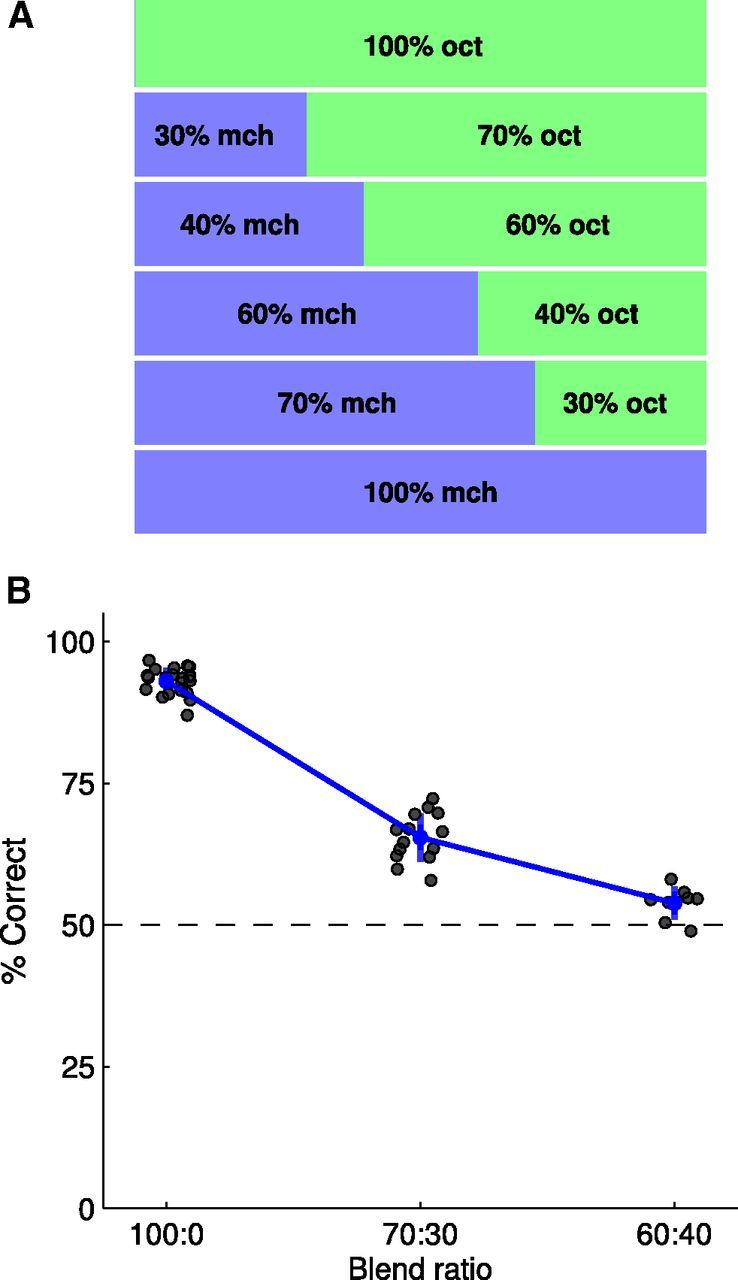
Discriminating odor blends. A, Increasingly similar odors were constructed by blending OCT and MCH over three pairs of increasingly similar blend ratios. B, Accuracy of olfactory discrimination. Flies accurately discriminated pure OCT from pure MCH (100:0), but do progressively worse with blends of the two odors (70:30 and 60:40). Training on the more similar blend (60:40) produces performance just above chance. Bars represent 95% confidence interval of the mean.
Odor generalization experiments.
For experiments shown in Figure 4, Figure 5, and Figure 6, the protocol involved pairing shock with a single odor and then directly giving flies a choice between two different odors. A yoked design was used with two sets of flies run through the T-maze in succession: an experimental group that received shock in the presence of an odor and a control group that simply received odor exposure without shock. This second group established how flies distributed between the choice odors under control conditions. The odor choices of trained flies were compared to the distribution of odor-exposed flies to establish whether training modified their choices. For generalization, flies were trained with one odor and then given a choice between two odors they had not experienced previously, one of which was predicted to be similar to the trained odor. It was also confirmed that flies could distinguish similar odors by training flies with one odor and testing their choice between that stimulus and a similar odor.
Figure 5.

MB activity makes accurate predictions about generalization across chemically distinct odors. A, Euclidean distances between odor pairs were compared within recordings (Fig. 4D) for three odor trios. Instances of generalization are predicted by A1 and A2. In A3, the points lie along the unity line so no generalization is predicted. B, Generalization across odors based on MB activity (as in Fig. 4F). The classifier significantly generalizes between HP and PA (B1) and OCT and OE (B2). No generalization is predicted for the HP/BA/PA trio (B3). Each point corresponds to results from a single recording; black line is the mean. C, Odor generalization behavior in the T-maze (as in Fig. 4H). C1, Flies shocked to PA chose HP over EL less often than yoked PA-exposed controls (left), and vice versa (right). C2, Flies shocked to OE chose OCT over HE less often than yoked OE-exposed controls (left) and vice versa (right). C3, Flies shocked to HP did not choose PA or BA significantly less often than HP-exposed controls (left). Flies shocked to PA did choose HP over BA slightly, but significantly, less often than PA-exposed controls (right). Data for BA: PA vs HP experiment are not shown, but no significant generalization of the BA-shock association to either HP or PA was observed.
Figure 6.

Summary of behavioral performance across all odor trios. A, Schematic displaying the labeling conventions for experimental configurations shown in B–E. B–E, Discrimination and generalization of all odor trios. Each experiment is identified by a three-component pie chart, with slice color indicating the identities and roles of the three odors in each experiment. Pies are centered at the mean behavioral preference score, calculated as the difference between the yoked experimental and control groups (shocked or exposed-only to the odor indicated by the lower slice color) in proportion of flies choosing TestA (upper-left slice color) over TestB (upper-right slice color). Gray bars indicate the 95% t-confidence interval for each experiment. Difference in proportion of flies choosing TestA is significantly different from zero (p < 0.05) for all experiments except the last two in E, HP: PA vs BA (p = 0.055) and BA: PA vs HP (p = 0.29). Note that no odor pair from this trio, PA/HP/BA, was predicted to display generalization.
This protocol was adapted from standard associative conditioning procedures (Tully and Quinn, 1985; Yu et al., 2006; Akalal et al., 2010). Note that we did not explicitly test for nonassociative effects of the shock using conditions in which shock and odor are presented in an unpaired manner, such that odor does not predict shock. Nonassociative effects of shock have been shown to affect olfactory behavior of some mutant strains (Préat, 1998). However, Préat (1998) also found that odor avoidance in Canton-S flies was unaffected by the shock intensity used in the present study (60 V).
Results
Physiological recordings have shown that individual KCs exhibit highly odor-selective responses (Perez-Orive et al., 2002; Turner et al., 2008) and that odors induce sparse activation of the KC population (Wang et al., 2004; Honegger et al., 2011). This selectivity has been proposed to underlie the stimulus specificity of olfactory learning (Laurent, 2002; Perez-Orive et al., 2002). Here we examined the encoding of odor identity by large ensembles of KCs using the calcium indicator GCaMP3 (Tian et al., 2009) and in vivo two-photon imaging. By tracking activity of >100 KCs simultaneously, we tested how the information carried at the population level relates to the odor specificity of learned olfactory behaviors. We first examined whether the information available matches the behavioral accuracy of fine odor discrimination. We then tested whether we could use that information to predict behavioral responses in a generalization task.
Odor identity is represented by unique KC activity patterns
To determine whether activity patterns in the KC population convey odor identity reliably and precisely, we first examined population responses to a variety of different monomolecular compounds. To obtain a population-level view of MB representations, we targeted expression of GCaMP3 to the MB using the Gal4 driver OK107, which is expressed in the entire population of ∼2000 KCs (Lee and Luo, 1999; Aso et al., 2009). [Flies heterozygous for GCaMP3 and OK107 display normal aversive olfactory learning in the T-maze (Y. Shuai, personal communication)]. Individual KC somata were readily identified based on the resting fluorescence of the indicator (Fig. 1A, gray regions), enabling us to track responses with cellular resolution. To maximize the number of KCs that could be imaged simultaneously, we oriented the preparation so that the imaging plane was parallel with the disc-shaped field of KC somata. We used image registration algorithms (see Materials and Methods) to allow large numbers of cells to be tracked over the course of an experiment. Figure 1A–D shows data from an individual fly for which we obtained signals from 124 KCs. A total of six different odors (plus a paraffin oil control) were presented in a randomly interleaved fashion. Figure 1A shows responses evoked by three of these odors across repeated presentation trials. Responses were strong and repeatable, with similar activity patterns for the same odor in both trials. Figure 1B shows the response time courses of these cells for the odors and trials depicted in Figure 1A. The responses of individual neurons were fairly consistent across different presentations of the same odor, showing a level of trial to trial variability typical of GCaMP3 recordings (Tian et al., 2009). To summarize the responses to all 7 stimuli across all trials we quantified response amplitudes by averaging the fluorescence change (dF/F) in a 4 s window after stimulus onset. Figure 1C shows the responses observed in these 124 cells to the 42 different stimulus presentations (7 different stimuli presented 6 times each in a randomized order; repeated presentations of the same stimulus are grouped for display). Each row in this matrix shows the evoked responses of all cells on one trial. Therefore, the matrix summarizes the whole experiment, describing both response strength and response reliability. These are the most important factors limiting how accurately a neuronal population can represent information (Rieke et al., 1999).
Visual inspection of the response matrix (Fig. 1C) shows clear and reliable differences between population responses to many of the odors. Figure 1D shows these data as a dendrogram based upon the Euclidean distance between the response vectors (Fig. 1C, rows). The odors (circles, the colors of which correspond to the labels used in Fig. 1C) ethyl lactate (EL), pentyl acetate (PA), and 2-heptanone (HP) form groups that are largely distinct from each other. The remaining odors evoked responses that were weaker and less distinct. Therefore, both plots indicate that odor-specific information was present in these activity patterns, which could be used for distinguishing different odors behaviorally. Although they are useful visualizations, neither plot constitutes a statistical test of how distinctly different odors are represented, so we next quantified how accurately KC populations could discriminate odors.
To extract information from the KC population, we used a classification approach similar to that used by Gochin et al. (1994). A classifier provides a way of quantifying information content of a neural population (Nelken et al., 2005) while taking into account the intrinsic variability (Werner and Mountcastle, 1965; Tomko and Crapper, 1974) found in neural activity. Figure 1E explains the principle of our approach using a small subset of the data from Figure 1C. Each data point shows the mean evoked dF/F of two KCs for one presentation of one odor. The different colors represent different odors. The two crosses indicate the average evoked response (centroid) over all trials of each odor. The black line is the discrimination boundary and is drawn midway between the two centroids and perpendicular to the axis that links them. All locations falling within the gray area are nearer to the black centroid and all locations falling within the pink area are nearer to the red centroid. All data points within the gray area are classified as “black” and all points with the pink area are classified as “red.” In this case, one red point and one black point were misassigned by the classifier. This approach is a simplified version of Fisher's classical linear discriminant analysis (Fisher, 1936).
To implement the algorithm on the full dataset (Fig. 1C), we used leave-one-out cross-validation to avoid overfitting. In this method, one trial is withheld, the centroids of the seven groups are calculated, and the missing trial is assigned to the centroid to which it is closest. This approach avoids overfitting because the observation being tested does not contribute to calculating the centroid locations. The process is repeated for each trial in turn and the results can be summarized as a confusion matrix (Fig. 1F). Squares along the diagonal represent correct classifications. The digits indicate the number of trials (out of six total) that were classified correctly. Misclassifications are represented by nonblack squares situated away from the diagonal. Overall classification accuracy across all stimuli was 74% in this example. Most errors are made with odors that evoke only weak responses. The Euclidean distance classifier performed no worse than more elaborate classification techniques (see Materials and Methods for description), indicating that it is adequate for extracting odor identity from our data.
We repeated this experiment in a total of 7 flies, typically capturing >120 KCs (range, 65–168), which is ∼5% of the total population. The proportion of correct classifications in other flies (Fig. 1G, black points) was similar to that for the example animal (Fig. 1A–F). We attempted to obtain six repeats of each odor, but this was not always possible due to excessive brain motion, particularly drift in the z-dimension. Of the seven animals shown in Figure 1G, six repeats were obtained in three cases, five repeats in one case, and four repeats in the remaining three cases. Scrambling the odor labels caused the classifier to perform at chance levels (Fig. 1G, gray points). The observed classification accuracy (black points) was far higher than chance (dashed line).
Is the classifier using the pattern of responding neurons to determine odor identity or are other features, such as maximum response strength, being used? To test this, we randomized the cell labels independently for each trial so that the variance of the data remained unchanged but the response patterns became scrambled. Running the algorithm on the scrambled matrices resulted in classification accuracies dropping to chance levels (Fig. 1H, black points and dashed line), confirming that it is the pattern of responding KCs that represents odor identity.
These results are significant because they are the first to quantify the degree of odor specificity in the KC population and demonstrate clearly that odor identity is represented in the pattern of evoked responses. It was unknown previously how much information could be extracted from KC activity, which is sparse and sometimes unreliable (Stopfer et al., 2003; Perez-Orive et al., 2004; Ito et al., 2008; Turner et al., 2008) because individual KCs may not fire on all presentations of a stimulus. Therefore, despite the fact that individual KCs respond to few odors and only a small proportion of KCs respond to any given odor, at the population level, KC response patterns represent identity of monomolecular odors with a high level of specificity.
Measuring olfactory acuity using odor blends
We have shown that substantial information on odor identity can be extracted from KC response patterns. What is the relationship between these activity patterns and behavior? Are odors that are difficult for the flies to distinguish also difficult to distinguish based upon KC activity?
We investigated this using two-component odor blends (Uchida and Mainen, 2003; Abraham et al., 2004; Fernandez et al., 2009; Miura et al., 2012) to construct a psychometric function describing odor discrimination accuracy. Blends were created by systematically varying the ratio of the constituents OCT and MCH (Fig. 2A). We chose OCT and MCH because these odors have been used extensively in the fly learning and memory literature (Tully and Quinn, 1985; Yu et al., 2005; Thum et al., 2007) and flies can discriminate them with high accuracy. We conducted the experiment using the T-maze (Tully and Quinn, 1985), an assay in which flies were shocked in the presence of one odor (conditioned stimulus; CS+) and then exposed to the second odor (CS−) in the absence of shock before being given a choice between the two stimuli. Performance at the task was quantified as the proportion of flies correctly avoiding the stimulus previously paired with shock. Pure odors were diluted in mineral oil and their concentrations adjusted so that flies exhibited no bias to either odor (MCH, 1.5:1000; OCT, 1:1000). Odor blends were made by mixing these two oil dilutions at the desired ratios. Each group of flies was trained on one of three different odor blend ratios: 100:0, 70:30, or 60:40 (Fig. 2A). We used a balanced experimental design. For example, at the 60:40 ratio, one group of flies was trained to avoid 60 OCT: 40 MCH and a second group of flies was trained to avoid 40 OCT: 60 MCH; each group was then tested on the choice between 60 OCT: 40 MCH and 40 OCT: 60 MCH. The mean of the two scores is treated as a single independent observation, so the choices of ∼200 flies comprise each data point. Flies performed close to 100% correct for the pure odor pair (Fig. 2B), with performance falling to just above chance for the 60:40 blend. Therefore, using these stimuli, we were able to systematically vary the difficulty of odor discrimination. These behavioral data are, to our knowledge, the first estimate of the acuity of olfactory discrimination in Drosophila (Tully et al., 1994).
KC activity predicts odor discrimination accuracy
We next presented blend stimuli to naive flies on the imaging rig and investigated how accurately the response patterns of each blend pair could be classified. Could we obtain a “neurometric” curve that matched the behavioral, psychophysical (Fig. 2B) curve? By conducting the experiment on naive flies, we tested the basic question, is knowledge of the response patterns before training sufficient for predicting learned behavior? We note that previous imaging experiments (Wang et al., 2008) found there were no bulk changes in neural activity in the MB calyx after aversive conditioning (see Discussion). Figure 3A shows the KC response patterns from one fly in which all three odor blend pairs were tested. The format is the same as that in Figure 1C: each row corresponds to one odor presentation trial and each column to one cell. The blend ratios are indicated by the red/green bars (Fig. 2A). In this example, each stimulus was presented six times, again, in a randomly interleaved manner. As expected, the response patterns became more similar as the blend ratios become closer. We quantified this using correlation coefficients (bottom right of each panel) that indicate the similarity between the mean odor response patterns (means not shown). R-values increased as blends became similar. Figure 3B summarizes the correlation data over all animals (n = 11 flies). The number of stimulus repetitions varied between 5 and 8: n = 5 for 7 flies, n = 6 for 2 flies, n = 7 for 1 fly, and n = 8 for 1 fly.
To compare the imaging data more directly with behavior, we ran our classifier within each odor blend pair for each fly. This allowed us to construct a neurometric curve for odor discriminability (Fig. 3C, red line). The neurometric curve closely matched the behavioral (psychometric, blue) curve, indicating that KC response patterns could yield a good prediction of behavior in this task. This was true across the performance range both for the distinct pure odors and for the 60:40 blend pair, where the animals perform closer to chance.
The correspondence between behavior and physiology is not inevitable because there are instances in which neural activity is a poor predictor of behavior. For example, neurons in the early vertebrate visual system have a flicker fusion threshold that is well above that displayed behaviorally (Martinez-Conde et al., 2002).
The algorithm classifies responses by integrating activity from many (>100) KCs. Trial to trial variability means that using too few cells will result in less accurate performance because the responses of the neuronal ensemble will be ambiguous. How many cells are needed for the classifier's performance to approach that seen behaviorally? To evaluate the impact of neuronal ensemble size on classification accuracy, we trained the algorithm using random subsamples of the KCs recorded in each fly. We drew 50 random subsamples of k cells and evaluated performance for each. This allowed us to derive the mean odor classification accuracy for each subpopulation of size k. The results are plotted as a series of psychometric functions in Figure 3D. The plot shows that mean classification accuracy increases as the size of the subpopulation increases; because variance is high when subpopulations are composed of small numbers of cells, here we show only mean classification accuracy. Performance of the classifier approaches that of the animals' behavior at ∼k = 25 cells. Therefore, a relatively small subset of the total KC population is capable of accurately conveying odor identity in this task. Our approach to reading neural activity is biologically plausible because neurons downstream of KCs have extensive dendritic arbors (Ito et al., 1998; Tanaka et al., 2008) and likely pool from at least this number of inputs. Because our classifier uses a straight decision boundary, a single downstream neuron merely needs to linearly integrate and fire to match the classifier performance.
Generalization between chemically similar odors
The discrimination results suggest that more overlapping stimulus representations are produced by more similar smelling odors. This suggests that the perceptual similarity between two odors can potentially be predicted from the similarity of their evoked KC responses. To test this hypothesis, we used a different behavioral assay: generalization to novel odors.
We began by comparing MB responses to two chemically similar odors, pentyl acetate (PA) and butyl acetate (BA). These monomolecular odorants share a functional group and differ in length by only one carbon. Within each recording from a field of KCs, the averaged response patterns evoked by these two odors are similar and differ substantially from a third, chemically distinct odor, EL (Fig. 4A). Often, a PA-responsive KC also responds to BA (64.6% of all PA-responsive KCs across recordings) and vice versa (63.1%), whereas EL-responsive KCs rarely respond to either of these odors (21.8%; Fig. 4B). In addition, for KCs responsive to both PA and BA, the responses to both odors are typically similar in magnitude (raw example data shown in Fig. 4A).
We first quantified the similarity between MB patterns evoked by each one of these odors using pairwise Pearson's correlations. For each recording, we calculated the correlation coefficient between the averaged response patterns for different odors (Fig. 4C). Across all recordings (n = 24), the correlation score of PA-BA (mean r = 0.70) is substantially and significantly greater than either PA-EL (mean r = 0.15; p < 0.05, one-way ANOVA followed by Tukey's post hoc test) or BA-EL (mean r = 0.11; p < 0.05), indicating that MB response patterns evoked by PA and BA are more similar to each other than either are to EL (Fig. 4C).
The similarity between response patterns can also be measured using Euclidean distances, the same approach as that used for our discrimination classification algorithm (Fig. 1). The magnitude of the Euclidean distance is inversely related to pattern similarity: a Euclidean distance of zero indicates that two patterns are identical. Unlike the correlation coefficient, Euclidean distance takes into consideration absolute response magnitudes. Within recordings, Euclidean distances between PA-BA patterns were shorter than the PA-EL and BA-EL distances, again indicating that PA and BA patterns were most similar to one another (Fig. 4D). To exclude the possibility that the overall response magnitude affected our predictions, we performed the same analysis using a correlation distance metric (1 − Pearson's r), which only reflects pattern similarity. Results obtained using correlation distance match results obtained using Euclidean distances (data not shown). This was true for all subsequent distance comparisons (Fig. 5A1–A3).
To estimate the degree to which these odors would be generalized based on MB activity, we used a generalization variant of the linear classifier. The classifier first calculates the average MB pattern evoked by the reinforced odor, say PA, for each recording and is then challenged with one BA trial and one EL trial. The classifier chooses the trial, either BA or EL, for which the response pattern best matches the learned pattern for PA based on proximity in Euclidean distance. This process is repeated for all possible pairs of BA and EL trials. If the BA and EL patterns are, on average, equidistant from the learned pattern, the classifier will choose BA and EL in equal proportion. However, if BA patterns are consistently closer to the learned PA pattern then the classifier will choose BA over EL more often than chance.
We first investigated whether MB responses to BA and PA are sufficiently different to be identified as distinct. Indeed, there are KCs that respond uniquely to either PA (70 of 2756 total KCs; 2.5%) or BA (75 of 2756 total KCs; 2.7%) and not to both. When discrimination between BA and PA activity patterns is tested using the linear classifier, these two odors are consistently discriminated well above chance across all recordings (Fig. 4E). We next examined the output of the classifier when challenged with the generalization task. When PA is used as the reinforced odor, the classifier chooses BA significantly more often than chance (Fig. 4F, left). Generalization to PA is equally good when BA is the reinforced odor (Fig. 4F, right). Therefore, our classifier shows that neural activity predicts generalization across PA and BA when EL is presented as the alternative, “out-group” odor.
These physiology results make two predictions: (1) that flies should be capable of discriminating between PA and BA, despite the fact that these odors are chemically related and evoke similar response patterns; and (2) that associations learned to PA will readily generalize to BA and vice versa when EL serves as an out-group (comparison) odor. Note that the degree of generalization between any two odors is only predictable with respect to a third defined out-group odor.
We tested these behavioral predictions using a variant of the T-maze learning paradigm. Groups of ∼100 flies are trained to associate one odor (CS+) with electric shock (unconditioned stimulus) and are then given the choice between the CS+ and a novel test odor (discrimination task) or two novel test odors (generalization task; see Materials and Methods for details). The resulting distribution of the flies' choices is compared with how flies distribute when they are simply exposed to the CS+ without receiving shock. This comparison reveals how much the shock modified flies' innate odor preference. Note that this experimental design does not test for nonassociative effects of the shock. Such effects have been observed in some mutant strains, but not in wild-type Canton-S at the shock intensity we use here (Préat, 1998). The training regimen we use here is also different from the standard discriminative training paradigm, in which flies are first shocked in the presence of one odor and then exposed to a second odor in the absence of shock. Because our goal in this series of experiments was to study generalization, we did not include the second phase of training, when flies could potentially learn that the second odor (the CS−) is “safe.” In addition, previous experiments indicated that the CS− is dispensable for forming associations (Masek and Heisenberg, 2008). Our approach, which measures the degree to which innate odor preferences are modified by associative training, enabled us to examine behavioral responses to odors presented at the 1:100 concentration used in imaging experiments without correcting for the innate attractiveness or aversion of the different odors. This approach has been used previously in studies of long-term memory (Yu et al., 2006; Akalal et al., 2010, 2011). We did not attempt to adjust the odor concentrations to equalize their relative innate attractiveness because this would have been impractical given the number of odor pairs tested. Furthermore, it would have required us to iterate back and forth between physiology and behavior, making it impossible to derive behavioral predictions from MB response patterns alone.
We first tested whether flies could distinguish the chemically similar odors PA and BA. Consistent with the results of MB-activity based classification shown in Figure 4E, we found that flies readily discriminated PA and BA. Pairing PA with shock significantly (paired one-tailed test, see figures for details) decreased the proportion of flies choosing PA over BA relative to control flies exposed to PA in the absence of shock (Fig. 4G, left). Similar results were obtained with the reciprocal experiment in which BA was the odor paired with shock; flies now decreased their choice of BA relative to PA (Fig. 4G, right). We next investigated whether flies generalize the aversive association formed with PA to the similar odor, BA. We found that pairing PA with shock significantly decreased the proportion of flies choosing the similar odor, BA, over the out-group odor, EL (Fig. 4H, left). Similar results were obtained with the reciprocal experiment in which flies were shocked during exposure to BA and then given a choice between PA and EL (Fig. 4H, right). The red line in Figure 4H indicates an instance when the flies' choices were the opposite of what we predicted. These behavioral results show that flies generalize between PA and BA when given EL as an alternative.
These results show that flies were clearly able to distinguish this pair of similar odors (Fig. 4G). However, when given the choice between two novel odors, flies avoid the odor that is most similar to the previously shocked odor in terms of both chemical similarity and MB activity patterns. Therefore, for this particular trio of odors, we can accurately predict whether flies will generalize the learned association and use that experience in a novel context.
Generalization between chemically distinct odors
In the preceding generalization experiments, the behavioral outcome could potentially have been predicted simply on the basis of chemical similarity. To further validate the correspondence between behavior and MB activity, we used imaging to search for additional odor trios to test. In this manner, we produced three further predictions that could not be derived from obvious features of chemical structure.
We identified a trio in which each member possesses a different functional group: PA, HP, and EL. For all recordings, the observed Euclidean distance between PA and HP was smaller than the distance between EL and either odor (Fig. 5A1). This predicts that significant generalization should be observed between PA and HP when EL is the out-group odor. As before, this prediction was confirmed using results of the linear classifier. The classifier accurately discriminates between PA and HP (data not shown). For the generalization case, when PA is the reinforced odor, HP is chosen over EL significantly more often than chance (Fig. 5B1, left). The converse is true when HP is the reinforced odor (Fig. 5B1, right). These imaging results predict that flies should generalize between PA and HP with respect to EL as the out-group odor.
We tested this prediction behaviorally as before. Flies easily discriminated between PA and HP (Fig. 6C), confirming that these odors are perceptually distinct. In generalization experiments, when flies were shocked to PA and given the choice between HP and EL, the proportion of flies choosing HP decreased significantly (Fig. 5C1, left). Likewise, flies shocked to HP generalized the association to PA (Fig. 5C1, right). These behavioral observations confirm that flies generalize between PA and HP with EL as the out-group odor. This result could only be predicted from neural activity because the chemical structures of the three odors are diverse.
We next identified an odor trio where the members all share very similar structures. We chose OCT, an 8 carbon alcohol; 1-octen-3-ol (OE), an 8 carbon alcohol with one double bond; and 1-hepten-3-ol (HE), a 7 carbon alcohol with one double bond. From structure alone, it is not clear whether there is a pair of these odors that is more similar than the others or which pair of odors that would be. Imaging revealed that the Euclidean distance between OCT and OE patterns was significantly smaller than the distance between either odor and HE (Fig. 5A2). The linear classifier discriminates accurately between OCT and OE (data not shown). Training the classifier to detect OE in the generalization context leads to it selecting OCT significantly more often than HE (Fig. 5B2, left) and vice versa when trained to detect OCT (Fig. 5B2, right). These results indicate that flies should consistently generalize between OE and OCT when tested against the alternative, HE.
Behaviorally, flies could readily discriminate between OCT and OE (data shown in Fig. 6D). In the generalization experiments, when shocked to OE and given the choice between OCT and HE, flies chose OCT significantly less often than preexposed controls (Fig. 5C2, left). Likewise, flies shocked to OCT generalized the association to OE (Fig. 5C2, right). Therefore, flies generalized between OCT and OE when given HE as an out-group, as predicted by neural activity.
All of the preceding experiments showed positive results: neural activity patterns always predicted clear generalization between a single pair of odors, which was confirmed behaviorally. We thus searched for three odors that were all equally similar to one another. We expected that no clear generalization should be possible among the members of such a trio. When we imaged MB responses to the odors PA, BA, and HP, we found no pair significantly closer in Euclidean distance than any other (p > 0.05 for all three pairs, binomial test; Fig. 5A3). Furthermore, although the linear classifier accurately discriminates between all pairs of the three odors (data not shown), training the classifier with any of the odors in the generalization context produces no consistent cross-identification with any other odor from the trio (Fig. 5B3). These imaging results suggest that flies will be equally likely to generalize between any of the odors from this trio and therefore will display no clear generalization behavior between any pair of odors.
Behaviorally, when flies were shocked to HP and given the choice between PA and BA, their odor choices did not differ significantly from preexposed controls (p = 0.055, Fig. 5C3, left). Flies shocked to PA showed weak but significant generalization to HP (p = 0.046; Fig. 5C3, left). Finally, flies shocked to BA and given the choice between PA and HP did not display any significant generalization behavior (p = 0.29; Fig. 6). All statistics are paired t tests. Therefore, for this odor trio, in which imaging predicts that no generalization will take place, we see one instance of weak generalization and two instances of no significant generalization. In all three cases, the effect magnitude is small.
The results of the four generalization experiments are displayed in Figure 6, which summarizes behavioral performance in all discrimination and generalization experiments performed. In each subpanel, the circular symbols indicate the odor to which the flies were shocked and tested. Symbols with two unique colors indicate discrimination (denoted below the x-axis as “D”). Symbols with three unique colors indicate generalization (denoted as “G”). This figure highlights two striking aspects of the relationship between odor-driven behavior and KC ensemble odor responses. First, flies discriminated all pure odor pairs, even those that evoke very few KC responses that are unique to one of two odors (Fig. 4A,B,G). Second, flies consistently generalized to novel odors in the way we predicted based on neural activity in the MB.
In summary, we have shown that the perceptual relationship between odors may be mapped onto the activity of the MB and that flies apparently rely on this ensemble information when making decisions about learned odor associations.
Discussion
We investigated the relationship between neural response patterns in the MB and the specificity of behavioral responses in two different learning-based tasks: odor discrimination and odor generalization. Most previous studies of the Drosophila olfactory circuit that related neuronal activity to behavior focused on innate responses to odor (Kreher et al., 2008; Semmelhack and Wang, 2009). These studies accurately predicted both attractive and aversive innate responses to odor using activity patterns in early olfactory layers, but did not address the principles of neural coding that underlie learned olfactory behaviors, which are supported by deeper areas in the olfactory pathway.
Learned olfactory behaviors must be odor specific to be useful, and labeled line coding likely does not have the capacity required to support many different specific memories. Neurons in the MB exhibit highly odor-specific responses and odor representations are carried by a sparsely distributed KC population code. Theoretical studies suggest that sparseness is useful for accurate learning because it minimizes the overlap between response patterns evoked by different stimuli (Kanerva, 1988; Fiete et al., 2004). The more overlapping two representations are in naive animals, the more difficult it might be for subsequent synaptic changes to be specific to one stimulus during learning. Imaging enabled us to directly visualize the overlap between different odor representations, because we were able to track the activity of >100 KCs simultaneously. We used both discrimination and generalization tasks to investigate how population-level activity patterns relate to the animal's perception of odor identity. Overall, we found that flies' performance in both types of tasks was well described by the degree to which odor-evoked activity patterns overlapped in the MB. These results show that the MB conveys odor identity in a behaviorally meaningful way.
Discrimination of similar stimuli
To examine neural coding under conditions in which stimulus discrimination is difficult behaviorally, we used a series of smoothly morphing odor blends. We then evaluated the underlying MB response patterns in these increasingly difficult discrimination conditions. We found a strong correspondence between behavioral discrimination and our readout of MB activity across this range of conditions. There were two factors that contributed to the difficulty of discrimination. First, even though MB representations are sparse, KC patterns become increasingly overlapping and correlated when approaching the discrimination limit. Second, the variability of KC responses is an important limiting factor. This variability is perhaps underappreciated—in neurons such as KCs that fire few spikes, response variability can mean that firing rates dip to zero on some odor presentation trials (Perez-Orive et al., 2002; Turner et al., 2008). It is possible that the variability and low evoked spike count of KCs is an inevitable consequence of their high selectivity. Nevertheless, we found that pooling information across the KC population is sufficient to distinguish between highly similar stimuli.
Although these factors surely limit information transmission in the MB, we note that tracking KC activity using a calcium sensor may underestimate the information content present in the population. Perhaps more information could be extracted by monitoring spikes with multiunit electrophysiological recordings in which greater temporal precision is available. We consider this unlikely, because Drosophila KC spiking responses are generally phasic and carry no obvious information in fine spike timing (Turner et al., 2008); however, the timing of response onset may be a relevant coding variable (Fig. 1B).
Generalization across different stimuli
In our studies of odor discrimination, we first characterized discrimination behaviorally and then examined post hoc whether neural activity matched behavior. To test more stringently our understanding of population coding in the MB, we investigated whether we could use KC activity patterns to predict the flies' olfactory behavior. We used a generalization paradigm in which flies learn to avoid one odor and then test their responses to two different test stimuli. We predicted that flies will avoid the test odor that evokes a response pattern most similar to that of the shocked odor. This situation makes for challenging predictions, because we are testing whether flies apply their past experience with one odor to stimuli they have never previously encountered. We made predictions for a series of odor sets in which generalization became increasingly difficult to predict based on chemical structure alone. In all cases, our predictions about odor similarity based on KC activity matched behavioral outcomes, providing strong evidence that the representation of odor identity in this area is closely related to the flies' behavioral choices.
It is important to note that a similar relationship between neural activity patterns and behavior would be expected in earlier stages of the olfactory pathway. The ORN and PN populations must contain an equal or greater amount of information about odor identity than the MB. For example, a study of trace conditioning in Drosophila (Galili et al., 2011) found evidence for a correspondence between neural activity and generalization at the level of the ORNs. Those investigators compared butanol-evoked activity patterns with patterns elicited by three other odors and found that pattern similarity in ORNs was correlated with the flies' ability to generalize an association they had formed with butanol. A pioneering study in honeybees used proboscis extension as a measure of learning to show that bees generalize across chemically similar compounds (Guerrieri et al., 2005). Compounds treated as similar by the bees tended to be those that evoked similar patterns of glomerular activity measured in an earlier imaging study (Sachse et al., 1999). Similar observations were made using calcium imaging of neuropil in the Drosophila antennal lobe (Niewalda et al., 2011). That study reported a relationship for chemical structure, perceptual distance, and spatial distribution of calcium signals in the antennal lobe, although in this case imaging could not resolve individual glomeruli or neurons. The present study benefits from our ability to track the individual cells that are the units of the neural code. This enabled us to extract sufficient information from the KC population to predict behavioral outcomes from our imaging results.
Decoding information in the MB
Although there are about 2000 KCs in each hemisphere, our results with olfactory discrimination show that only approximately 25 MB neurons are required for producing performance on par with the flies' behavior. It is likely that many of these neurons are of the α′/β′ class, because these are the most responsive KC types (Turner et al., 2008). However, this result does not indicate that only 25 cells are needed for any discrimination task; rather, this number of cells is sufficient for distinguishing between two odors. Classification becomes more difficult when there are multiple possible odor classes. In a natural setting, where animals are confronted with a much wider range of odors, the representational capacity provided by the larger population of MB neurons would be extremely important.
KCs synapse on a small number (Y. Aso, personal communication) of output neurons (Tanaka et al., 2008; Séjourné et al., 2011). Each output neuron likely receives input from many KCs; however, the impact of any particular KC on these downstream neurons would depend on the strength of their synaptic connections, a topic that is currently unexplored. Nevertheless, the extensive dendritic arbor of MB output neurons would almost certainly sample from more than the 25 KCs needed to convey odor identity accurately in our task.
A unified framework for discrimination and generalization
How can the MB support both highly accurate olfactory discrimination and generalization? One appealing framework is that of memory retrieval as template matching. According to this hypothesis, flies that form an association with one particular odor store a corresponding template in the MB. Both generalization and discrimination depend upon the degree to which test odors match this stored template. When flies are trained with one stimulus and tested with other stimuli they have never before encountered, they respond to the stimulus with the representation that most strongly overlaps with the stored template, even if that match is not perfect. This corresponds to stimulus generalization. When confronted with a discrimination task, flies learn to accurately distinguish odors based on the parts of the representation that do not overlap.
Although molecular components involved in synaptic plasticity are required in KCs for proper learning (Skoulakis et al., 1993; Tully et al., 1994; Connolly et al., 1996; Skoulakis and Davis, 1996; Zars et al., 2000; Schwaerzel et al., 2002; Blum et al., 2009), it is not known whether the pattern of responding KC somata is altered by learning. We were able to use MB activity patterns recorded in naive flies to predict generalization behavior in trained flies, which would not have been possible if training greatly modifies the MB representation of a conditioned odor. Therefore, our results predict that either the pattern of activated KCs does not change after learning or that any learning-induced changes in patterns are relatively restricted. What feature of MB activity changes as a result of leaning? There is evidence that associative conditioning modifies KC output, as Ca2+ imaging of KC neuropil suggests that plasticity occurs in the output lobes of the MB, but not the calyx (Yu et al., 2006; Wang et al., 2008; Akalal et al., 2010; Davis, 2011). More directly, learning has been shown to cause changes in the odor responses of MB output neurons (Séjourné et al., 2011). It is possible that only KC axonal output is modified and the association is carried by activity changes in neurons downstream of the MB. Regardless, our results show that knowledge of KC response patterns in naive animals can effectively describe the odor specificity of learned olfactory behavior.
Footnotes
This work was funded by the National Institutes of Health (Grant #R01 DC010403-01A1 to G.C.T.). K.S.H was supported by the Crick-Clay fellowship from the Watson School of Biological Sciences and Predoctoral Training Grant #5T32GM065094 from the National Institute of General Medical Sciences. E.D. was supported by a European Molecular Biology Organization Long-Term Fellowship and a Patterson Trust Fellowship. We thank J. Dubnau, V. Jayaraman, A. Kepecs, A. Zador, Y. Zhong, and members of the Turner laboratory for advice and comments on the manuscript.
The authors declare no competing financial interests.
References
- Abraham NM, Spors H, Carleton A, Margrie TW, Kuner T, Schaefer AT. Maintaining accuracy at the expense of speed: stimulus similarity defines odor discrimination time in mice. Neuron. 2004;44:865–876. doi: 10.1016/j.neuron.2004.11.017. [DOI] [PubMed] [Google Scholar]
- Akalal DB, Yu D, Davis RL. A late-phase, long-term memory trace forms in the γ neurons of Drosophila mushroom bodies after olfactory classical conditioning. J Neurosci. 2010;30:16699–16708. doi: 10.1523/JNEUROSCI.1882-10.2010. [DOI] [PMC free article] [PubMed] [Google Scholar]
- Akalal DB, Yu D, Davis RL. The long-term memory trace formed in the Drosophila α/β mushroom body neurons is abolished in long-term memory mutants. J Neurosci. 2011;31:5643–5647. doi: 10.1523/JNEUROSCI.3190-10.2011. [DOI] [PMC free article] [PubMed] [Google Scholar]
- Aso Y, Grübel K, Busch S, Friedrich AB, Siwanowicz I, Tanimoto H. The mushroom body of adult Drosophila characterized by GAL4 drivers. J Neurogenet. 2009;23:156–172. doi: 10.1080/01677060802471718. [DOI] [PubMed] [Google Scholar]
- Bhandawat V, Olsen SR, Gouwens NW, Schlief ML, Wilson RI. Sensory processing in the Drosophila antennal lobe increases reliability and separability of ensemble odor representations. Nat Neurosci. 2007;10:1474–1482. doi: 10.1038/nn1976. [DOI] [PMC free article] [PubMed] [Google Scholar]
- Blum AL, Li W, Cressy M, Dubnau J. Short- and long-term memory in Drosophila require cAMP signaling in distinct neuron types. Curr Biol. 2009;19:1341–1350. doi: 10.1016/j.cub.2009.07.016. [DOI] [PMC free article] [PubMed] [Google Scholar]
- Briggman KL, Abarbanel HD, Kristan WB., Jr Optical imaging of neuronal populations during decision-making. Science. 2005;307:896–901. doi: 10.1126/science.1103736. [DOI] [PubMed] [Google Scholar]
- Broome BM, Jayaraman V, Laurent G. Encoding and decoding of overlapping odor sequences. Neuron. 2006;51:467–482. doi: 10.1016/j.neuron.2006.07.018. [DOI] [PubMed] [Google Scholar]
- Camhi JM, Levy A. The code for stimulus direction in a cell assembly in the cockroach. J Comp Physiol A. 1989;165:83–97. doi: 10.1007/BF00613802. [DOI] [PubMed] [Google Scholar]
- Campbell RA, King AJ, Nodal FR, Schnupp JW, Carlile S, Doubell TP. Virtual adult ears reveal the roles of acoustical factors and experience in auditory space map development. J Neurosci. 2008;28:11557–11570. doi: 10.1523/JNEUROSCI.0545-08.2008. [DOI] [PMC free article] [PubMed] [Google Scholar]
- Connolly JB, Roberts IJ, Armstrong JD, Kaiser K, Forte M, Tully T, O'Kane CJ. Associative learning disrupted by impaired Gs signaling in Drosophila mushroom bodies. Science. 1996;274:2104–2107. doi: 10.1126/science.274.5295.2104. [DOI] [PubMed] [Google Scholar]
- Cury KM, Uchida N. Robust odor coding via inhalation-coupled transient activity in the mammalian olfactory bulb. Neuron. 2010;68:570–585. doi: 10.1016/j.neuron.2010.09.040. [DOI] [PubMed] [Google Scholar]
- Datta SR, Vasconcelos ML, Ruta V, Luo S, Wong A, Demir E, Flores J, Balonze K, Dickson BJ, Axel R. The Drosophila pheromone cVA activates a sexually dimorphic neural circuit. Nature. 2008;452:473–477. doi: 10.1038/nature06808. [DOI] [PubMed] [Google Scholar]
- Davis RL. Traces of Drosophila memory. Neuron. 2011;70:8–19. doi: 10.1016/j.neuron.2011.03.012. [DOI] [PMC free article] [PubMed] [Google Scholar]
- de Belle JS, Heisenberg M. Associative odor learning in Drosophila abolished by chemical ablation of mushroom bodies. Science. 1994;263:692–695. doi: 10.1126/science.8303280. [DOI] [PubMed] [Google Scholar]
- de Bruyne M, Foster K, Carlson JR. Odor coding in the Drosophila antenna. Neuron. 2001;30:537–552. doi: 10.1016/S0896-6273(01)00289-6. [DOI] [PubMed] [Google Scholar]
- Dubnau J, Grady L, Kitamoto T, Tully T. Disruption of neurotransmission in Drosophila mushroom body blocks retrieval but not acquisition of memory. Nature. 2001;411:476–480. doi: 10.1038/35078077. [DOI] [PubMed] [Google Scholar]
- Fernandez PC, Locatelli FF, Person-Rennell N, Deleo G, Smith BH. Associative conditioning tunes transient dynamics of early olfactory processing. J Neurosci. 2009;29:10191–10202. doi: 10.1523/JNEUROSCI.1874-09.2009. [DOI] [PMC free article] [PubMed] [Google Scholar]
- Fiete IR, Hahnloser RH, Fee MS, Seung HS. Temporal sparseness of the premotor drive is important for rapid learning in a neural network model of birdsong. J Neurophysiol. 2004;92:2274–2282. doi: 10.1152/jn.01133.2003. [DOI] [PubMed] [Google Scholar]
- Fisher R. The use of multiple measurements in taxonomic problems. Annals of Eugenics. 1936;7:179–188. doi: 10.1111/j.1469-1809.1936.tb02137.x. [DOI] [Google Scholar]
- Friedrich RW, Laurent G. Dynamic optimization of odor representations by slow temporal patterning of mitral cell activity. Science. 2001;291:889–894. doi: 10.1126/science.291.5505.889. [DOI] [PubMed] [Google Scholar]
- Galili DS, Lüdke A, Galizia CG, Szyszka P, Tanimoto H. Olfactory trace conditioning in Drosophila. J Neurosci. 2011;31:7240–7248. doi: 10.1523/JNEUROSCI.6667-10.2011. [DOI] [PMC free article] [PubMed] [Google Scholar]
- Georgopoulos AP, Schwartz AB, Kettner RE. Neuronal population coding of movement direction. Science. 1986;233:1416–1419. doi: 10.1126/science.3749885. [DOI] [PubMed] [Google Scholar]
- Gochin PM, Colombo M, Dorfman GA, Gerstein GL, Gross CG. Neural ensemble coding in inferior temporal cortex. J Neurophysiol. 1994;71:2325–2337. doi: 10.1152/jn.1994.71.6.2325. [DOI] [PubMed] [Google Scholar]
- Guerrieri F, Schubert M, Sandoz JC, Giurfa M. Perceptual and neural olfactory similarity in honeybees. PLoS Biol. 2005;3:e60. doi: 10.1371/journal.pbio.0030060. [DOI] [PMC free article] [PubMed] [Google Scholar]
- Guizar-Sicairos M, Thurman ST, Fienup JR. Efficient subpixel image registration algorithms. Opt Lett. 2008;33:156–158. doi: 10.1364/OL.33.000156. [DOI] [PubMed] [Google Scholar]
- Hallem EA, Carlson JR. Coding of odors by a receptor repertoire. Cell. 2006;125:143–160. doi: 10.1016/j.cell.2006.01.050. [DOI] [PubMed] [Google Scholar]
- Hamel LH. Knowledge Discovery With Support Vector Machines. Wiley-Interscience. 2009 [Google Scholar]
- Honegger KS, Campbell RA, Turner GC. Cellular-resolution population imaging reveals robust sparse coding in the Drosophila mushroom body. J Neurosci. 2011;31:11772–11785. doi: 10.1523/JNEUROSCI.1099-11.2011. [DOI] [PMC free article] [PubMed] [Google Scholar]
- Hung CP, Kreiman G, Poggio T, DiCarlo JJ. Fast readout of object identity from macaque inferior temporal cortex. Science. 2005;310:863–866. doi: 10.1126/science.1117593. [DOI] [PubMed] [Google Scholar]
- Ito I, Ong RC, Raman B, Stopfer M. Sparse odor representation and olfactory learning. Nat Neurosci. 2008;11:1177–1184. doi: 10.1038/nn.2192. [DOI] [PMC free article] [PubMed] [Google Scholar]
- Ito K, Suzuki K, Estes P, Ramaswami M, Yamamoto D, Strausfeld NJ. The organization of extrinsic neurons and their implications in the functional roles of the mushroom bodies in Drosophila melanogaster Meigen. Learn Mem. 1998;5:52–77. doi: 10.1101/lm.5.1.52. [DOI] [PMC free article] [PubMed] [Google Scholar]
- Kanerva P. Sparse distributed memory. Cambridge, MA: MIT; 1988. [Google Scholar]
- Klein S, Staring M, Murphy K, Viergever MA, Pluim JPW. elastix: a tool-box for intensity-based medical image registration. IEEE Trans Med Imaging. 2010;29:196–205. doi: 10.1109/TMI.2009.2035616. [DOI] [PubMed] [Google Scholar]
- Koulakov AA, Rinberg D. Sparse incomplete representations: a potential role of olfactory granule cells. Neuron. 2011;72:124–136. doi: 10.1016/j.neuron.2011.07.031. [DOI] [PMC free article] [PubMed] [Google Scholar]
- Kreher SA, Mathew D, Kim J, Carlson JR. Translation of sensory input into behavioral output via an olfactory system. Neuron. 2008;59:110–124. doi: 10.1016/j.neuron.2008.06.010. [DOI] [PMC free article] [PubMed] [Google Scholar]
- Laurent G. Olfactory network dynamics and the coding of multidimensional signals. Nat Rev Neurosci. 2002;3:884–895. doi: 10.1038/nrn964. [DOI] [PubMed] [Google Scholar]
- Laurent G, Naraghi M. Odorant-induced oscillations in the mushroom bodies of the locust. J Neurosci. 1994;14:2993–3004. doi: 10.1523/JNEUROSCI.14-05-02993.1994. [DOI] [PMC free article] [PubMed] [Google Scholar]
- Lee T, Luo L. Mosaic analysis with a repressible cell marker for studies of gene function in neuronal morphogenesis. Neuron. 1999;22:451–461. doi: 10.1016/S0896-6273(00)80701-1. [DOI] [PubMed] [Google Scholar]
- MacLeod K, Bäcker A, Laurent G. Who reads temporal information contained across synchronized and oscillatory spike trains? Nature. 1998;395:693–698. doi: 10.1038/27201. [DOI] [PubMed] [Google Scholar]
- Martinez-Conde S, Macknik SL, Hubel DH. The function of bursts of spikes during visual fixation in the awake primate lateral geniculate nucleus and primary visual cortex. Proc Natl Acad Sci U S A. 2002;99:13920–13925. doi: 10.1073/pnas.212500599. [DOI] [PMC free article] [PubMed] [Google Scholar]
- Masek P, Heisenberg M. Distinct memories of odor intensity and quality in Drosophila. Proc Natl Acad Sci U S A. 2008;105:15985–15990. doi: 10.1073/pnas.0804086105. [DOI] [PMC free article] [PubMed] [Google Scholar]
- McGuire SE, Le PT, Davis RL. The role of Drosophila mushroom body signaling in olfactory memory. Science. 2001;293:1330–1333. doi: 10.1126/science.1062622. [DOI] [PubMed] [Google Scholar]
- Miura K, Mainen ZF, Uchida N. Odor representations in olfactory cortex: distributed rate coding and decorrelated population activity. Neuron. 2012;74:1087–1098. doi: 10.1016/j.neuron.2012.04.021. [DOI] [PMC free article] [PubMed] [Google Scholar]
- Murthy M, Turner GC. In vivo whole-cell recordings in the Drosophila brain. In: Zhang B, Waddell S, Freeman M, editors. Drosophila neurobiology methods: a laboratory manual. Cold Spring Harbor, NY: Cold Spring Harbor Laboratory; 2010. [Google Scholar]
- Nelken I, Chechik G, Mrsic-Flogel TD, King AJ, Schnupp JW. Encoding stimulus information by spike numbers and mean response time in primary auditory cortex. J Comput Neurosci. 2005;19:199–221. doi: 10.1007/s10827-005-1739-3. [DOI] [PubMed] [Google Scholar]
- Niewalda T, Völler T, Eschbach C, Ehmer J, Chou WC, Timme M, Fiala A, Gerber B. A combined perceptual, physico-chemical, and imaging approach to “odour-distances” suggests a categorizing function of the Drosophila antennal lobe. PLoS ONE. 2011;6:e24300. doi: 10.1371/journal.pone.0024300. [DOI] [PMC free article] [PubMed] [Google Scholar]
- Parker AJ, Newsome WT. Sense and the single neuron: probing the physiology of perception. Annu Rev Neurosci. 1998;21:227–277. doi: 10.1146/annurev.neuro.21.1.227. [DOI] [PubMed] [Google Scholar]
- Perez-Orive J, Mazor O, Turner GC, Cassenaer S, Wilson RI, Laurent G. Oscillations and sparsening of odor representations in the mushroom body. Science. 2002;297:359–365. doi: 10.1126/science.1070502. [DOI] [PubMed] [Google Scholar]
- Perez-Orive J, Bazhenov M, Laurent G. Intrinsic and circuit properties favor coincidence detection for decoding oscillatory input. J Neurosci. 2004;24:6037–6047. doi: 10.1523/JNEUROSCI.1084-04.2004. [DOI] [PMC free article] [PubMed] [Google Scholar]
- Préat T. Decreased odor avoidance after electric shock in Drosophila mutants biases learning and memory tests. J Neurosci. 1998;18:8534–8538. doi: 10.1523/JNEUROSCI.18-20-08534.1998. [DOI] [PMC free article] [PubMed] [Google Scholar]
- Rieke F, Warland D, de Ruyter van Steveninck R, Bialek W. Spikes: exploring the neural code. Cambridge, MA: MIT; 1999. [Google Scholar]
- Root CM, Masuyama K, Green DS, Enell LE, Nässel DR, Lee CH, Wang JW. A presynaptic gain control mechanism fine-tunes olfactory behavior. Neuron. 2008;59:311–321. doi: 10.1016/j.neuron.2008.07.003. [DOI] [PMC free article] [PubMed] [Google Scholar]
- Ruta V, Datta SR, Vasconcelos ML, Freeland J, Looger LL, Axel R. A dimorphic pheromone circuit in Drosophila from sensory input to descending output. Nature. 2010;468:686–690. doi: 10.1038/nature09554. [DOI] [PubMed] [Google Scholar]
- Sachse S, Rappert A, Galizia CG. The spatial representation of chemical structures in the antennal lobe of honeybees: steps towards the olfactory code. Eur J Neurosci. 1999;11:3970–3982. doi: 10.1046/j.1460-9568.1999.00826.x. [DOI] [PubMed] [Google Scholar]
- Sachse S, Rueckert E, Keller A, Okada R, Tanaka NK, Ito K, Vosshall LB. Activity-dependent plasticity in an olfactory circuit. Neuron. 2007;56:838–850. doi: 10.1016/j.neuron.2007.10.035. [DOI] [PubMed] [Google Scholar]
- Schwaerzel M, Heisenberg M, Zars T. Extinction antagonizes olfactory memory at the subcellular level. Neuron. 2002;35:951–960. doi: 10.1016/S0896-6273(02)00832-2. [DOI] [PubMed] [Google Scholar]
- Séjourné J, Plaçais PY, Aso Y, Siwanowicz I, Trannoy S, Thoma V, Tedjakumala SR, Rubin GM, Tchénio P, Ito K, Isabel G, Tanimoto H, Préat T. Mushroom body efferent neurons responsible for aversive olfactory memory retrieval in Drosophila. Nat Neurosci. 2011;14:903–910. doi: 10.1038/nn.2846. [DOI] [PubMed] [Google Scholar]
- Semmelhack JL, Wang JW. Select Drosophila glomeruli mediate innate olfactory attraction and aversion. Nature. 2009;459:218–223. doi: 10.1038/nature07983. [DOI] [PMC free article] [PubMed] [Google Scholar]
- Shadlen MN, Newsome WT. The variable discharge of cortical neurons: implications for connectivity, computation, and information coding. J Neurosci. 1998;18:3870–3896. doi: 10.1523/JNEUROSCI.18-10-03870.1998. [DOI] [PMC free article] [PubMed] [Google Scholar]
- Silbering AF, Okada R, Ito K, Galizia CG. Olfactory information processing in the Drosophila antennal lobe: anything goes? J Neurosci. 2008;28:13075–13087. doi: 10.1523/JNEUROSCI.2973-08.2008. [DOI] [PMC free article] [PubMed] [Google Scholar]
- Skoulakis EM, Davis RL. Olfactory learning deficits in mutants for leonardo, a Drosophila gene encoding a 14–3-3 protein. Neuron. 1996;17:931–944. doi: 10.1016/S0896-6273(00)80224-X. [DOI] [PubMed] [Google Scholar]
- Skoulakis EME, Kalderon DD, Davis RL. Preferential expression in mushroom bodies of the catalytic subunit of protein kinase A and its role in learning and memory. Neuron. 1993;11:197–208. doi: 10.1016/0896-6273(93)90178-T. [DOI] [PubMed] [Google Scholar]
- Sparks DL, Holland R, Guthrie BL. Size and distribution of movement fields in the monkey superior colliculus. Brain Res. 1976;113:21–34. doi: 10.1016/0006-8993(76)90003-2. [DOI] [PubMed] [Google Scholar]
- Stopfer M, Jayaraman V, Laurent G. Intensity versus identity coding in an olfactory system. Neuron. 2003;39:991–1004. doi: 10.1016/j.neuron.2003.08.011. [DOI] [PubMed] [Google Scholar]
- Suh GS, Wong AM, Hergarden AC, Wang JW, Simon AF, Benzer S, Axel R, Anderson DJ. A single population of olfactory sensory neurons mediates an innate avoidance behaviour in Drosophila. Nature. 2004;431:854–859. doi: 10.1038/nature02980. [DOI] [PubMed] [Google Scholar]
- Tanaka NK, Tanimoto H, Ito K. Neuronal assemblies of the Drosophila mushroom body. J Comp Neurol. 2008;508:711–755. doi: 10.1002/cne.21692. [DOI] [PubMed] [Google Scholar]
- Theunissen FE, Miller JP. Representation of sensory information in the cricket cercal sensory system. II. Information theoretic calculation of system accuracy and optimal tuning-curve widths of four primary interneurons. J Neurophysiol. 1991;66:1690–1703. doi: 10.1152/jn.1991.66.5.1690. [DOI] [PubMed] [Google Scholar]
- Thirion JP. Image matching as a diffusion process: an analogy with Maxwell's demons. Med Image Anal. 1998;2:243–260. doi: 10.1016/S1361-8415(98)80022-4. [DOI] [PubMed] [Google Scholar]
- Thum AS, Jenett A, Ito K, Heisenberg M, Tanimoto H. Multiple memory traces for olfactory reward learning in Drosophila. J Neurosci. 2007;27:11132–11138. doi: 10.1523/JNEUROSCI.2712-07.2007. [DOI] [PMC free article] [PubMed] [Google Scholar]
- Tian L, Hires SA, Mao T, Huber D, Chiappe ME, Chalasani SH, Petreanu L, Akerboom J, McKinney SA, Schreiter ER, Bargmann CI, Jayaraman V, Svoboda K, Looger LL. Imaging neural activity in worms, flies and mice with improved GCaMP calcium indicators. Nat Methods. 2009;6:875–881. doi: 10.1038/nmeth.1398. [DOI] [PMC free article] [PubMed] [Google Scholar]
- Tomko GJ, Crapper DR. Neuronal variability: non-stationary responses to identical visual stimuli. Brain Res. 1974;79:405–418. doi: 10.1016/0006-8993(74)90438-7. [DOI] [PubMed] [Google Scholar]
- Tully T, Quinn WG. Classical conditioning and retention in normal and mutant Drosophila melanogaster. J Comp Physiol A. 1985;157:263–277. doi: 10.1007/BF01350033. [DOI] [PubMed] [Google Scholar]
- Tully T, Préat T, Boynton SC, Del Vecchio M. Genetic dissection of consolidated memory in Drosophila. Cell. 1994;79:35–47. doi: 10.1016/0092-8674(94)90398-0. [DOI] [PubMed] [Google Scholar]
- Turner GC, Bazhenov M, Laurent G. Olfactory representations by Drosophila mushroom body neurons. J Neurophysiol. 2008;99:734–746. doi: 10.1152/jn.01283.2007. [DOI] [PubMed] [Google Scholar]
- Uchida N, Mainen ZF. Speed and accuracy of olfactory discrimination in the rat. Nat Neurosci. 2003;6:1224–1229. doi: 10.1038/nn1142. [DOI] [PubMed] [Google Scholar]
- Venables WN, Ripley BD. Modern Applied Statistics with S. 4 ed. Springer; 1999. [Google Scholar]
- Vosshall LB, Stocker RF. Molecular architecture of smell and taste in Drosophila. Annu Rev Neurosci. 2007;30:505–533. doi: 10.1146/annurev.neuro.30.051606.094306. [DOI] [PubMed] [Google Scholar]
- Walker KMM, Ahmed B, Schnupp JW. Linking cortical spike pattern codes to auditory perception. J Cogn Neurosci. 2008;20:135–152. doi: 10.1162/jocn.2008.20012. [DOI] [PubMed] [Google Scholar]
- Wang Y, Guo HF, Pologruto TA, Hannan F, Hakker I, Svoboda K, Zhong Y. Stereotyped odor-evoked activity in the mushroom body of Drosophila revealed by green fluorescent protein-based Ca2+ imaging. J Neurosci. 2004;24:6507–6514. doi: 10.1523/JNEUROSCI.3727-03.2004. [DOI] [PMC free article] [PubMed] [Google Scholar]
- Wang Y, Mamiya A, Chiang AS, Zhong Y. Imaging of an early memory trace in the Drosophila mushroom body. J Neurosci. 2008;28:4368–4376. doi: 10.1523/JNEUROSCI.2958-07.2008. [DOI] [PMC free article] [PubMed] [Google Scholar]
- Werner G, Mountcastle VB. Neural activity in mechanoreceptive cutaneous afferents: stimulus-response relations, weber functions, and information transmission. J Neurophysiol. 1965;28:359–397. doi: 10.1152/jn.1965.28.2.359. [DOI] [PubMed] [Google Scholar]
- Wilson RI, Turner GC, Laurent G. Transformation of olfactory representations in the Drosophila antennal lobe. Science. 2004;303:366–370. doi: 10.1126/science.1090782. [DOI] [PubMed] [Google Scholar]
- Yu D, Keene AC, Srivatsan A, Waddell S, Davis RL. Drosophila DPM neurons form a delayed and branch-specific memory trace after olfactory classical conditioning. Cell. 2005;123:945–957. doi: 10.1016/j.cell.2005.09.037. [DOI] [PubMed] [Google Scholar]
- Yu D, Akalal DB, Davis RL. Drosophila α/β mushroom body neurons form a branch-specific, long-term cellular memory trace after spaced olfactory conditioning. Neuron. 2006;52:845–855. doi: 10.1016/j.neuron.2006.10.030. [DOI] [PMC free article] [PubMed] [Google Scholar]
- Zars T, Fischer M, Schulz R, Heisenberg M. Localization of a short-term memory in Drosophila. Science. 2000;288:672–675. doi: 10.1126/science.288.5466.672. [DOI] [PubMed] [Google Scholar]