Abstract
Physiologic regulation of extracellular matrix (ECM) in articular cartilage tissue is controlled by cellular and molecular mechanisms which are not fully understood. It has been observed that the synthesis of the ECM structural molecules, glycosaminoglycan and collagen are promoted by growth factors such as IGF-1 and TGF-β. Concomitant ECM degradation is promoted by a variety of cytokines such as IL-1. The clinical need for reparative therapies of articular cartilage is linked with its poor intrinsic healing capacity. The following modelling approach was applied to engineered cartilage as a platform for exploring cartilage biology and to introduce a predictive tool as a bioinformatic support system supporting regenerative therapies. Systems biology was adapted through a mathematical framework producing a computational intelligence paradigm to explore a controlled phasic regulatory influence of the inhibition and production of ECM biomolecules. Model outcomes describe a steady synthesis of ECM as a dependence on a cyclic influence of the catabolic action of proteases and anabolic action of growth factors. This relationship is shown quantitatively in a governing harmonic equation representing the simplified biological mechanisms of biomolecule homeostasis.
Keywords: articular cartilage, chondrocytes, extracellular matrix, ECM, growth factors, cytokines
1 Introduction
Mature articular cartilage contains approximately 5% of its volume as cells (chondrocytes), and 95% as extracellular matrix (ECM). Out of this 95%, 70% is water. Within the ECM itself, 60% is collagen, 25% is proteoglycans (PG) and 15% is a wide range of matrix proteins. The role of sparsely distributed chondrocytes is to maintain the biologic integrity of the entire tissue. The collagen network provides a mechanical framework for cartilage and is considered a structural molecule; PG is a central protein core to which sulfated glycosaminoglycans (GAG) composed of chondroitin sulfate, dermatan sulfate and keratan sulfate, are covalently attached. Articular cartilage also contains aggregating PG. The third type of biomolecules in ECM includes a wide range of proteins such as different types of growth factors, fibronectin and laminin (Roughley and Lee, 1994). The roles and responsibilities of different molecules within the articular cartilage are often postulated (Table 1).
Table 1. The roles and responsibilities of the primary biomolecules within articular cartilage.
| Chondrocytes and extracellular matrix | ||
|---|---|---|
|
| ||
| Collagen Structural protein | Proteoglycans Core protein | Growth factors Other proteins |
| Overall mechanical integrity | Swelling tendency | Regulate cellular behaviour |
| Stiffness influence | Compression resistance | |
| Tensile resistance | Lubrication | |
| Shear resistance | ||
The physiologic regulation of the cartilage biomolecules is maintained by chondrocytes even though low in number and sparsely distributed (Caplan, 1984; Roughley and Lee, 1994; Buckwalter and Mankin, 1997). One of the fundamental doctrines of cellular biology addresses cell-cell and cell-ECM interactions and the subsequent communication. At issue are the mechanisms by which distributed chondrocytes communicate with the different biomolecules as well as with other chondrocytes. There are many types of identifiable signalling molecules which are actively involved in this communication. Some of those are used for short distance communication, some for long distance communications and some for specific targets (Cooper and Hausman, 2009). Chondrocytes are responsible for the slow ECM turnover while detecting and responding to extracellular signalling molecules, such as growth factors and cytokines.
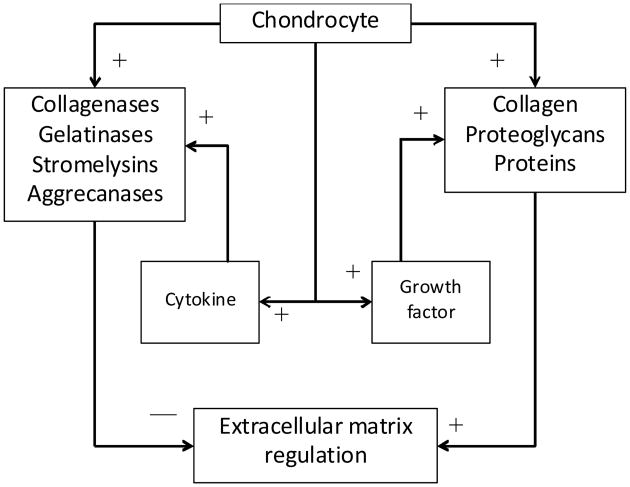
In normal and pathological conditions, articular cartilage matrix homeostasis is dependent upon the autocrine and paracrine, anabolic and catabolic pathways controlled by the chondrocytes (Chambers et al., 1997, Moos et al., 1999). The cells produce the structural macromolecules in tissue formation, such as collagen and PG, but also a variety of metalloproteinases, such as collagenase, gelatinase, stromelysin, and aggrecanase which are responsible for tissue turnover (Figure 1). During healthy balanced regulation, growth factors such as transforming growth factor-β (TGF-β), insulin-like growth factor-1 (IGF-1), and osteogenic protein-1 (OP-1) stimulate the chondrocytes to synthesis the structural macromolecules, while cytokines interleukin-1 (IL-1), interleukin-6 (IL-6) and tumour necrosis factor-α (TNF-α), stimulate chondrocyte secretion of proteinases causing ECM degradation.
Figure 1. Simplified interaction between the critical influencing elements associated with ECM synthesis (+ influence) and degradation (− influence).
Note: The modelling approach here characterises the dynamic influence of growth factors and cytokines through a direct mathematical link with chondrocyte behaviour.
Damage to the articular surface can occur during static or dynamic load applications of normal and shear forces (Mow and Ratcliffe, 1997). It has a very limited capacity to self-repair, therefore, any critically-sized defects to the articular surface can lead to tissue thinning and eburnation resulting in increased joint pain and loss of joint movement. It can also lead to osteoarthritis (OA), a slow degeneration of the cartilage matrix. OA is the most common form of arthritis in the world affecting about 10% of the total population (http://www.arthritis.org).
In the early stage of arthritic destruction of cartilage, PG are degraded, whereas, in later stages the collagen framework is compromised. Aggrecanases (ADAMTS4 and ADAMTS5) are responsible for degrading the core protein of the proteoglycan aggrecan, resulting in its diffusion from the cartilage matrix (Stanton et al., 2005; Glasson et al., 2005). Collagenases such as matrix metalloproteinases (MMP-1 and MMP-13) are responsible for the destruction of the ECM's collagen triple helix. In the case of degenerative OA, these enzymes are released directly from chondrocytes, due to some negative influence on the cells. In the case of rheumatoid arthritis (RA), a T-cell mediated autoimmune response may be the possible reason for the synthesis of cartilage degradation enzymes. In infectious arthritis, bacterial collagenases give rise to very rapid cartilage destruction (Murphy et al., 2002; d'Ortho et al., 1997; Ohuchi et al., 1997; Vincenti and Brinckerhoff, 2001; Davidson et al., 2006).
It is now clear that growth, maintenance, and degradation of the cartilage matrix are dependent on a balance between anabolic and catabolic activities. In the case of cartilage matrix growth and repair, anabolic processes exceed the catabolic activities. On the other hand, catabolic processes exceed anabolic activities when disease and degeneration occur. These relationships have been observed in controlled osteoarthritic culture models where experimental results show that the combination of anabolic growth factors and protective catabolic blockers may be a means for partial restoration of the cartilage matrix (Haupt et al., 2005). Others have observed that excessive release of basic fibroblast growth factor (bFGF) from the cartilage matrix during injury, with loading, or OA could contribute to increased proliferation and reduced anabolic activities in articular cartilage (Loeser et al., 2005; Im et al., 2007).
Recently gene therapy has been explored as a possible therapeutic approach for OA. The process involves the transfer of genes to cells, resulting in extended ligand production. Transducing synovial tissue in vitro with adenoviral IGF-1 produces extended IGF-1 ligand production and up-regulation of connective tissue matrix molecules. Anti-catabolic agents, such as the IL-1 receptor antagonist protein (IL-1Ra), prevent the action of cytokines and subsequent elaboration of matrix metalloproteinases. IL-1Ra binds to IL-1 receptor and that blocks the binding of IL-1 to receptor cells (target cells), stoping the subsequent activities of IL-1. It was also noticed during the early stages of OA that the chondrocytes responded with a transient induction of matrix synthesis through the increases in the expression and/or protein secretion of IGF-1 and bone morphogenetic protein-7 (BMP-7). This de novo ECM synthesis could not overcome the concurrent catabolic process that involved the excess production of matrix degrading enzymes, including MMPs, aggrecanases, and other proteinases by chondrocytes (Middleton and Tyler, 1992; Keyszer et al., 1995).
Results from our previous predictions of articular cartilage matrix synthesis were based on a systems biology approach and clearly indicate that anabolic actions of different growth factors are essentially dose and time dependent (Saha et al., 2004, 2005). From reported experimental data, regulatory mechanisms are obviously in place involving both anabolic and catabolic processes which maintain matrix homeostasis. The objective of this study is to characterise this complex dynamic process from a systems point of view by developing mathematical models producing a computational intelligence paradigm that may explain the combined feedback effects of anabolic and catabolic actions. An engineered tissue platform is presented as a means to explore cartilage biology and articulate the controlled influence of growth factors and cytokines on engineered cartilage maintenance (Figure 1).
2 Material and methods
2.1 Mathematical modelling approach
Based on previous work, we can justifiably argue that there exists a dynamic relationship between anabolic and catabolic activities which regulates cartilage matrix homeostasis (Saha and Kohles, 2010a, 2010b). As mentioned, the important anabolic proteins are the various growth factors and the important catabolic proteins include cytokines. The following mathematical model is constructed as a simplified relationship between the dynamic action of growth factors and cytokines on a generalised chondrocyte and the resulting ECM molecule abundance.
Let G, C and E represent the relative concentration levels (normalised by steady state saturation and scaled for plotting) of growth factors (scaled down), cytokines (scaled down), and ECM (scaled up), respectively, at any particular time T. Based on the scheme of positive and negative associations, the mathematical model is defined as follows:
| (1) |
where α1, α2 and λ are the kinetic rates associated with increases in cytokine, growth factor, and ECM concentration, and β1, β2 and δ are natural degradation rates characterising decreases in cytokine, growth factor, and ECM concentration, respectively. The parameters Ω1 and Ω2 are the threshold concentrations of cytokine and growth factor, respectively. At any time, t, cytokine production depends upon the difference in concentration between the Ω2 and the level of growth factor, while growth factor production depends upon the difference in concentration between the cytokine level and Ω1. These two model components are identified as pivotal parameters. As the functional activities of cytokines and growth factors are in direct opposition to each other, their kinetics are complementary. The third component of equation (1) describes the synthesis of ECM molecules where growth factors enhance production and cytokines inhibit production through negative feedback.
2.2 Steady state condition: homeostasis
The steady state and/or equilibrium levels of the constituents (Css, Gss, Ess) within the described system can be obtained from the following set of equations:
| (2) |
Hence, the only non-trivial steady state scenario of the system described in equation (1) is:
| (3) |
The main biomolecular components of the ECM considered here are the structural proteins and PG. Structural proteins mainly consist of type II collagen. PG are the core proteins to which are attached long chains of repeating disaccharide units known as GAG. Therefore,
| (4) |
If we assume the synthesis of collagen and GAG molecules are independent, then we can separate the ECM components and re-write the system described by equation (1) as:
| (5) |
The steady state of GAG and collagen components can then be defined as:
| (6) |
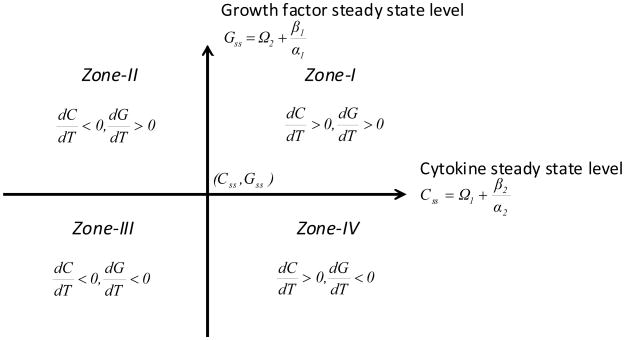
A phase-space diagram of this dynamic system indicates accumulation-dependent zones delineated by an abscissa representing cytokine levels and an ordinate indicating growth factor status, intersecting at a homeostatic origin (Css, Gss) (Figure 2).
Figure 2. GAG and collagen accumulation rate activity zones as defined by cytokine and growth factor levels.
2.3 Bioregulatory simulation
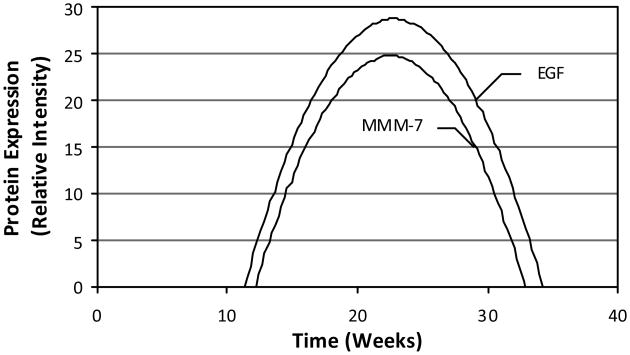
A challenge in this simulation approach is parameter estimation. Due to the limited availability of data describing either engineered or native cartilage kinetics, a mathematical association between growth factor/cytokine abundance and protein synthesis was drawn from data characterising the development of sweat glands in human fetal skin (Li et al., 2002). In this tissue system, the morphogenesis of the sweat glands indicated a close relationship among epidermal growth factor (EGF), matrix metalloproteinase-2 (MMP-2), and matrix metalloproteinase-7 (MMP-7) (Figure 3). Although physiologically unrelated to cartilage, the data represent the synergistic effects of cytokines and growth factors over a timeframe typical for recent engineered cartilage culture scenarios (Kohles et al., 2007), thus enabling this biokinetic characterisation.
Figure 3. Model input relationships between EGF (representative growth factor), MMP-7 (representative cytokine), and culture time as measured from relative protein concentrations derived during a skin sweat gland development study.
Source: Li et al. (2002)
The assumed intrinsic ECM kinetic rates associated with growth factor and cytokine influence are equal to one over the characteristic time constant τ as defined in previous mechanistic (Wilson et al., 2002), deterministic, and stochastic (Saha et al., 2004, 2005) models. As such, the cytokine and growth factor rates (subscripts 1 and 2, respectively) are:
| (7) |
The relative concentration intensity of EGF proteins y at different gestational time stages X from 11 week to 31 weeks during sweat gland development can be defined by the relationship (line of best fit with R2 = 0.9638):
| (8) |
The difference between the roots of the solution for this EGF-time relationship was considered as the characteristic time defining an EGF protein rate constant. The two roots are thus x1 = 11.345 weeks and x2 = 34.242 weeks. Hence, τ2 = 22.897 weeks. Now from equation (7):
| (9) |
The steady state value of the modelled growth factor was estimated as the average production of growth factor over the root time interval as defined by τ2. Therefore,
| (10) |
Similarly, the concentration of MMP-7 y at different gestational time stages X from 11 weeks to 31 weeks during sweat gland development was defined by the relationship (again the line of best fit with R2 = 0.8969) and given by:
| (11) |
The characteristic time for the cytokines production τ1 was considered as the difference between the root solutions of this relationship (x1 = 12.189 weeks and x2 = 32.893 weeks, so τ1 = 20.704 weeks). Hence,
| (12) |
The steady state value of the modelled cytokine level was similarly obtained as the average production of MMP-7 over the root time interval τ1. Therefore:
| (13) |
Now, from equation (12) and the steady state value of growth factor Gss defined in equation (10), the following decay rate can be defined:
| (14) |
Provided that the threshold definition is maintained:
| (15) |
which represents the range of possible values for the pivotal parameter Ω2. Once the pivotal parameter value is fixed, the degradation rate of growth factor can be defined:
| (16) |
Similarly, from equation (8) and the steady value of cytokine Css in equation (13), the following is defined:
| (17) |
Again, provided that the threshold definition is maintained:
| (18) |
This in turn leads to:
| (19) |
Values of λ1, λ2 and δ1, δ2 were determined previously through a deterministic approach where kinetic rate ratios of synthesis per decay contribute to steady state levels of ECM accumulation (Saha et al., 2005). The parameter estimations are summarised in Table 2. Based on the selected and calculated parameter values, a numerical solution demonstrating growth factor and cytokine dynamics and ECM synthesis is presented. The research described herein was carried out in accordance with universal ethical principles (Emanuel et al., 2000).
Table 2. Nomenclature and parametric input values of the presented mathematical model as derived here and extracted from the literature.
| Parameter | Description | Relation or value | |
|---|---|---|---|
| α1 | Synthesis rate (cytokine) | α1 = 0.048 + β1 | |
| α2 | Synthesis rate (growth factor) | α2 = 0.048 + β2 | |
| β1 | Decay rate (cytokine) |
|
|
| β2 | Decay rate (growth factor) |
|
|
| λ1 | Synthesis rate (GAG) | 5.474 × 10⁻³ [a] | |
| λ2 | Synthesis rate (collagen) | 5.400 × 10⁻² [a] | |
| δ1 | Decay rate (GAG) | 1.264 × 10⁻⁴ [a] | |
| δ2 | Decay rate (collagen) | 1.108 × 10⁻³ [a] | |
| Ω1 | Threshold value (growth factor) | C0 − 1 < Ω1 < C0 | |
| Ω2 | Threshold value (cytokine) | G0 < Ω2 < G0 + 1 | |
| τ1 | Characteristic time (cytokine) | 20.704 weeks [b] | |
| τ2 | Characteristic time (growth factor) | 22.897 weeks [b] |
Note: Concentration values are in relative units (normalised by steady state saturation and scaled for plotting) and kinetic rates (synthesis or decay) are per time (in weeks).
Source:
From Saha et al. (2005), as derived from Wilson et al. (2002);
From Li et al. (2002)
3 Results
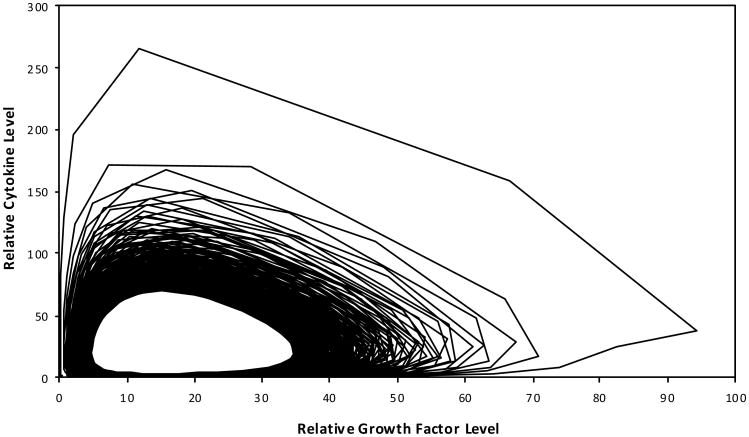
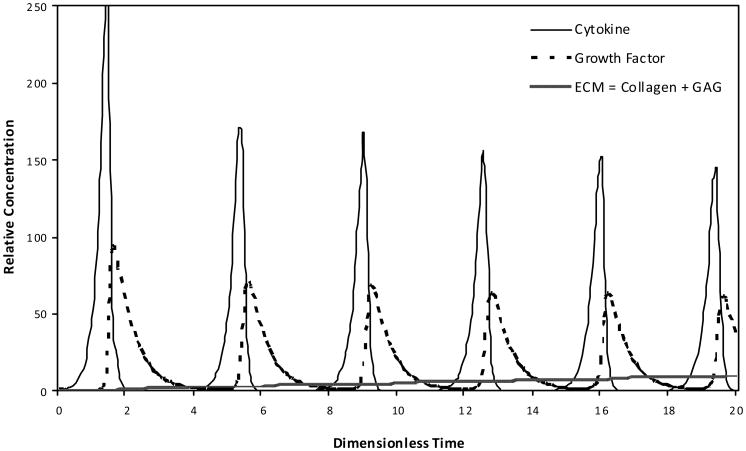
The cyclic relationship of the modelled growth factor and cytokine interaction was characterised in a hypothetical engineered cartilage culture design as a platform for exploring cartilage biology (Figure 4). The phase-limited scenario progresses toward a steady state condition. The absolute production of the total ECM based on the modelled collagen and GAG molecule accumulation was also defined over time as influenced by the anabolic and catabolic contributions of growth factor and cytokine, respectively (Figure 5).
Figure 4. The cyclic phase-limit relationship solution for the steady state dynamics of the modelled growth factor and cytokine.
Note: As development time progresses to 1,000 dimensionless time units, the relative relationship loops clockwise as well as from the outward toward the central steady state condition.
Figure 5. Absolute production of the total ECM based on the modelled collagen and GAG molecule accumulation as influenced by the cyclic, phase-shifted anabolic and catabolic contributions of growth factor and cytokine, respectively.
Note: The influence and production are shown during early (A) and late (B) dimensionless time periods, where the distinct amounts of collagen and GAG are indicated during the later time.
The periodic phase-shifted anabolic and catabolic content decreases in magnitude based on the progressive accumulation of ECM. This scenario reflects the mathematical feedback loops between:
growth factors and cytokines
growth factors/cytokines and ECM.
The relative nature of these levels of abundance (e.g., GAG content is an order of magnitude less than collagen) is purely dependent on the various sources of the input parameters (Table 2). However, the mathematical framework is now in place to explore other types of iterative engineered or native cartilage dynamics via input parameter selection producing a computational intelligence platform.
4 Discussion
It is clear that matrix homeostasis is dependent upon the balance between anabolic and catabolic action of growth factors and cytokines. It has been observed that aberrant expression of cytokines and growth factors were linked to the destruction of cartilage tissue (Van den Berg, 1999). IL-1 has a prominent oppressive effect on chondrocyte proteoglycan synthesis, including stimulating chondryocytes to release destructive proteases, which then arbitrate cartilage breakdown. Hence, the net effect of IL-1 on articular cartilage results in a fast depletion of matrix PG eventually affecting collagen.
TNFα, leukemia inhibitory factor (LIF) and IL-17 have similar properties. A second group of cytokines, IL-4, IL-10 and IL-13, can inhibit the production of destructive cytokines. A third group of cytokines, known as IL-6, has been shown to inhibit the cytokine-driven breakdown of cartilage in vitro (Van den Berg, 1999). IGF-1 is the main anabolic growth factor in articular cartilage. A range of other growth factors, such as, TGF-β, fibroblast growth factor (FGF) and platelet derived growth factor (PDGF) can also stimulate anabolic activity in articular cartilage.
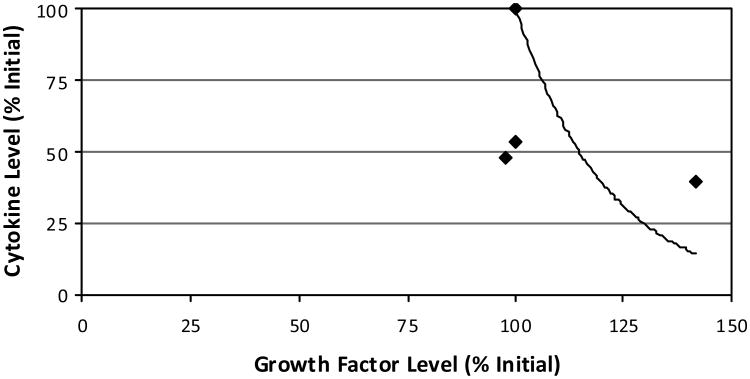
Others have reported that growth factors modulate cellular behaviour through ECM remodelling, and that ECM remodelling leads to the release of growth factors which may change the cellular phenotype, as demonstrated in fetal mouse submandibular glands (Kashimata et al., 2000). It was also reported that MMPs can affect cellular function through influencing the capacity of growth factors while not directly interfering with the interaction between the cells and the ECM (Li et al., 2002). It was concluded there that the development and maturation of sweat glands could be regulated by the combined synergistic effects of cytokines, ECM and growth factors. Additionally, an experiment on the drained wound fluid from ten female patients undergoing hernia repair evaluated the production of several cytokines and growth factors postoperatively (Di Vita et al., 2006). Wound fluid was collected on four consecutive postoperative days from which multiple growth factor and cytokine levels were evaluated. A similar inverse relationship was evident when plotted for comparison with this study (Figure 6). This mathematical relationship may provide further evidence toward the explored feedback mechanism. Although the roles or influence of the different cytokines and growth factors were not identified, it can be speculated that secretion of growth factors and cytokines in a postoperative scenario maintains a synergistic relationship between anabolic and catabolic activities during healing. Ongoing validation of this approach has indicated a similarity in the transient response of the biomolecules over time as described by others (Nikolaev et al., 2009).
Figure 6. For comparison with this study, the relative influence of cytokine and growth hormone levels as measured during a recent human hernia healing study are shown.
Notes: Values represent daily means (four days total) of each of the seven cytokine and two growth factor types measured. As culture time passes, an inverse relationship is described moving from the upper left data (100% of the initial levels) to the lower right data. By fixing the trendline to the initial-state data points, the fitted curve can be defined relating cytokines (y) to growth factors (x) as y = 10826e−0.0468x.
Source: Di Vitta et al. (2006)
With regards to the phase-space hypothetical kinetic relationships, it has been observed in fibrillated human osteoarthritic cartilage that the IGF-1 gene level increased in proportion to the severity of the lesion (Middleton and Tyler, 1992). This is a strong indication that the increased synthesis of IGF-1 is an attempt to bring the system in homeostasis by enhancing the anabolic activity over competing catabolic processes. This particular aspect could be considered as the scenario characterised in Zone-I (Figure 2). Additional experimental work was focused on the anabolic activity through suppression of the catabolic process (Haupt et al., 2005). That study involved gene induced synoviocyte expression of a combination of insulin-like growth factor-1 (AdIGF-1) and an interleukin-1 receptor antagonist protein (AdIL-1Ra). In our phase-space distinction, that experimental work can be described by Zone-II. For a Zone-III situation, both anabolic and catabolic activities are decreasing which could indicate that the chondrocytes are apoptotic or incapable of influencing any anabolic or carbolic activities. Zone-IV represents a condition which is opposite to Zone-II in that a catabolic influence dominates an anabolic influence. Overall, in order to create a true homeostasis within a cartilage matrix, a biological regulatory mechanism needs to be identified and manipulated which creates a synergetic relationship between the mathematically defined phase-space mechanisms associated with Zone-II and Zone-IV.
The objective of this paper was to explore a cyclic regulatory nature of anabolic and catabolic activities during tissue growth, maintenance, and degradation. A mathematical framework is established to manipulate inhibition and activation biokinetics through the varying presence of cytokines and growth factors. This bioinformatic foundation provides a modelling methodology with which to incorporate additional regulatory influences such as mechanical loading (Ramage et al., 2009; Saha and Kohles, 2010b). The phenomenologically developed mathematical model offers new insight in this complex network by establishing hypothetical synergistic relationships in the maintenance of ECM homeostasis.
Acknowledgments
Funding for this work was provided by an Exploratory Programme grant (P20 MD003350) from the National Institutes of Health to Central State University establishing the Center for Allaying Health Disparities through Research and Education (CADRE). Modelling results will contribute to ongoing investigations in cell and tissue engineering supported by an Academic Research Enhancement Award (R15 EB007077) from the National Institutes of Health as well as the Collins Medical Trust and PSU Faculty Enhancement Awards. The authors acknowledge the technical assistance of Professor Jagannath N. Mazumdar of Adelaide University, Australia, and Anya P. Adams of Stanford University and Portland State University.
Biographies
Asit K. Saha is currently an Assistant Professor of Mathematics at Central State University, Ohio. He completed his PhD in Knowledge Based Tissue Engineering from the University of South Australia in 2007. His research areas include system dynamics modelling approaches to cell-matrix interactions, human immune systems, stress related disorders in the brain and embryonic pattern formation/morphogenesis. He has over 30 journal publications describing his research in biomathematics and serves on the editorial board for the International Journal of Computers in Healthcare. His research is currently funded by the National Institutes of Health and addresses health disparities.
Sean S. Kohles is a Research Associate Professor at Portland State University and an Adjunct Associate Professor at the Oregon Health & Science University, Oregon. He completed his Doctoral degree in Bioengineering and Bachelors/Masters degrees in Engineering Mechanics all at the University of Wisconsin-Madison. He has published over 180 journal and conference papers in the areas of cell, tissue, joint, biomaterial, implant, and forensic biomechanical engineering and serves on the editorial boards for the Journal of Biomechanics and the Annals of Biomedical Engineering. He has maintained funding for his research from the National Science Foundation, the National Institutes of Health, and private foundations, while training over 1,200 students.
Contributor Information
Asit K. Saha, Email: ASaha@centralstate.edu, Center for Allaying Health Disparities through Research and Education (CADRE), Department of Mathematics and Computer Science, Central State University, Wilberforce, Ohio, 45384, USA.
Sean S. Kohles, Email: kohles@cecs.pdx.edu, Regenerative Bioengineering Laboratory, Department of Mechanical and Materials Engineering, Portland State University, P.O. Box 751, Portland, Oregon, 97207, USA; Department of Surgery, Oregon Health and Science University, Portland, Oregon, 97239, USA.
References
- Buckwalter JA, Mankin HJ. Articular cartilage, tissue design and chondrocytes matrix interactions. Instr Course Lect. 1997;47:477–486. [PubMed] [Google Scholar]
- Caplan AI. Cartilage. Sci Am. 1984;251(4):84–87. 90–94. doi: 10.1038/scientificamerican1084-84. [DOI] [PubMed] [Google Scholar]
- Chambers MG, Bayliss MT, Mason RM. Chondrocyte cytokine and growth factor expression in murine osteoarthritis. Osteoarthritis Cartilage. 1997;5(5):301–308. doi: 10.1016/s1063-4584(97)80034-9. [DOI] [PubMed] [Google Scholar]
- Cooper GM, Hausman RM. The Cell-A Molecular Approach. 5th. ASM Press and Sinauer Associates, Inc.; Sunderland, MA: 2009. [Google Scholar]
- d'Ortho MP, Will H, Atkinson S, Butler G, Messent A, Gavrilovic J, Smith B, Timpl R, Zardi L, Murphy G. Membrane-type matrix metalloproteinases 1 and 2 exhibit broad-spectrum proteolytic capacities comparable to many matrix metalloproteinases. Eur J Biochem. 1997;250(3):751–757. doi: 10.1111/j.1432-1033.1997.00751.x. [DOI] [PubMed] [Google Scholar]
- Davidson RK, Waters JG, Kevorkian L, Darrah C, Cooper A, Donell ST, Clark IM. Expression profiling of metalloproteinases and their inhibitors in synovium and cartilage. Arth Res Ther. 2006;8(4):R124. doi: 10.1186/ar2013. [DOI] [PMC free article] [PubMed] [Google Scholar]
- Di Vita G, Patti R, D'Agostino P, Caruso G, Arcara M, Buscemi S, Bonventre S, Ferlazzo V, Arcoleo F, Cillari E. Cytokines and growth factors in wound drainage fluid from patients undergoing incisional repair. Wound Repair Regen. 2006;14(3):259–264. doi: 10.1111/j.1743-6109.2006.00120.x. [DOI] [PubMed] [Google Scholar]
- Emanuel EJ, Wendler D, Grady C. What makes clinical research ethical? J Am Med Assoc. 2000;283(20):2701–2711. doi: 10.1001/jama.283.20.2701. [DOI] [PubMed] [Google Scholar]
- Glasson SS, Askew R, Sheppard B, Carito B, Blanchet T, Ma HL, Flannery CR, Peluso D, Kanki K, Yang Z, Majumdar MK, Morr EA. Deletion of active ADAMTS5 prevents cartilage degradation in a murine model of osteoarthritis. Nature. 2005;434(7033):644–648. doi: 10.1038/nature03369. [DOI] [PubMed] [Google Scholar]
- Haupt JL, Frisbie DD, McIlwraith CW, Robbins PD, Ghivizzini S, Evans CH, Nixon AJ. Dual transduction of insulin-like growth factor-I and interleukin-1 receptor antagonist protein controls cartilage degradation in an osteoarthritic culture model. J Orthop Res. 2005;23(1):118–126. doi: 10.1016/j.orthres.2004.06.020. [DOI] [PubMed] [Google Scholar]
- Im HJ, Muddasani P, Natarajan V, Schmid TM, Block JA, Davis F, van Wijnen AJ, Loeser RF. Basic fibroblast growth factor stimulates matrix metalloproteinase-13 via the molecular cross-talk between the mitogen-activated protein kinases and protein kinase Cδ pathways in human adult articular chondryocytes. J Biol Chem. 2007;282:11110–11121. doi: 10.1074/jbc.M609040200. [DOI] [PMC free article] [PubMed] [Google Scholar]
- Kashimata MW, Sakagami HW, Gresik EW. Intracellular signalling cascades activated by the EGF receptor and/or by integrins, with potential relevance for branching morphogenesis of the fetal mouse submandibular gland. Eur J Morphol. 2000;38(4):269–275. doi: 10.1076/0924-3860(200010)38:4;1-o;ft269. [DOI] [PubMed] [Google Scholar]
- Keyszer GM, Heer AH, Kriegsmann J, Geiler T, Keysser C, Gay RE, Gay S. Detection of insulin-like growth factor I and II in synovial tissue specimens of patients with rheumatoid arthritis and osteoarthritis by in situ hybridization. J Rheumatol. 1995;22(2):275–281. [PubMed] [Google Scholar]
- Kohles SS, Wilson CG, Bonassar LJ. A mechanical composite spheres analysis of engineered cartilage dynamics. J Biomech Eng. 2007;129(4):473–480. doi: 10.1115/1.2746366. [DOI] [PMC free article] [PubMed] [Google Scholar]
- Li J, Fu X, Sun X, Sun T, Sheng Z. The interaction between epidermal growth factor and metalloproteinase induces the development of sweat glands in human fetal skin. J Surg Res. 2002;106(2):258–263. doi: 10.1006/jsre.2002.6469. [DOI] [PubMed] [Google Scholar]
- Loeser RF, Chubinskaya S, Pacione C, Im H. Basic fibroblast growth factor inhibits the anabolic activity of insulin-like growth factor I and osteoprotein I in adult human articular cartilage chondryocytes. Arthritis Rheum. 2005;52(12):3910–3917. doi: 10.1002/art.21472. [DOI] [PMC free article] [PubMed] [Google Scholar]
- Middleton JFS, Tyler JA. Upregulation of insulin-like growth factor I gene expression in the lesions of osteoarthritic humanarticular cartilage. Ann Rheum Dis. 1992;51(4):440–447. doi: 10.1136/ard.51.4.440. [DOI] [PMC free article] [PubMed] [Google Scholar]
- Moos V, Fickert S, Muller B, Weber U, Sleper J. Immunohistological analysis of cytokine expression in human osteoarthritic and healthy cartilage. J Rheumatol. 1999;26(4):870–879. [PubMed] [Google Scholar]
- Mow VC, Ratcliffe A. Structure and function of articular cartilage and menicus. In: Mow VC, Hayes WC, editors. Basic Orthopaedic Biomechanics. Raven Press; New York: 1997. pp. 113–178. [Google Scholar]
- Murphy G, Knauper V, Atkinson S, Butler G, English W, Hutton M, Stracke J, Clark I. Matrix metalloproteinases in arthritic disease. Arthritis Res. 2002;4(3):S39–49. doi: 10.1186/ar572. [DOI] [PMC free article] [PubMed] [Google Scholar]
- Nikolaev NI, Obradovic B, Versteeg HK, Lemon G, Williams DJ. A validated model of GAG deposition, cell distribution, and growth of tissue engineered cartilage cultured in a rotating bioreactor. Biotechnol Bioeng 2009. 2009 Oct 20; doi: 10.1002/bit.22581. Epub ahead of print. [DOI] [PubMed] [Google Scholar]
- Ohuchi E, Imai K, Fujii Y, Sato H, Seiki M, Okada Y. Membrane type 1 matrix metalloproteinase digests interstitial collagens and other extracellular matrix macromolecules. J Biol Chem. 1997;272:2446–2451. doi: 10.1074/jbc.272.4.2446. [DOI] [PubMed] [Google Scholar]
- Ramage L, Nuki G, Salter DM. Signalling cascades in mechanotransduction: cell-matrix interactions and mechanical loading. Scand J Med Sci Sports. 2009;19(4):457–469. doi: 10.1111/j.1600-0838.2009.00912.x. [DOI] [PubMed] [Google Scholar]
- Roughley PJ, Lee ER. Cartilage proteoglycans: structure and potential functions. Microsc Res Tech. 1994;28(5):385–397. doi: 10.1002/jemt.1070280505. [DOI] [PubMed] [Google Scholar]
- Saha AK, Kohles SS. A distinct catabolic to anabolic threshold due to single-cell static nanomechanical stimulation in a cartilage biokinetics model. J Nanotechnol Eng Med. 2010a;1(3):031005–8. doi: 10.1115/1.4001934. [DOI] [PMC free article] [PubMed] [Google Scholar]
- Saha AK, Kohles SS. Periodic nanomechanical stimulation in a biokinetics model identifying anabolic and catabolic pathways associated with cartilage matrix homeostasis. J Nanotechnol Eng Med. 2010b;1(4):041001–7. doi: 10.1115/1.4002461. [DOI] [PMC free article] [PubMed] [Google Scholar]
- Saha AK, Mazumdar JN, Kohles SS. Prediction of growth factor effects on engineered cartilage composition using deterministic and stochastic modeling. Ann Biomed Eng. 2004;32(6):871–879. doi: 10.1023/b:abme.0000030262.82626.9c. [DOI] [PMC free article] [PubMed] [Google Scholar]
- Saha AK, Mazumdar JN, Kohles SS. Dynamic matrix composition in engineered cartilage with stochastic supplementation of growth factors. Australas Phys Eng Sci Med. 2005;28:97–104. doi: 10.1007/bf03178699. [DOI] [PMC free article] [PubMed] [Google Scholar]
- Stanton H, Rogerson FM, East CJ, Golub SB, Lawlor KE, Meeker CT, Little CB, Last K, Farmer PJ, Campbell IK, Fourie AM, Fosang AJ. ADAMTS5 is the major aggrecanase in mouse cartilage in vivo and in vitro. Nature. 2005;434(7033):648–652. doi: 10.1038/nature03417. [DOI] [PubMed] [Google Scholar]
- Van den Berg, B W. The role of cytokines and growth factors in cartilage destruction in osteoarthritis and rheumatoid arthritis. Z Rheumatol. 1999;58(3):136–141. doi: 10.1007/s003930050163. [DOI] [PubMed] [Google Scholar]
- Vincenti MP, Brinckerhoff CE. The potential of signal transduction inhibitors for the treatment of arthritis: is it all just JNK. J Clin Invest. 2001;108(2):181–183. doi: 10.1172/JCI13508. [DOI] [PMC free article] [PubMed] [Google Scholar]
- Wilson CG, Bonassar LJ, Kohles SS. Modeling the dynamic composition of engineered cartilage. Arch Biochem Biophys. 2002;408(Part 2):246–254. doi: 10.1016/s0003-9861(02)00562-3. [DOI] [PubMed] [Google Scholar]


