

Abstract
The rDNA internal transcribed spacer (ITS) region has been accepted as a DNA barcoding marker for fungi and is widely used in phylogenetic studies; however, intragenomic ITS variability has been observed in a broad range of taxa, including prokaryotes, plants, animals, and fungi, and this variability has the potential to inflate species richness estimates in molecular investigations of environmental samples. In this study 454 amplicon pyrosequencing of the ITS1 region was applied to 99 phylogenetically diverse axenic single-spore cultures of fungi (Dikarya: Ascomycota and Basidiomycota) to investigate levels of intragenomic variation. Three species (one Basidiomycota and two Ascomycota), in addition to a positive control species known to contain ITS paralogs, displayed levels of molecular variation indicative of intragenomic variation; taxon inflation due to presumed intragenomic variation was ≈9%. Intragenomic variability in the ITS region appears to be widespread but relatively rare in fungi (≈3–5% of species investigated in this study), suggesting this problem may have minor impacts on species richness estimates relative to PCR and/or pyrosequencing errors. Our results indicate that 454 amplicon pyrosequencing represents a powerful tool for investigating levels of ITS intragenomic variability across taxa, which may be valuable for better understanding the fundamental mechanisms underlying concerted evolution of repetitive DNA regions.
Keywords: Environmental sequencing, operational taxonomic units, pyrosequencing, species richness
Introduction
The internal transcribed spacer (ITS) region of nuclear ribosomal DNA is the most commonly sequenced region in fungi and is used in fungal systematics to define species, to infer phylogenetic relationships, and for identification (DNA barcoding) of fruiting bodies, cultures, and DNA in environmental samples (Horton and Bruns 2001; Peay et al. 2008; Begerow et al. 2010). The ITS region has recently been proposed as the universal barcode for all fungi (Schoch et al. 2012). Although mycologists rely heavily on ITS to define and detect species and to understand fungal evolution, there are many long-recognized problems with using this region. Problems range from a lack of interspecific variation in some groups of fungi, especially some Ascomycota (Rehner and Buckley 2005; Balajee et al. 2007; Rojas et al. 2010), to an abundance of variation among individuals within populations (Kårén et al. 1997; Kauserud and Schumacher 2002; Nilsson et al. 2008; Blaalid et al. 2013). These problems are not unique to the ITS region and it is unlikely that any single, short DNA region includes levels of molecular variation suitable for separating species across a phylogenetic group as broad as kingdom Fungi, with an estimated 1.5–5.1 million extant species (Hawksworth 2001; Schmit and Mueller 2007; Blackwell 2011).
However, one problem that is relatively unique to rDNA regions, including the ITS region, is the possibility for significant intragenomic (within-individual) variability. This potential arises because the ribosomal tandem array occurs at high copy number, which in fungi can range from approximately 45 to 200 copies per genome and span several chromosomes (Maleszka and Clark-Walker 1990; Ganley and Kobayashi 2007). Intragenomic ITS variability has been observed in a wide range of taxa, including prokaryotes, plants, animals, and fungi (Feliner et al. 2004; Wörheide et al. 2004; Stewart and Cavanaugh 2007; Simon and Weiss 2008; James et al. 2009; Vydryakova et al. 2012). In one recent case, intragenomic ITS variation was noted in the fungal genus Laetiporus, a group of brown-rot polypores in the Antrodia clade (Lindner and Banik 2011). Intragenomic variation in this group was found to inflate estimates of species richness and to complicate phylogenetic investigations when cloned ITS sequences rather than ITS sequences obtained by direct Sanger sequencing were analyzed. Unfortunately it is not known how widespread this phenomenon is in kingdom Fungi. If such intragenomic variation is common it will cause significant problems with the analysis of environmental sequencing data. These problems could be especially severe with high-throughput next-generation sequencing methods (e.g., 454 pyrosequencing, Illumina, and IonTorrent), where even low-frequency ITS paralogs will be detected.
Our aim was to explore levels of intragenomic divergence in the Dikarya (Ascomycota and Basidiomycota) using large-scale sequencing of ITS1 amplicons derived from axenic single-spore cultures. Laetiporus cincinnatus, a species known to contain significant intragenomic variation (Lindner and Banik 2011), was included as a positive control. A wide range of phylogenetically diverse Basidiomycota and Ascomycota single-spore cultures were chosen from culture collections and the ITS1 region was amplified and subjected to 454 pyrosequencing (Margulies et al. 2005).
Materials and Methods
Fungal cultures
One hundred and twenty-seven single-spore cultures from diverse phylogenetic lineages in the Dikarya (Ascomycota and Basidiomycota) were originally screened for use in this study. Of these, 99 produced >100 pyrosequencing reads following initial data filtering (see methods below) and were included in the final dataset; 44 were Ascomycota and 55 were Basidiomycota (Appendix). Cultures were obtained from the culture collections of the Center for Forest Mycology Research (CFMR), maintained by the US Forest Service, Northern Research Station in Madison, WI; the ARON culture collection at the Department of Biology, University of Oslo; the Norwegian Veterinary Institute; and from the Norwegian Forest and Landscape Institute culture collections. All Basidiomycota were checked for, and found to lack, clamp connections, one potential sign of a dikaryotic mycelium.
Molecular methods
DNA was extracted from the axenic cultures following a 2% CTAB (hexadecyl-trimethyl-ammonium bromide) miniprep method described by Murray and Thompson (1980) with minor modifications: DNA was resuspended in 60-μL distilled sterile H2O at the final step of extraction. Samples were prepared for 454 pyrosequencing by performing nested PCR amplification using the fungal-specific primers ITS1F and ITS4 (White et al. 1990; Gardes and Bruns 1993) in the first step, and fusion primers including ITS5 and ITS2 (White et al. 1990) in the nested step. Fusion primers were constructed by adding 16 different unique 10 bp tags (Technical bulletin 005-2009, Roche Diagnostics Corp., Basel, Switzerland) and 454 pyrosequencing Titanium adaptors A and B to ITS5 and ITS2, respectively. The same tags were added to both forward and reverse primers. All PCR reactions were performed in three parallels for all samples for both PCR steps. PCR was performed on an MJ thermal cycler PTC-200 in 20-μL reactions containing 2-μL template DNA and 18-μL reaction mix. Final concentrations were 0.10 mmol/L dNTP mix, 0.125 μmol/L of each primer, and 0.5 units polymerase (Phusion Hot Start II, Finnzymes, Vantaa). The PCR amplification program was as follows: 30 sec at 98°C, followed by 20 cycles of 10 sec at 98°C, 20 sec at 50°C, 20 sec at 72°C, and a final extension step at 72°C for 7 min before storage at −20°C. The nested PCR was run with the same reaction concentrations and amplification program, but with a 50× diluted PCR mix as a template. After normalization of DNA concentration using the SequalPrep™ Normalization Plate (96) Kit following the manufacturer's protocol (Invitrogen, CA), PCR products were pooled into 8 equimolar amplicon libraries and cleaned with Wizard® SV Gel and PCR Clean-Up System (Promega, Madison, WI). The 454 Titanium sequencing of the tagged amplicons was performed at the Norwegian High-Throughput Sequencing Centre (http://www.sequencing.uio.no) using a 454 plate divided into eight compartments.
Bioinformatics analyses
As an initial filter, we removed all sequences with more than two errors in the primer sequence; with one or more errors in the tag sequence; with one or more DNA ambiguity symbols (N); or with an overall length of less than 150 bases. Reads with noncompatible tag combinations (Carlsen et al. 2012) also were removed. Sequence data were not denoized (e.g., Quince et al. 2011) so as to retain PCR and sequencing errors in addition to intragenomic ITS variation. Based on tag information, the sequences were split into 127 datasets representing the various single-spore cultures plus two negative controls. Twenty-eight datasets were discarded from further analyses due to a low number of reads (<100), leaving 99 species in the final dataset. Alignments were constructed in MAFFT 6.903 (Katoh and Toh 2008) for all datasets using the default (auto) strategy, which typically resulted in the FFT-NS-1 or FFT-NS-2 algorithm being selected. Manual inspection and BLAST searches (Altschul et al. 1997) of GenBank (Benson et al. 2012) also identified “contaminant sequences” in some datasets that represented species from the other datasets. These were interpreted as sequences that had switched tags at both ends (see Carlsen et al. 2012) and were excluded from the analysis. The final MAFFT alignments of the 99 accepted datasets were analyzed in DnaSP (Librado and Rozas 2009), where descriptive molecular variation statistics were calculated, including number of reads, number of alignment sites, number of haplotypes, haplotype diversity, nucleotide diversity (pi), and average number of nucleotide differences (k).
Using single linkage clustering as implemented in BLASTCLUST (cf. Altschul et al. 1997) all datasets were clustered using 85% sequence coverage and either 97% or 99% sequence similarity. The total number of clusters as well as nonsingleton clusters was calculated. In eight species (Armillaria cf. novae-zelandiae HHB15567, Aspergillus sp. VI05307, Annulohypoxylon multiforme 1967-10_ss-1, L. cincinnatus HHB15746, Laetiporus conifericola AK1, Laetiporus huroniensis HMC1, Laetiporus sulphureus DA41, and Polyporales sp. HHB9461, hereafter referred to without collection numbers), data were explored further using neighbor-joining analyses as implemented in MEGA (Tamura et al. 2007) with the Jukes–Cantor model of evolution and uniform rate variation among sites implemented.
Results
After filtering, a total of 148,046 sequences were analyzed from the 99 isolates, yielding 9086 individual haplotypes (i.e., the number of clusters at 100% sequence similarity; Appendix). The number of reads per species ranged from 176 to 4212 with an average of 1495 reads per species. A strong positive correlation was observed between number of haplotypes per species and sequencing depth (Fig. 1A). However, the average number of nucleotide differences per species did not correlate with sequencing depth (Fig. 1B). There was a weak positive correlation between the total number of clusters detected per species and sequencing depth both at the 97% (Fig. 1C) and 99% (Fig. 1E) clustering level. However, when the comparison was restricted to nonsingleton clusters, no relationship was detected between the number of clusters and sequencing depth at 97% (Fig. 1D) or 99% (Fig. 1F). In the full dataset of 99 taxa, 97% clustering of sequences produced 286 clusters. When excluding the singletons, 110 clusters were retained (Appendix). Even at a 99% sequence clustering level, 79% of the species included only one cluster when excluding singletons. In 92 of the 99 species, between 99.6% and 100% of the sequences were assigned to a single cluster by the clustering process (Appendix). Only in three species (Aspergillus sp., L. cincinnatus, and L. huroniensis) were more than 1.1% of the sequences affiliated with cluster(s) other than the most frequent.
Figure 1.
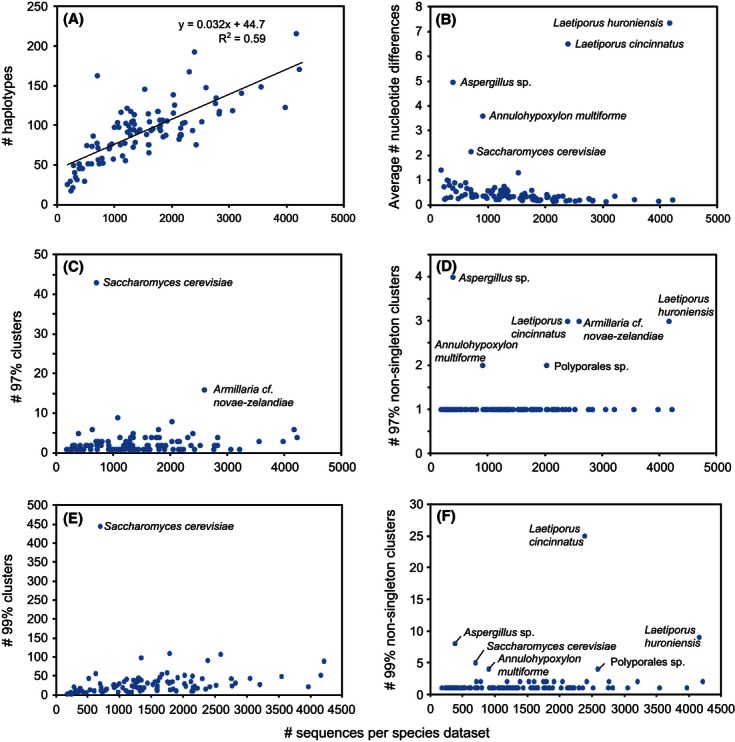
Molecular variation in the internal transcribed spacer (ITS1) amplified from 99 fungal species and plotted against sequencing depth. (A) Number of ITS1 haplotypes in each dataset. (B) Average number of nucleotide differences between ITS1 sequences in each dataset. (C) Number of sequence clusters obtained from each dataset using BLASTCLUST and a 97% sequence similarity cutoff. (D) Number of nonsingleton sequence clusters obtained from each dataset using BLASTCLUST and a 97% sequence similarity cutoff. (E) Number of sequence clusters obtained from each dataset using BLASTCLUST and a 99% sequence similarity cutoff. (F) Number of nonsingleton sequence clusters obtained from each dataset using BLASTCLUST and a 99% sequence similarity cutoff.
As expected, the L. cincinnatus sequences exhibited high levels of molecular variation (k = 6.5) (Appendix, Fig. 1B) reflecting the already documented intragenomic ITS divergence in this species (Lindner and Banik 2011). Another Laetiporus species (L. huroniensis) that was poorly sampled by Lindner and Banik (2011) showed similarly high levels of molecular variation (k = 7.3). These two species displayed three nonsingleton 97% operational taxonomic units (OTU) (Fig. 1D) and numerous subgroups in the ITS phylogenies (Fig. 2). With a few exceptions, the remaining species displayed low sequence variation primarily with k < 1 and one nonsingleton 97% OTU. However, in addition to the two Laetiporus species, four additional species (Armillaria cf. novae-zelandiae, Aspergillus sp., Annulohypoxylon multiforme, and Polyporales sp.; see Fig. 1D) displayed more than one nonsingleton OTU at 97% sequence identity (Appendix).
Figure 2.

Neighbor-joining trees illustrating sequence variation in the ITS1 alignments in species with varying levels of molecular variation. Armillaria cf. novae-zelandiae, Aspergillus sp., Annulohypoxylon multiforme, Laetiporus cincinnatus, L. huroniensis, Polyporales sp., and Saccharomyces cerevisiae are included as species with high levels of variation, whereas Laetiporus conifericola and L. sulphurensis are included as typical examples representing species with lower levels of variation. Both midpoint rooted and unrooted trees are shown for all taxa. Similar scales are used across all trees to enable direct comparisons. We hypothesize that the star-shaped unrooted trees observed for Armillaria cf. novae-zelandiae, L. conifericola, L. sulphurensis, Polyporales sp., and Saccharomyces cerevisiae are due to PCR and sequencing errors, whereas the more complex trees for Aspergillus sp., Annulohypoxylon multiforme, L. cincinnatus, and L. huroniensis are due to intragenomic variation.
Four species (Aspergillus sp., Annulohypoxylon multiforme, L. cincinnatus, and L. huroniensis) displayed signs of intragenomic ITS variation when neighbor-joining trees were constructed; the remaining species displayed star-shaped trees (unrooted) more suggestive of PCR and pyrosequencing error (Fig. 2). One species, Saccharomyces cerevisiae, displayed a very high number of divergent sequences at both the 99% and 97% levels, although the vast majority of these sequences were singletons (Fig. 1C and E) and the unrooted neighbor-joining tree for this species was star shaped (Fig. 2).
Discussion
Although three of the 98 previously unsampled fungal species (≈3%) displayed signs of intragenomic variation in the ITS region based on neighbor-joining analyses and five species (≈5%) displayed greater than one nonsingleton cluster at 97% sequence identity, the majority of species displayed levels of sequence variation that likely could be ascribed to PCR and sequencing errors. Hence, most species seem to possess well-homogenized ITS tandem arrays, indicating that intragenomic variation in the ITS region will not severely affect environmental studies utilizing next-generation sequencing if certain data-handling steps are followed. In our dataset of 98 taxa (excluding the positive control L. cincinnatus), 97% clustering of sequences produced 281 OTUs (187% inflation), whereas similar clustering with the exclusion of singletons produced 107 OTUs (9% inflation) (Appendix). Our results support removal of all singleton clusters in addition to sequence denoizing (Quince et al. 2011) as critical steps for limiting taxon inflation due to PCR/sequencing errors and/or intragenomic variation.
Interestingly, one species, Saccharomyces cerevisiae, showed an abundance of divergent singleton sequences (42 of 43 OTUs were singletons at 97% clustering), although without greater sequencing depth it is difficult to say if these divergent singletons are due to PCR/sequencing errors or intragenomic variability. Unfortunately it is difficult to distinguish among PCR/sequencing errors and intragenomic variation, although in the case of PCR/sequencing errors the number of haplotypes should increase with sequencing depth, whereas for intragenomic variability there should be little correlation between the number of haplotypes and sequencing depth (cf. Dickie 2010). With great enough sequencing depth, it should be possible within individual species to distinguish between plateauing/stabilizing numbers of intragenomic haplotypes and sequencing errors.
Additional methods specifically correcting for inflation due to intragenomic variability could be developed as next-generation sequencing methods are employed to screen larger numbers of taxa for the presence of intragenomic heterogeneity and rare ITS paralogs are documented. For traditional Sanger-based sequencing projects utilizing consensus sequences (e.g., from root tips, fruiting bodies, or cultures), the presence of rare ITS haplotypes in a genome does not appear to be a major concern, given that species with significant intragenomic ITS variation (e.g., L. cincinnatus) can produce “clean” consensus sequences representing the most common ITS variants (Lindner and Banik 2011). However, if certain variants in an ITS array become common, these copies could manifest themselves as seemingly unresolvable bases in sequence chromatograms, a phenomenon observed when allelic heterozygosity in ITS is encountered as a result of differing nuclei in a dikaryotic/heterokaryotic mycelium (Huang et al. 2010; Hyde et al. 2013). In the case of allelic heterozygosity of ITS, one would expect to observe two primary variants in approximately equal ratios.
For the fungal strains used in this study, we cannot entirely rule out that some of the observed variation is due to differing nuclei within a single mycelium (see Horton 2006), despite the fact that efforts were made to ensure monokaryotic isolates (e.g., sampling cultures derived from single spores and screening all Basidiomycota for the presence of clamp connections, a morphological feature indicative of a dikaryon). For species containing intragenomic variation (e.g., Annulohypoxylon multiforme, Aspergillus sp., L. cincinnatus, and L. huroniensis; Fig. 2), we observed more than two variants/clades and variants were not observed in approximately equal ratios, as would be expected if this variation was due to heterozygosity in a dikaryotic/heterokaryotic mycelium. In addition, the level of variation observed for some species was very high, with k (average nucleotide difference) ranging up to 7.4 in L. huroniensis. Such a high level of allelic divergence is typically not expected in a heterozygous individual (Hughes et al. 2009).
In order to fully understand the extent of intragenomic ITS variation in fungi, a broader phylogenetic range of species will need to be surveyed, including members of other fungal phyla such as Chytridiomycota s.l., Glomeromycota, and Zygomycota s.l. Significant intragenomic ITS variation has recently been detected in Batrachochytrium dendrobatidis, the chytrid fungus implicated in worldwide amphibian declines (Berger et al. 1998). Individual B. dendrobatidis genomes were found to contain up to 20 ITS haplotypes per genome (Schloegel et al. 2012), suggesting that significant intragenomic variation in the ITS region is a phenomenon that occurs in diverse fungal lineages. Our results indicate that high-throughput sequencing works well for detecting intragenomic variation and could be applied to an even wider range of species, although it will be difficult to screen fungi that are difficult to culture (e.g., Glomeromycota) or for which haploid material may be difficult to obtain. Given an estimated 1.5–5.1 million fungal species worldwide (Hawksworth 2001; Schmit and Mueller 2007; Blackwell 2011), few generalizations can be made because at best approximately 0.01% of fungal species have been sampled for intragenomic variation to date.
Because fungi are extremely diverse and it is difficult and time consuming to characterize species using traditional methods, it has recently been suggested that fungal species could be formally named based on environmental ITS data (Hibbett et al. 2011). Given the current findings, formal naming of environmental ITS sequences may present potential problems that need to be taken into account because environmental sequences will not always correspond to species in the traditional sense. Reconciling disparate ITS copies under one and the same species would be possible under such systems, but would require prior knowledge and manual intervention. Despite these potential problems, the ITS region seems to be the best DNA barcode currently available, although additional regions will be needed in the future for many fungal groups (cf. Gazis et al. 2011).
The present work suggests that significant intragenomic variation in the ITS region is potentially widespread in a small percentage of species throughout kingdom Fungi. A possible mechanism for generation of intragenomic variation is hybridization (James et al. 2009), although mechanisms capable of maintaining this variation are poorly understood. Understanding the mechanisms that allow ITS paralogs to “escape” concerted evolution in certain species may be the key to understanding how concerted evolution acts so efficiently in the majority of situations. Despite the fact that a large percentage of eukaryotic DNA is repetitive and subject to homogenization via concerted evolution, the fundamental mechanisms of concerted evolution remain largely unknown (Dover 1993; Elder and Turner 1995; Liao 1999).
Given that ITS regions often differ among species, it must be concluded that the ITS region typically evolves significantly during the time it takes for species to diverge. However, it is not known if species displaying large levels of intragenomic variation are being “caught in the act” of evolving, or whether these species can maintain this variation over long evolutionary periods of time. When ITS sequences diverge via speciation, the observed variation will be based on a combination of how quickly species diverge (i.e., how quickly the ITS regions diverge) relative to how quickly concerted evolution erases variation. If rare ITS paralogs do indeed represent traces of previous speciation or hybridization events, it may be possible to use these variants to better understand the evolution of fungal species complexes.
Acknowledgments
We would like to acknowledge Cecilie Mathiesen for lab assistance, the Norwegian Veterinary Institute and Norwegian Forest and Landscape Institute for providing fungal cultures, and Ari Jumpponen for discussions. We would also like to acknowledge the Norwegian Sequencing Center for conducting the 454 sequencing. The University of Oslo and the US Forest Service, Northern Research Station, are acknowledged for financial support. RHN acknowledges financial support from FORMAS (215-2011-498) and from the Carl Stenholm Foundation.
Appendix
List of single-spore isolates subjected to pyrosequencing and summary of molecular variation statistics by isolate
| Taxon | Isolate code/Collection number | Number of sequences after initial data filtering | Number of sites | Number of polymorphisms | Number of haplotypes | Haplotype diversity | Nucleotide diversity (Pi) | Average nucleotide difference (k) | Number of clusters (OTUs) at 97% sequence identity | % of total # of sequences in the most abundant 97% cluster | Number of nonsingleton clusters (OTUs) at 97% sequence identity | Number of clusters (OTUs) at 99% sequence identity | Number of nonsingleton clusters (OTUs) at 99% sequence identity |
|---|---|---|---|---|---|---|---|---|---|---|---|---|---|
| Aleurodiscus oakesii | HHB-14363 | 596 | 338 | 58 | 52 | 0.218 | 0.00164 | 0.444 | 1 | 100.00 | 1 | 11 | 1 |
| Alternaria alternata | VI 04067 | 343 | 294 | 33 | 32 | 0.194 | 0.00132 | 0.337 | 1 | 100.00 | 1 | 6 | 1 |
| Annulohypoxylon multiforme | 1967-10 ss-1 | 903 | 349 | 70 | 71 | 0.44 | 0.01582 | 3.607 | 3 | 99.67 | 2 | 26 | 4 |
| Antrodia carbonica | MJL-1364 | 1775 | 398 | 98 | 97 | 0.159 | 0.00107 | 0.243 | 2 | 99.94 | 1 | 32 | 1 |
| Armillaria cf. novae-zelandiae | HHB-15567 | 2588 | 563 | 117 | 148 | 0.1557 | 0.00083 | 0.216 | 16 | 98.96 | 3 | 107 | 4 |
| Ascocoryne cylichnium | VI 03548 | 302 | 365 | 65 | 41 | 0.282 | 0.00339 | 1.004 | 2 | 99.67 | 1 | 14 | 1 |
| Aspergillus sp. | VI 05307 | 383 | 323 | 54 | 46 | 0.492 | 0.01927 | 4.97 | 5 | 86.68 | 4 | 16 | 8 |
| Asterostroma cervicolor | French | 1274 | 357 | 81 | 95 | 0.558 | 0.00335 | 0.777 | 3 | 99.84 | 1 | 39 | 1 |
| Auriporia aurulenta | HHB-8864 | 2753 | 410 | 99 | 128 | 0.1581 | 0.00133 | 0.277 | 1 | 100.00 | 1 | 43 | 1 |
| Bipolaris sorokiniana | VI 05062 | 319 | 319 | 68 | 35 | 0.283 | 0.00324 | 0.821 | 2 | 99.69 | 1 | 8 | 1 |
| Bjerkandera adusta | FP-101729 | 380 | 339 | 58 | 52 | 0.349 | 0.00247 | 0.703 | 1 | 100.00 | 1 | 18 | 1 |
| Botryotinia calthae | 1907.3 | 239 | 262 | 21 | 18 | 0.168 | 0.00106 | 0.258 | 1 | 100.00 | 1 | 2 | 1 |
| Candida albicans | VI 05304 | 2156 | 283 | 78 | 88 | 0.129 | 0.00105 | 0.223 | 1 | 100.00 | 1 | 11 | 1 |
| Cenangium ferruginosum | 2678.P | 2764 | 350 | 107 | 135 | 0.1588 | 0.00116 | 0.258 | 2 | 99.96 | 1 | 24 | 2 |
| Ceraceomyces americanus | HHB-11668 | 176 | 325 | 35 | 26 | 0.48 | 0.00477 | 1.431 | 1 | 100.00 | 1 | 3 | 1 |
| Ceratocystis polonica | 1997-770/9 | 1594 | 321 | 84 | 76 | 0.146 | 0.00126 | 0.274 | 2 | 99.94 | 1 | 23 | 1 |
| Ceriporiopsis subvermispora | L-14807 | 1274 | 358 | 84 | 88 | 0.217 | 0.00159 | 0.409 | 1 | 100.00 | 1 | 20 | 1 |
| Cerocorticium rickii | FP-102045 | 284 | 399 | 72 | 50 | 0.361 | 0.00343 | 1.027 | 2 | 99.65 | 1 | 21 | 1 |
| Chlorociboria aeruginosa | 1785.P | 3205 | 338 | 100 | 141 | 0.2178 | 0.00194 | 0.378 | 1 | 100.00 | 1 | 28 | 2 |
| Chrysosporium guarri | VI 05044 | 1843 | 379 | 81 | 86 | 0.125 | 0.00078 | 0.205 | 2 | 99.95 | 1 | 16 | 1 |
| Ciboria acerina | 1955.1 | 2821 | 318 | 87 | 118 | 0.1419 | 0.00104 | 0.208 | 4 | 99.89 | 1 | 32 | 1 |
| Cladosporium sp | Marie6 | 1587 | 311 | 77 | 76 | 0.135 | 0.00092 | 0.209 | 2 | 99.94 | 1 | 12 | 1 |
| Claviceps purpurea | VI 04914 | 1798 | 355 | 85 | 94 | 0.174 | 0.00158 | 0.321 | 4 | 99.83 | 1 | 34 | 2 |
| Collybia carleae | GB-263.02 | 949 | 364 | 64 | 77 | 0.242 | 0.00148 | 0.382 | 1 | 100.00 | 1 | 24 | 1 |
| Cotylidia undulata | HHB-13581 | 1241 | 422 | 82 | 100 | 0.22 | 0.00142 | 0.374 | 2 | 99.92 | 1 | 27 | 1 |
| Cryptoporus volvatus | CORAM-74-13 | 1049 | 354 | 95 | 104 | 0.2752 | 0.00185 | 0.489 | 1 | 100.00 | 1 | 19 | 1 |
| Cudonia confusa | 2487.P | 975 | 275 | 60 | 58 | 0.152 | 0.00138 | 0.297 | 1 | 100.00 | 1 | 8 | 1 |
| Cylindrobasidium albulum | HHB-15055 | 515 | 415 | 78 | 75 | 0.411 | 0.00281 | 0.804 | 2 | 99.81 | 1 | 44 | 1 |
| Cyptotrama aspersa | DR-58 | 1341 | 506 | 95 | 114 | 0.2931 | 0.0022 | 0.588 | 5 | 99.70 | 1 | 98 | 1 |
| Debaryomyces hansenii | VI 05047 | 1357 | 356 | 82 | 79 | 0.161 | 0.00118 | 0.306 | 1 | 100.00 | 1 | 14 | 1 |
| Dermea balsamea | 1980-50 | 475 | 293 | 42 | 30 | 0.146 | 0.00107 | 0.281 | 1 | 100.00 | 1 | 6 | 1 |
| Diaporthe eres | 2003-182 | 1297 | 342 | 105 | 105 | 0.219 | 0.00219 | 0.472 | 4 | 99.77 | 1 | 45 | 1 |
| Dichostereum effuscatum | FP-101758 | 227 | 331 | 58 | 30 | 0.255 | 0.00259 | 0.755 | 1 | 100.00 | 1 | 7 | 1 |
| Echinodontium tinctorium | Aho-80 | 1330 | 340 | 104 | 95 | 0.199 | 0.00141 | 0.371 | 2 | 99.92 | 1 | 20 | 1 |
| Entoleuca mammata | 3635.P | 1187 | 263 | 70 | 56 | 0.143 | 0.00116 | 0.245 | 2 | 99.92 | 1 | 8 | 2 |
| Fomitopsis pinicola | 32-TT | 1215 | 391 | 101 | 122 | 0.3028 | 0.00245 | 0.616 | 3 | 99.84 | 1 | 39 | 1 |
| Fusarium graminearum | VI 05256 | 1595 | 295 | 62 | 66 | 0.138 | 0.00095 | 0.208 | 2 | 99.94 | 1 | 13 | 1 |
| Fusarium sp. | Marie4 | 1136 | 282 | 64 | 62 | 0.128 | 0.00102 | 0.243 | 1 | 100.00 | 1 | 7 | 1 |
| Geopyxis carbonaria | 1805.1 | 2221 | 357 | 103 | 104 | 0.1928 | 0.00149 | 0.368 | 1 | 100.00 | 1 | 18 | 1 |
| Gloeophyllum mexicanum | FP-104037 | 536 | 316 | 63 | 52 | 0.215 | 0.00147 | 0.38 | 2 | 99.81 | 1 | 14 | 1 |
| Hapalopilus croceus | HHB-10800 | 1785 | 522 | 106 | 107 | 0.223 | 0.0016 | 0.387 | 6 | 99.72 | 1 | 110 | 1 |
| Hericium abietis | Aho-42 | 1553 | 354 | 82 | 89 | 0.179 | 0.00124 | 0.286 | 4 | 99.81 | 1 | 35 | 1 |
| Hohenbuehelia mastrucata | TJV-92-1 | 1280 | 438 | 116 | 118 | 0.2892 | 0.00223 | 0.623 | 3 | 99.84 | 1 | 35 | 1 |
| Hymenoscyphus rhodoleucus | 2329.P | 2180 | 330 | 97 | 103 | 0.1174 | 0.00085 | 0.184 | 1 | 100.00 | 1 | 23 | 1 |
| Hyphodontia arguta | FP-101727 | 2147 | 407 | 84 | 97 | 0.153 | 0.00105 | 0.228 | 3 | 99.91 | 1 | 50 | 1 |
| Hypochnicium vellereum | HHB-10134 | 1071 | 417 | 113 | 98 | 0.295 | 0.0021 | 0.609 | 9 | 99.25 | 1 | 35 | 1 |
| Inonotus circinatus | FP-102449 | 604 | 363 | 97 | 74 | 0.471 | 0.00316 | 0.92 | 2 | 99.83 | 1 | 11 | 1 |
| Junghuhnia nitida | FP-104355 | 1194 | 359 | 102 | 103 | 0.247 | 0.00166 | 0.431 | 1 | 100.00 | 1 | 24 | 1 |
| Lachnum virgineum | 2802.P | 795 | 313 | 68 | 53 | 0.171 | 0.0015 | 0.376 | 3 | 99.75 | 1 | 16 | 1 |
| Laeticorticium roseum | Weholt-72 | 910 | 329 | 67 | 72 | 0.217 | 0.00161 | 0.383 | 1 | 100.00 | 1 | 27 | 1 |
| Laetiporus cincinnatus | HHB-15746 | 2387 | 375 | 99 | 193 | 0.6829 | 0.03681 | 6.515 | 5 | 82.49 | 3 | 91 | 25 |
| Laetiporus conifericola | AK-1 | 2041 | 334 | 106 | 126 | 0.1898 | 0.00148 | 0.349 | 1 | 100.00 | 1 | 23 | 2 |
| Laetiporus huroniensis | HMC-1 | 4159 | 376 | 122 | 216 | 0.56 | 0.0402 | 7.356 | 6 | 72.47 | 3 | 52 | 9 |
| Laetiporus sulphureus s.l. | DA-41 | 1321 | 312 | 85 | 73 | 0.493 | 0.00272 | 0.65 | 2 | 99.92 | 1 | 11 | 1 |
| Laxitextum bicolor | NO-7316 | 2515 | 346 | 96 | 105 | 0.135 | 0.00081 | 0.18 | 2 | 99.96 | 1 | 26 | 1 |
| Lentinus tigrinus | 466 | 1385 | 363 | 79 | 92 | 0.194 | 0.00134 | 0.349 | 1 | 100.00 | 1 | 19 | 2 |
| Leptodontidium beauverioides | 1995-593/61 | 711 | 312 | 66 | 57 | 0.169 | 0.00149 | 0.343 | 1 | 100.00 | 1 | 20 | 2 |
| Marasmius fiardii | PR-910 | 625 | 391 | 83 | 87 | 0.339 | 0.00291 | 0.693 | 6 | 99.20 | 1 | 57 | 1 |
| Monilinia oxycocci | 1910.3 | 1176 | 288 | 75 | 78 | 0.171 | 0.00122 | 0.278 | 2 | 99.91 | 1 | 6 | 1 |
| Nemania serpans | VI 05113 | 1098 | 318 | 83 | 76 | 0.192 | 0.00147 | 0.374 | 1 | 100.00 | 1 | 12 | 1 |
| Neofabraea krawtzewii | 1966-65/5 ss-2 | 1793 | 306 | 92 | 100 | 0.148 | 0.00099 | 0.231 | 1 | 100.00 | 1 | 14 | 2 |
| Neolentinus lepideus | HHB-14362 | 1633 | 356 | 84 | 94 | 0.381 | 0.0022 | 0.49 | 1 | 100.00 | 1 | 47 | 1 |
| Neonectria ditissima | 1961-67 ss1-1 | 731 | 276 | 63 | 52 | 0.182 | 0.00152 | 0.338 | 3 | 99.73 | 1 | 7 | 1 |
| Omphalotus olearius | HHB-17222 | 1663 | 435 | 80 | 96 | 0.211 | 0.0015 | 0.357 | 4 | 99.82 | 1 | 55 | 1 |
| Panellus serotinus | HHB-11719 | 1110 | 441 | 101 | 117 | 0.3599 | 0.00258 | 0.726 | 4 | 99.73 | 1 | 42 | 1 |
| Pestalotiopsis sp. | Marie7 | 778 | 366 | 73 | 59 | 0.211 | 0.0016 | 0.428 | 2 | 99.87 | 1 | 13 | 2 |
| Fuscoporia gilva | HHB-11806 | 915 | 401 | 89 | 75 | 0.195 | 0.00132 | 0.38 | 2 | 99.89 | 1 | 20 | 1 |
| Phlebia acerina | GB-0568 | 708 | 362 | 70 | 72 | 0.265 | 0.00181 | 0.486 | 2 | 99.86 | 1 | 12 | 1 |
| Pleurotus ostreatus | FP-70837 | 1322 | 424 | 123 | 106 | 0.2339 | 0.0015 | 0.398 | 1 | 100.00 | 1 | 41 | 1 |
| Plicaria endocarpoides | 1802.1 | 413 | 337 | 68 | 47 | 0.337 | 0.00325 | 0.918 | 2 | 99.76 | 1 | 10 | 1 |
| Polyporales sp. | HHB-9461 | 2021 | 386 | 90 | 116 | 0.1871 | 0.0015 | 0.324 | 8 | 99.55 | 2 | 52 | 1 |
| Polyporus brumalis | FP-102443 | 1221 | 402 | 128 | 92 | 0.191 | 0.00182 | 0.487 | 3 | 99.84 | 1 | 22 | 1 |
| Pseudallescheria boydii | VI 03873 | 1605 | 335 | 85 | 105 | 0.1882 | 0.00157 | 0.324 | 2 | 99.94 | 1 | 38 | 2 |
| Pycnopeziza sympodialis | 2404.P | 3546 | 369 | 112 | 149 | 0.136 | 0.00119 | 0.239 | 3 | 99.94 | 1 | 49 | 1 |
| Rhodotus palmatus | FP-105911 | 993 | 432 | 118 | 98 | 0.269 | 0.00198 | 0.597 | 1 | 100.00 | 1 | 30 | 1 |
| Saccharomyces cerevisiae | VI 05279 | 698 | 620 | 98 | 163 | 0.6993 | 0.00683 | 2.171 | 43 | 93.98 | 1 | 444 | 5 |
| Sarcoscyphus coccinea | 2346.P | 1522 | 334 | 109 | 146 | 0.7133 | 0.00624 | 1.324 | 1 | 100.00 | 1 | 28 | 2 |
| Schizophyllum commune | NO-7599 | 271 | 273 | 30 | 22 | 0.176 | 0.00123 | 0.302 | 1 | 100.00 | 1 | 5 | 1 |
| Sclerotinia carpii | 2195.2 | 2136 | 308 | 78 | 88 | 0.102 | 0.0007 | 0.156 | 1 | 100.00 | 1 | 10 | 1 |
| Sclerotinia tetraspora | 1993.1 | 2416 | 315 | 73 | 76 | 0.119 | 0.0011 | 0.216 | 1 | 100.00 | 1 | 22 | 2 |
| Scutellinia scutellata | 1968-138/1 | 2297 | 411 | 123 | 168 | 0.2768 | 0.00153 | 0.383 | 4 | 99.87 | 1 | 43 | 1 |
| Scytinostroma galactinum | FP-101874 | 437 | 339 | 63 | 46 | 0.216 | 0.00194 | 0.565 | 1 | 100.00 | 1 | 7 | 1 |
| Serpula himantioides | FP-97419 | 1341 | 418 | 113 | 102 | 0.2045 | 0.00179 | 0.409 | 4 | 99.78 | 1 | 39 | 1 |
| Sirococcus strobilinus | 93-298/67/2 | 1584 | 359 | 112 | 115 | 0.224 | 0.00174 | 0.426 | 1 | 100.00 | 1 | 16 | 1 |
| Sistotrema brinkmanii | HHB-7604 | 2119 | 349 | 85 | 83 | 0.122 | 0.00109 | 0.231 | 3 | 99.91 | 1 | 36 | 1 |
| Sistotremastrum suecicum | HHB-10207 | 1911 | 366 | 92 | 106 | 0.1547 | 0.00106 | 0.231 | 2 | 99.95 | 1 | 46 | 2 |
| Steccherinum laeticolor | HHB-13083 | 1747 | 369 | 97 | 118 | 0.1912 | 0.00159 | 0.355 | 4 | 99.83 | 1 | 59 | 2 |
| Stereum hirsutum | FP-91666 | 3051 | 387 | 104 | 119 | 0.1114 | 0.00071 | 0.155 | 1 | 100.00 | 1 | 44 | 1 |
| Strasseria geniculata | 1975-4 | 2019 | 330 | 120 | 139 | 0.2901 | 0.002 | 0.444 | 3 | 99.90 | 1 | 30 | 1 |
| Trametes pubescens | L-16013 | 1436 | 342 | 92 | 95 | 0.179 | 0.0015 | 0.362 | 1 | 100.00 | 1 | 32 | 1 |
| Trechispora polyporoidea | L-8920 | 2817 | 381 | 95 | 115 | 0.133 | 0.00085 | 0.189 | 2 | 99.96 | 1 | 31 | 1 |
| Trichaptum biforme | FP-50251 | 692 | 427 | 110 | 78 | 0.261 | 0.00209 | 0.64 | 3 | 99.71 | 1 | 30 | 1 |
| Trichoderma hamatum | VI 05221 | 2151 | 354 | 86 | 89 | 0.162 | 0.00146 | 0.333 | 3 | 99.91 | 1 | 19 | 1 |
| Tympanis hypopodia | 1978-433/1 | 3967 | 341 | 106 | 123 | 0.1201 | 0.00088 | 0.176 | 3 | 99.95 | 1 | 22 | 1 |
| Tyromyces chioneus | FP-103224 | 1755 | 372 | 95 | 118 | 0.2824 | 0.00276 | 0.614 | 4 | 99.83 | 1 | 35 | 1 |
| Veluticeps berkeleyi | SD-62-6-4 | 1831 | 397 | 101 | 107 | 0.178 | 0.00128 | 0.294 | 2 | 99.95 | 1 | 35 | 1 |
| Vibrissea truncorum | 3169.P | 2354 | 328 | 96 | 94 | 0.122 | 0.00083 | 0.188 | 2 | 99.96 | 1 | 16 | 1 |
| Wrightoporia cylindrospora | FP-90117 | 4212 | 400 | 113 | 171 | 0.1631 | 0.00124 | 0.227 | 4 | 99.93 | 1 | 89 | 2 |
| Zalerion arboricola | 1968-2/12 | 1890 | 320 | 78 | 88 | 0.143 | 0.00085 | 0.202 | 1 | 100.00 | 1 | 11 | 1 |
| Total: | 148046 | 9086 | 286 | 110 | 3241 | 163 |
Conflict of Interest
None declared.
References
- Altschul SF, Madden TL, Schaffer AA, Zhang J, Zhang Z, Miller W, et al. Gapped BLAST and PSI-BLAST: a new generation of protein database search programs. Nucleic Acids Res. 1997;25:3389–3402. doi: 10.1093/nar/25.17.3389. [DOI] [PMC free article] [PubMed] [Google Scholar]
- Balajee SA, Houbraken J, Verweij PE, Hong SB, Yaghuchi T, Varga J, et al. Aspergillus species identification in the clinical setting. Stud. Mycol. 2007;59:39–46. doi: 10.3114/sim.2007.59.05. [DOI] [PMC free article] [PubMed] [Google Scholar]
- Begerow D, Nilsson H, Unterseher M, Maier W. Current state and perspectives of fungal DNA barcoding and rapid identification procedures. Appl. Microbiol. Biotechnol. 2010;87:99–108. doi: 10.1007/s00253-010-2585-4. [DOI] [PubMed] [Google Scholar]
- Benson DA, Karsch-Mizrachi I, Clark K, Lipman DJ, Ostell J, Sayers EW. GenBank. Nucleic Acids Res. 2012;40:D48–D53. doi: 10.1093/nar/gkr1202. [DOI] [PMC free article] [PubMed] [Google Scholar]
- Berger L, Hyatt AD, Speare R, Daszak P, Green DE, Cunningham AA, et al. Chytridiomycosis causes amphibian mortality associated with population declines in the rain forests of Australia and Central America. Proc. Natl Acad. Sci. 1998;95:9031–9036. doi: 10.1073/pnas.95.15.9031. [DOI] [PMC free article] [PubMed] [Google Scholar]
- Blaalid R, Kumar S, Nilsson RH, Abarenkov K, Kirk P, Kauserud H. ITS1 versus ITS2 as DNA metabarcodes for fungi. Mol. Ecol. Resour. 2013;13:218–224. doi: 10.1111/1755-0998.12065. [DOI] [PubMed] [Google Scholar]
- Blackwell M. The Fungi: 1, 2, 3 …5.1 million species? Am. J. Bot. 2011;98:426–438. doi: 10.3732/ajb.1000298. [DOI] [PubMed] [Google Scholar]
- Carlsen T, Aas AB, Lindner DL, Vrålstad T, Schumacher T, Kauserud H. Don't make a mista(g)ke: is tag switching an overlooked source of error in amplicon pyrosequencing studies? Fungal Ecol. 2012;5:747–749. [Google Scholar]
- Dickie IA. Insidious effects of sequencing errors on perceived diversity in molecular surveys. New Phytol. 2010;188:916–918. doi: 10.1111/j.1469-8137.2010.03473.x. [DOI] [PubMed] [Google Scholar]
- Dover GA. Evolution of genetic redundancy for advanced players. Curr. Opin. Genet. Dev. 1993;3:902–910. doi: 10.1016/0959-437x(93)90012-e. [DOI] [PubMed] [Google Scholar]
- Elder JF, Jr, Turner BJ. Concerted evolution of repetitive DNA sequences in eukaryotes. Q. Rev. Biol. 1995;70:297–320. doi: 10.1086/419073. [DOI] [PubMed] [Google Scholar]
- Feliner GN, Larena BG, Aguilar JF. Fine-scale geographic structure, intra-individual polymorphism and recombination in nuclear ribosomal internal transcribed spacers in Armeria (Plumbaginaceae) Ann. Bot. 2004;93:189–200. doi: 10.1093/aob/mch027. [DOI] [PMC free article] [PubMed] [Google Scholar]
- Ganley ARD, Kobayashi T. Highly efficient concerted evolution in the ribosomal DNA repeats: total rDNA repeat variation revealed by whole-genome shotgun sequence data. Genome Res. 2007;17:184–191. doi: 10.1101/gr.5457707. [DOI] [PMC free article] [PubMed] [Google Scholar]
- Gardes M, Bruns TD. ITS primers with enhanced specificity for basidiomycetes – application to the identification of mycorrhizae and rusts. Mol. Ecol. 1993;2:113–118. doi: 10.1111/j.1365-294x.1993.tb00005.x. [DOI] [PubMed] [Google Scholar]
- Gazis R, Rhener S, Chaverri P. Species delimitation in fungal endophyte diversity studies and its implications in ecological and biogeographic inferences. Mol. Ecol. 2011;30:3001–3013. doi: 10.1111/j.1365-294X.2011.05110.x. [DOI] [PubMed] [Google Scholar]
- Hawksworth DL. The magnitude of fungal diversity: the 1.5 million species estimate revisited. Mycol. Res. 2001;105:1422–1432. [Google Scholar]
- Hibbett DS, Ohman A, Glotzer D, Nuhn M, Kirk P, Nilsson RH. Progress in molecular and morphological taxon discovery in Fungi and options for formal classification of environmental sequences. Fungal Biol. Rev. 2011;25:38–47. [Google Scholar]
- Horton TR. The number of nuclei in basidiospores of 63 species of ectomycorrhizal Homobasidiomycetes. Mycologia. 2006;98:233–238. doi: 10.3852/mycologia.98.2.233. [DOI] [PubMed] [Google Scholar]
- Horton TR, Bruns TD. The molecular revolution in ectomycorrhizal ecology: peeking into the black-box. Mol. Ecol. 2001;10:1855–1871. doi: 10.1046/j.0962-1083.2001.01333.x. [DOI] [PubMed] [Google Scholar]
- Huang C, Xu J, Gao W, Chen Q, Wang H, Zhang J. A reason for overlap peaks in direct sequencing of rRNA gene ITS in Pleurotus nebrodensis. FEMS Microbiol. Lett. 2010;305:14–17. doi: 10.1111/j.1574-6968.2010.01891.x. [DOI] [PubMed] [Google Scholar]
- Hughes KW, Petersen RH, Lickey EB. Using heterozygosity to estimate a percentage DNA sequence similarity for environmental species' delimitation across basidiomycete fungi. New Phytol. 2009;182:795–798. doi: 10.1111/j.1469-8137.2009.02802.x. [DOI] [PubMed] [Google Scholar]
- Hyde KD, Udayanga D, Manamgoda DS, Tedersoo L, Larsson E, Abarenkov K, et al. 2013. Incorporating molecular data in fungal systematics: a guide for aspiring researchers. arXiv:1302.3244 [q-bio.PE]
- James SA, O'Kelly MJT, Carter DM, Davey RP, Roberts A, Van Oudenaarden IN. Repetitive sequence variation and dynamics in the ribosomal DNA array of Saccharomyces cerevisiae as revealed by whole-genome resequncing. Genome Res. 2009;19:626–635. doi: 10.1101/gr.084517.108. [DOI] [PMC free article] [PubMed] [Google Scholar]
- Kårén O, Högberg N, Dahlberg A, Jonsson L, Nylund J. Inter- and intraspecific variation in the ITS region of rDNA of ectomycorrhizal fungi in Fennoscandia as detected by endonuclease analysis. New Phytol. 1997;136:313–325. [Google Scholar]
- Katoh K, Toh H. Recent developments in the MAFFT multiple sequence alignment program. Brief. Bioinform. 2008;9:286–298. doi: 10.1093/bib/bbn013. [DOI] [PubMed] [Google Scholar]
- Kauserud H, Schumacher T. Population structure of the endangered wood decay fungus Phellinus nigrolimitatus (Basidiomycota) Can. J. Bot. 2002;80:597–606. [Google Scholar]
- Liao D. Concerted evolution: molecular mechanism and biological implications. Am. J. Hum. Genet. 1999;64:24–30. doi: 10.1086/302221. [DOI] [PMC free article] [PubMed] [Google Scholar]
- Librado P, Rozas J. DnaSP v5: a software for comprehensive analysis of DNA polymorphism data. Bioinformatics. 2009;25:1451–1452. doi: 10.1093/bioinformatics/btp187. [DOI] [PubMed] [Google Scholar]
- Lindner DL, Banik MT. Intragenomic variation in the ITS rDNA region obscures phylogenetic relationships and inflates estimates of operational taxonomic units in genus Laetiporus. Mycologia. 2011;103:731–740. doi: 10.3852/10-331. [DOI] [PubMed] [Google Scholar]
- Maleszka R, Clark-Walker GD. Magnification of the rDNA cluster in Kluyveromyces lactis. Mol. Gen. Genet. 1990;223:342–344. doi: 10.1007/BF00265074. [DOI] [PubMed] [Google Scholar]
- Margulies M, Egholm M, Altman WE, Attiya S, Bader JS, Bemben LA, et al. Genome sequencing in microfabricated high-density picolitre reactors. Nature. 2005;437:376–380. doi: 10.1038/nature03959. [DOI] [PMC free article] [PubMed] [Google Scholar]
- Murray MG, Thompson WF. Rapid isolation of high molecular weight plant DNA. Nucleic Acids Res. 1980;8:4321–4326. doi: 10.1093/nar/8.19.4321. [DOI] [PMC free article] [PubMed] [Google Scholar]
- Nilsson RH, Kristiansson E, Ryberg M, Hallenberg N, Larsson KH. Intraspecific ITS variability in the kingdom Fungi as expressed in the international sequence databases and its implications for molecular species identification. Evol. Bioinf. 2008;4:193–201. doi: 10.4137/ebo.s653. [DOI] [PMC free article] [PubMed] [Google Scholar]
- Peay KG, Kennedy PG, Bruns TD. Fungal community ecology: a hybrid beast with a molecular master. Bioscience. 2008;58:799–810. [Google Scholar]
- Quince C, Lanzen A, Davenport RJ, Turnbaugh PJ. Removing noise from pyrosequenced amplicons. BMC Bioinformatics. 2011;12:38. doi: 10.1186/1471-2105-12-38. [DOI] [PMC free article] [PubMed] [Google Scholar]
- Rehner SA, Buckley E. A Beauveria phylogeny inferred from nuclear ITS and EF1-alpha sequences: evidence for cryptic diversification and links to Cordyceps teleomorphs. Mycologia. 2005;97:84–98. doi: 10.3852/mycologia.97.1.84. [DOI] [PubMed] [Google Scholar]
- Rojas EI, Rehner SA, Samuels GJ, Herre SA, Van Bael EA, Cannon P, et al. Colletotrichum gloeosporioides s.l. associated with Theobroma cacao and other plants in Panama: multilocus phylogenies distinguish host-associated pathogens from asymptomatic endophytes. Mycologia. 2010;102:1318–1338. doi: 10.3852/09-244. [DOI] [PubMed] [Google Scholar]
- Schloegel LM, Toledo LF, Longcore JE, Greenspan SE, Vieira CA, Lee M, et al. Novel, panzootic and hybrid genotypes of amphibian chytridiomycosis associated with the bullfrog trade. Mol. Ecol. 2012;21:5162–5177. doi: 10.1111/j.1365-294X.2012.05710.x. [DOI] [PubMed] [Google Scholar]
- Schmit JP, Mueller GM. An estimate of the lower limit of global fungal diversity. Biodivers. Conserv. 2007;16:99–111. [Google Scholar]
- Schoch CL, Seifert KA, Huhndorf S, Robert V, Spouge JL, Levesque CA, et al. Fungal Barcoding Consortium Nuclear ribosomal internal transcribed spacer (ITS) region as a universal DNA barcode marker for Fungi. Proc. Natl Acad. Sci. USA. 2012;109:6241–6246. doi: 10.1073/pnas.1117018109. [DOI] [PMC free article] [PubMed] [Google Scholar]
- Simon UK, Weiss M. Intragenomic variation of fungal ribosomal genes is higher than previously thought. Mol. Biol. Evol. 2008;25:2251–2254. doi: 10.1093/molbev/msn188. [DOI] [PubMed] [Google Scholar]
- Stewart FJ, Cavanaugh CM. Intragenomic variation and evolution of the internal transcribed spacer of the rRNA operon in bacteria. J. Mol. Evol. 2007;65:44–67. doi: 10.1007/s00239-006-0235-3. [DOI] [PubMed] [Google Scholar]
- Tamura K, Dudley J, Nei M, Kumar S. MEGA4: molecular Evolutionary Genetics Analysis (MEGA) software version 4.0. Mol. Biol. Evol. 2007;24:1596–1599. doi: 10.1093/molbev/msm092. [DOI] [PubMed] [Google Scholar]
- Vydryakova GA, Van DT, Shoukouhi P, Psurtseva NV, Bissett J. Intergenomic and intragenomic ITS sequence heterogeneity in Neonothopanus nambi (Agaricales) from Vietnam. Mycology. 2012;3:89–99. [Google Scholar]
- White TJ, Bruns T, Lee S, Taylor J. Amplification and direct sequencing of fungal ribosomal RNA genes for phylogenetics. In: Innis M, Gelfand DH, Sninsky JJ, White TJ, editors. PCR protocols. A guide to methods and applications. San Diego: California: Academic Press; 1990. pp. 315–322. [Google Scholar]
- Wörheide G, Nichols SA, Goldberg J. Intragenomic variation of the rDNA internal transcribed spacers in sponges (Phylum Porifera): implications for phylogenetic studies. Mol. Phylogenet. Evol. 2004;33:816–830. doi: 10.1016/j.ympev.2004.07.005. [DOI] [PubMed] [Google Scholar]