

Abstract
Objectives
To assess the incremental value of MRI and cerebrospinal fluid (CSF) analysis after a short memory test for predicting progression to Alzheimer's disease from a pragmatic clinical perspective.
Design
Diagnostic accuracy study in a multicentre prospective cohort study.
Setting
Alzheimer Disease Neuroimaging Initiative participants with complete data on neuropsychological assessment, MRI of the brain and CSF analysis.
Participants
Patients with mild cognitive impairment (MCI; n=181) were included. Mean follow-up was 38.9 months (range 5.5–75.9).
Main outcome measures
Diagnostic accuracy of individual instruments and incremental value of entorhinal cortex volume on MRI and p-τ/Aβ ration in CSF after administration of Rey's Auditory Verbal Learning Memory Test are calculated and expressed as the ‘Net Reclassification Improvement’ (NRI), which is the change in the percentage of individuals that are correctly diagnosed as Alzheimer or non-Alzheimer case.
Results
Tested in isolation, a short memory test, MRI and CSF all substantially contribute to the differentiation of those MCI patients who remain stable during follow-up from those who progress to develop Alzheimer's disease. The memory test, MRI and CSF improved the diagnostic classification by 21% (95% CI 15.1 to 26.9), 22.1% (95% CI 16.1 to 28.1) and 18.8% (95% CI 13.1 to 24.5), respectively. After administration of a short memory test, however, the NRI of MRI is +1.1% (95% CI 0.1 to 3.9) and of CSF is −2.2% (95% CI −5.6 to −0.6).
Conclusions
After administration of a brief test of memory, MRI or CSF do not substantially affect diagnostic accuracy for predicting progression to Alzheimer's disease in patients with MCI. The NRI is an intuitive and easy to interpret measure for evaluation of potential added value of new diagnostic instruments in daily clinical practice.
Keywords: diagnostic accuracy, Alzheimer, Mild cognitive impairment, Net reclassification improvement
Article summary.
Article focus
Although often applied in practice, it is not well known to what extent MRI and cerebrospinal fluid (CSF) analysis improve diagnostic accuracy.
Reports on diagnostic accuracy of MRI or CSF-analysis in dementia in general do not approach the topic from a pragmatic clinical perspective; the hierarchy of diagnostic information in everyday practice is ignored, importantly limiting the validity of the results for clinical practice.
An improvement in diagnostic accuracy when adding a new test is often reported as area under the receiver-operator characteristics curve, which is hard to interpret; the Net Reclassification Improvement (NRI) is an attractive and easy to interpret measure for clinicians.
Key messages
After the administration of a brief test of memory, MRI or CSF does not substantially affect diagnostic accuracy for Alzheimer's disease in patients with mild cognitive impairment.
The NRI is an intuitive and easy to use measure that takes false-positive and false-negative findings into account when assessing added value of a new diagnostic instrument, thus increasing clinical applicability.
Strengths and limitations of this study
Major strengths are the well characterised and relatively large sample size and the innovative methodological approach from a radically pragmatic clinical perspective using the NRI.
Limitations are the selected population in ADNI, reducing the external validity of the results, and a certain degree of incorporation bias affecting the diagnostic accuracy of the memory test.
Introduction
Cognitive complaints are common in elderly populations and cognitive impairment and dementia are consistently rated among the top concerns by older persons.1 A timely and accurate diagnosis is important in patients presenting with cognitive complaints. A reliable diagnosis of Alzheimer's disease (AD) provides a sound basis for counselling, planning of care and initiating symptomatic treatment. Similarly, the exclusion of AD in participants with memory complaints will offer immense relief and it may invite a search for other conditions that sometimes can be treated effectively, such as depression. MRI and cerebrospinal fluid (CSF) biomarkers have been advocated as diagnostic measures for diagnosing or excluding AD.2 3
Studies comparing the discriminative power of diagnostic measures usually rely on statistical analyses that implicitly treat all potential predictors equally and in parallel, for example, by feeding data on all potential new diagnostic instruments into multivariate statistical models.4–7 This approach, however, does not reflect clinical reality very well. Also, other frequently used indices such as ORs or HRs from multivariate models or an area under the curve (AUC) as derived from a receiver-operator characteristics (ROC) curve have little intuitive appeal for physicians. Moreover, clinically relevant and statistically significant associations may not increase the AUC, rendering this measure to be less suitable for the evaluation of improvement of prediction models.8 9
In everyday clinical reality, the order and hierarchy of diagnostic information is pivotal. Some information will be readily available during a first appointment, such as findings on brief cognitive testing in patients with suspected dementia. Other tests, however, will require to schedule new appointments and may be burdensome, invasive (eg, lumbar puncture), costly (eg, MRI) or both (eg, Positron Emission Tomography (PET)). Both clinical dogma and the societal perspective on costs encourage a diagnostic strategy that combines a high yield with low burden and costs.
The aim of the present study was to assess the incremental value of MRI and CSF biomarker analysis after the administration of a simple memory test in the differential diagnosis of patients with MCI. We aim to simulate the clinical reality of the consultation room as best as possible by first establishing diagnostic accuracy for a simple memory test as can be easily applied in daily practice. To quantify the performance of test additions, we use the Net Reclassification Improvement (NRI).i The NRI is simply the change in the percentage of individuals correctly diagnosed (as AD or non-AD, in this study) on the basis of any investigation that is added to the diagnostic information, that is, already available.9 10
Methods
Design and subjects
This is a case–control study within a prospective cohort study to evaluate the incremental value of MRI and CSF-analysis after a brief memory-test. We evaluate the diagnostic test accuracy of these instruments to diagnose which patients with mild cognitive impairment (MCI) will progress to develop AD within several years. Data are obtained from the Alzheimer’s Disease Neuroimaging Initiative (ADNI) database (http://www.loni.ucla.edu/ADNI; accessed 28 March 2013), a public–private partnership that was launched in 2003 by the National Institute on Aging, the National Institute of Biomedical Imaging and Bioengineering, the Food and Drug Administration, private pharmaceutical companies and non-profit organisations. ADNI has the objective to investigate the role of serial MRI, PET, CSF and clinical and neuropsychological assessment in the measurement of the progression of MCI and early AD (see also http://www.adni-info.org).
We used data on individuals diagnosed with MCI of whom complete data on memory, MRI and CSF test results were available. At baseline, the diagnosis of MCI was based on the Petersen et al's criteria,11 that is, memory complaints corroborated by an abnormal score on the delayed paragraph recall subtest of the Wechsler Memory Scale—Revised, a normal Mini Mental Status Examination score (>23), a Clinical Dementia Rating score of 0.5 and not satisfying consensus criteria for dementia. Participants who used drugs with anticholinergic or narcotic properties were excluded, but the use of a stable dose of cholinesterase inhibitors was allowed. Details on inclusion and exclusion criteria have been published before.11 12
We analysed the diagnostic yield of different tests to differentiate between participants with MCI at baseline who remained stable (N=100) and participants who progressed to AD during follow-up (N=81). Mean follow-up of patients was 38.9 months (5.5–75.9).
Diagnostic tests
We based our analyses on the three most commonly used diagnostic instruments in cognitive impairment: memory tests, MRI and CSF. From the neuropsychological battery obtained in ADNI, we selected immediate recall of Rey's Auditory Verbal Learning Test (RAVLT) as memory test for the following reasons: (1) RAVLT results were not used in ADNI for defining diagnostic groups (in order to avoid circularity). (2) Immediate recall of RAVLT is easy to administer in routine clinical practice. (3) The RAVLT had one of the largest effect sizes in our previous analysis on differential diagnostic test characteristics in different age groups performed in the same dataset.13
Structural MRI scans (1.5 T) have been obtained using a standardised protocol described elsewhere and processed using voxel-based morphometry.14 We selected entorhinal cortex volume (part of the medial temporal lobe) as the best discriminating MRI measure, based on the same previous analysis, which was recently confirmed by others.5 13 Since an earlier study did not find significant differences between left and right volumes, we used the mean of left and right.15
CSF analysis of Aβ and phosphorylated τ (p-τ) in ADNI has been specified previously.16 17 We selected one of the CSF-marker profiles (p-τ/Aβ) that was previously shown to distinguish well between AD and controls and patients with MCI who remain stable versus those who progress to AD.4 13
We have followed the STARD guidelines for the reporting of diagnostic test accuracy studies. Data on the study design, participants and diagnostic test procedures provided by ADNI were of sufficient quality to allow for a diagnostic test accuracy study.18
Statistical analyses
All test variables were corrected for age, sex and education based on regression weights in the control group as previously described.13
For each of the three diagnostic measures (RAVLT, entorhinal cortex volume on MRI and p-τ/Aβ in CSF), we then calculated the ROC curves and the respective AUCs. Based on these curves, we selected the cut-off values with the highest value for the combined sensitivity and specificity as a proxy for the optimal cut-off value (Youden index).
First, we performed univariate Cox regression analyses with the time to diagnosis of dementia as the dependent variable, and RAVLT, entorhinal cortex volume on MRI and p-τ/Aβ in CSF as covariates, dichotomised at the optimal cut-off values. In the multivariate analysis, we first entered the RAVLT. We then added entorhinal cortex volume on MRI and p-τ/Aβ in CSF using a stepwise forward procedure in order to determine the effect of each variable on the overall performance of the model. We performed the same analyses with RAVLT, entorhinal cortex volume on MRI and p-τ/Aβ in CSF as continuous variables.
Since many clinicians find HR from Cox models difficult to interpret and translate into daily practice decisions, we subsequently did the analysis from a clinician's perspective. The percentage of participants with the disease (MCI who progressed to AD) reflects the a priori chance of correct classification, without application of any diagnostic test. Next, the performance of the memory test, MRI and CSF measures were assessed with the NRI which gives the proportion of participants correctly (re-)classified as either control or case. Finally, we recalculated the NRI values for the MRI entorhinal cortex volume and CSF p-τ/Aβ ratio following the classification by the RAVLT. All analyses were carried out with PASW V.18.0.
Results
Characteristics of the study sample are specified in table 1. Cognitive impairment in the patients was mild, as expected in an MCI population. Using the Cox regression analysis as a conventional way of analysis, the dichotomised score on the RAVLT, entorhinal cortex volume on MRI and CSF p-τ/amyloid ratio, significantly predicted progression to AD (table 2). When entorhinal cortex volume and CSF were added to the model with only the RAVLT, the model significantly improved in its ability of predicting progression to AD (χ² 14.2, df 1, p<0.001 for MRI and χ² 9.1, df 1, p=0.003 for CSF). When using the continuous variables, these results were attenuated and not significant for CSF (χ²10.6, df 1, p=0.003 for MRI and χ² 2.6, df 1, p=0.11 for CSF).
Table 1.
Patient characteristics
| Characteristic | MCI-stable N=100 |
MCI-progression N=81 |
|---|---|---|
| Age (years) | 74.1 (7.6) | 74.4 (7.4) |
| Sex (F) (%) | 32 | 38.3 |
| Education (years) | 15.9 (3.0) | 15.6 (3.0) |
| MMSE | 27.2 (1.7) | 26.6 (1.8) |
Percentage or mean (SD).
MCI, mild cognitive impairment; MMSE, Mini Mental Status Examination.
Table 2.
Performance of the Cox regression models with the three diagnostic instruments as dichotomised variables (univariate model) and the performance of the models in which entorhinal cortex volume on MRI and p-τ/Aβ ratio in CSF were added to the model after performance on the RAVLT (multivariate models)
| Diagnostic instrument | HR | 95% CI | p Value | Improvement of the model |
|---|---|---|---|---|
| Univariate model | ||||
| RAVLT | 4.9 | 2.5 to 9.5 | <0.001 | |
| MRI | 2.8 | 1.8 to 4.4 | <0.001 | |
| CSF | 2.9 | 1.7 to 5.2 | <0.001 | |
| Multivariate model | ||||
| RAVLT+MRI | χ2 14.2, 1 df, p=0.001 | |||
| RAVLT | 4.2 | 2.2 to 8.3 | <0.001 | |
| MRI | 2.4 | 1.5 to 3.7 | <0.001 | |
| RAVLT+CSF | χ² 9.1, 1 df, p=0.003 | |||
| RAVLT | 4.1 | 2.1 to 8.0 | <0.001 | |
| CSF | 2.3 | 1.3 to 4.0 | 0.005 | |
CSF, cerebrospinal fluid; RAVLT, Rey's Auditory Verbal Learning Test.
We subsequently did the analysis using the NRI. Figure 1 shows the ROC curves for the three diagnostic measures. The resulting AUCs and overlapping CIs of the three diagnostic tests illustrate that their performance was largely comparable (table 3).
Figure 1.
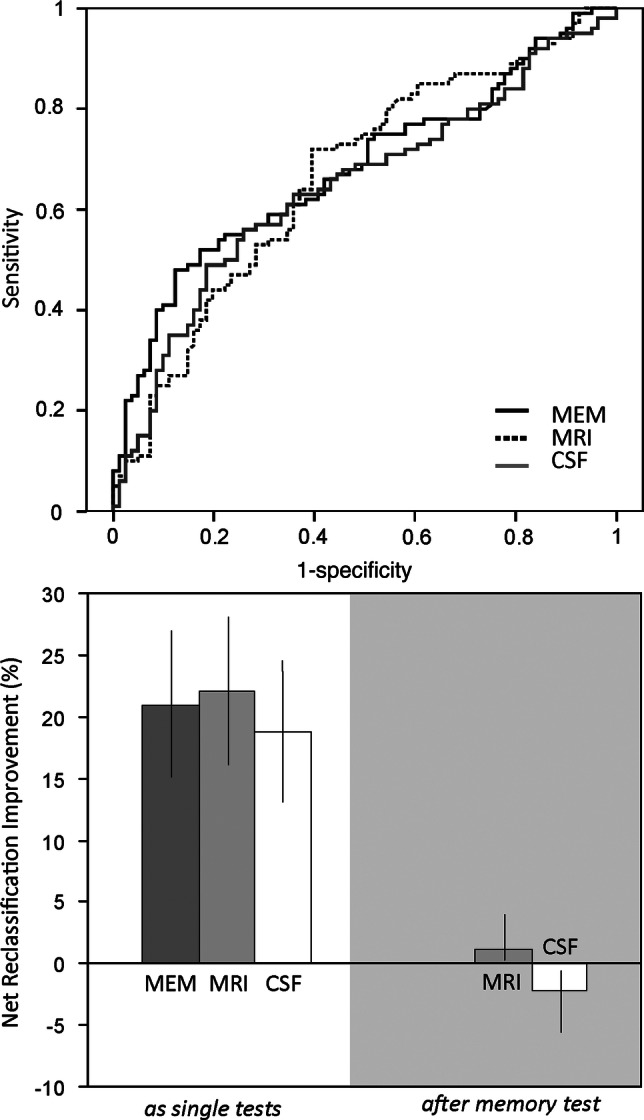
Receiver-operator characteristic-curves (ROC; upper panel) and Net Reclassification Improvements (lower panel) of Rey's Auditory Verbal Learning memory test (RAVLT), entorhinal cortex volume on MRI and p-τ/Aβ ration in cerebrospinal fluid (CSF) in participants with mild cognitive impairment (MCI). The upper panel depicts the ROC curves for the RAVLT test of memory (MEM), entorhinal cortex volumetry (MRI) and the p-τ/Aβ ratio in CSF contrasting MCI participants without progression to dementia on follow up (N=100) and those progression to Alzheimer's disease (N=81). The corresponding area under curves are provided in table 2. The lower panel shows the net reclassification improvement for the same comparisons as a result of performing a single test (left) or on the right, in the grey area, for the MRI and CSF examination, after having incorporated the result of memory testing.
Table 3.
Area under the curves (AUC) of receiver-operator characteristics curves
| Stable MCI (n=100) vs MCI participants progressing to AD (n=81) |
||
|---|---|---|
| AUC | Absolute cut-off value | |
| Memory testing with RAVLT (words) | 0.680 (0.603–0.757) | 34.59 |
| MRI entorhinal cortex volumetry (ml) | 0.666 (0.587–745) | 0.41 |
| CSF p-τ/Aβ ratio | 0.646 (0.566–0.727) | 0.079 |
AD, Alzheimer's disease; CSF, cerebrospinal fluid; MCI, mild cognitive impairment; RAVLT, Rey's Auditory Verbal Learning test.
To calculate the NRIs, the a priori correct classification rates were based on the percentage of participants with the disease for each comparison (table 4). When the NRI for all diagnostic measures is calculated in isolation, all diagnostic tests substantially improve diagnostic classification (table 4). Participants who were incorrectly reclassified to the wrong diagnostic category are taken into account by this method, thus specifying the resulting false-positive and false-negative cases following a diagnostic test.
Table 4.
Results of memory testing, neuroimaging and CSF investigations
| Participants with stable MCI vs MCI participants progressing to AD Prior probability of correct classification, before any testing: 44.8%* | |||||||
|---|---|---|---|---|---|---|---|
| MCI stable n=100 |
MCI progression n=81 |
||||||
| True negative | False positive | True positive | False negative | Posterior probability (%) | NRI (%) | 95% CI NRI | |
| Memory testing with RAVLT | 48 | 52 | 71 | 10 | 65.7 | 21.0 | 15.1 to 26.9 |
| MRI entorhinal cortex volumetry | 72 | 28 | 49 | 32 | 66.9 | 22.1 | 16.1 to 28.1 |
| CSF p-τ/Aβ ratio | 49 | 51 | 66 | 15 | 63.5 | 18.8 | 13.1 to 24.5 |
*The prior probability of correct classification is calculated assuming that all participants progress from mild cognitive impairment (MCI) to AD.
AD, Alzheimer's disease; CSF, cerebrospinal fluid; NRI, net reclassification improvement.
If the same analyses are repeated after first incorporating the RAVLT results, the contributions of entorhinal cortex volume on MRI and p-τ/Aβ ratio in CSF testing to diagnostic accuracy change dramatically (right panel of figure 1): MRI hardly affects diagnostic accuracy (NRI after MRI is +1.1 (95% CI 0.1 to 3.9), while CSF testing tends to actually decrease diagnostic accuracy in this study population as a result of reclassification to the wrong diagnostic category (NRI after CSF biomarker testing is –2.2 (95% CI−5.6 to −0.6). In figure 2, we illustrate this process for reclassification according to MRI and CSF results. MRI often results in false-negative conclusions, that is, in patients who do have AD entorhinal cortex volumes are in the normal range. CSF analysis on the other hand, often elicits false-positive findings.
Figure 2.

Reclassification and Net Reclassification Improvement (NRI) of participants as no progression to Alzheimer's disease (AD) or progression to AD after a basic memory test (Rey's Auditory Verbal Learning memory test) followed by MRI (A) or cerebrospinal fluid (B) Illustration of the effects of memory testing and subsequent MRI on diagnostic classification of a group of 181 participants belonging either to a group of stable MCI patients (blue, N=100) or patients with MCI who progressed to AD during follow-up (red, N=81). For reasons of typographical clarity not all possible changes of diagnostic category are delineated.
Explorative analyses using alternative cut-off points for all the three diagnostic tests did not importantly change our findings on the relative strengths of the resulting NRIs, as can be expected since more sensitive cut-offs by definition lead to reduced specificities and vice versa. As expected on the basis of the relative strength of associations between neuroimaging and CSF parameters in the ADNI dataset,13 19 the use of other MRI parameters (eg, hippocampal atrophy) or CSF measures (total-τ or Aβ levels or the total-τ/Aβ-ratio) did also not importantly affect the results.
Discussion
When considered as single tests, a short memory test, MRI and CSF biomarker analysis all perform at a comparable level, independent of the statistical analysis used. All three diagnostic instruments have AUCs around 0.65 for distinguishing which patients with MCI will progress to AD with an average follow-up of 39 months. However, when MRI and CSF testing are evaluated after incorporating the results of a brief test of memory, both diagnostic methods fail to substantially improve diagnostic accuracy when assessed from a clinician's perspective using the intuitive NRI.
Implications for clinical practice and research
Different diagnostic guidelines from both Europe and the USA recommend that all patients with cognitive impairment should undergo structural imaging.20 European guidelines for the diagnosis of AD identify alterations of Aβ and p-τ in CSF as supportive for the diagnosis.21 The recently revised recommendations from the National Institute on Aging-Alzheimer's Association workgroup add some nuance and do not advocate the use of CSF biomarkers for routine diagnostic purposes.22 The present findings suggest that from a pragmatic perspective, neither MRI nor CSF-analysis does importantly increase diagnostic accuracy for progression to AD in MCI patients, if a brief test of memory is administered first. From a societal perspective, this may have important implications, for example, with respect to referral patterns in uncomplicated cases. The role of neuroimaging using CT or MRI does remain undisputed in selected patients with suspected cerebrovascular damage and to rule out surgically treatable conditions, which account for up to 1% of all cases of dementia.23 24 Similarly, CSF analysis remains valuable in the occasional patient with an atypical clinical presentation of cognitive impairments who is suspected of (meningo-) encephalitis or prion disease.
Our analysis from a pragmatic clinical point of view does not warrant any conclusion concerning the value of MRI or CSF-analysis for research into disease mechanisms in dementia. Test characteristics of these CSF biomarkers are very different in older persons compared with younger persons.13 25 The better CSF test characteristics in early-onset AD may point to a potentially useful indication for CSF analysis in patients with young-onset dementia. Future studies will learn if neuroimaging and CSF studies will live up to the expectations concerning their potential roles in prognostication of disease course or as valid surrogate endpoints in clinical trials of new therapies. However, in general, the effect of biomarker assessments in subsequent studies and daily practice tends to be lower than in the initial reports fuelling current recommendations.2 26
Evaluation of new diagnostic instruments
Gluud and Gluud27 have made a plea for diagnostic test research that investigates if patients really fare better with a new test, after the test characterises of a new diagnostic method have been established. Whereas new drugs are evaluated in the context of available drugs, new diagnostic instruments are frequently evaluated in isolation. Data as presented here that specify how new information affects the diagnostic accuracy based on clinical information from other sources can be a first step towards a more rigorous evaluation of new diagnostic methods. Based on the present findings, it is not very likely that randomisation to a diagnostic routine including MRI and CSF examination will offer important benefits compared with diagnostic evaluation without these measurements in future studies.
Strengths and limitations
A major strength of our study is that it combines data on clinical characteristics, neuroimaging and CSF biomarkers from a cohort of older persons who were all examined in the same way according to a well-defined protocol. The results of the use of different statistical techniques show largely the same results. In the Cox model, the addition of the entorhinal cortex volume significantly improved the model after incorporating the RAVLT results first, whereas in the NRI the added value of the MRI was negligible, suggesting that smaller entorhinal cortex volume on MRI does contribute significantly to the prediction how soon an MCI patient progresses to AD, but not much to the cumulative probability of progression to AD after the complete observation period, that is, 39 months on average in this study. For CSF, the added value was less clear, since the model using the continuous variables did not significantly improve after adding CSF to the RAVLT results. Although the ADNI database is probably the best prospective dataset currently available in dementia research, it has some important limitations. Owing to its focus on the diagnosis of AD, participants with depression, cerebrovascular disease, major psychiatric disease and alcohol or substance abuse have been excluded while these conditions are certainly relevant to the differential diagnosis in clinical practice.28 This selection limits the external validity of the present results. In daily practice, the single test of immediate recall as used in the present analysis will often be insufficient and a more comprehensive examination of affect and cognition will be required in patients representing a broader spectrum of differential diagnoses.23 Although the average follow-up of 38.9 months in the MCI group is considerable, progression to AD can still occur after an even longer time-interval. The current hypothesis that CSF changes long precede cognitive impairment could have led to an underestimation of the predictive value of CSF biomarkers, although the predictive value of CSF many years before dementia onset has not been documented to date in patients visiting memory clinics.29 30 The amyloid cascade hypothesis holds that AD starts with amyloid deposition decades before dementia symptoms appear.31 This process is revealed by low CSF Aβ concentrations and high signal in Aβ scanning with PET. Next, progressive neuronal cell death results in elevated CSF τ concentrations, and in decreased medial temporal lobe (MTL) function and MTL atrophy at neuroimaging. Only in this stage of the process, cognitive impairments are presumed to arise. Given that cognitive symptoms are used to classify people as MCI patients, and given that only part of all MCI cases are due to AD, one would expect that CSF and neuroimaging variables were the better predictors of conversion from MCI to AD, which apparently is not the case in this population.
Another important caveat of the present analysis is that the NRI treats false-positive and false-negative results equally. Depending on the clinical setting, a more sensitive test (also implying more false-positive results) or a highly specific test (with more false-negative findings) may be preferred. The present analysis does, however, provide proof of the general principle that in patients with cognitive complaints, cheap and relatively simple clinical examinations can importantly reduce the incremental value of subsequent invasive, burdensome, expensive and time-consuming technical investigations.
An important concern is the possible circularity in the logic of the presented comparison of diagnostic techniques. Special care was taken that the specific clinical test that was evaluated here, the RAVLT, did not play any role in the final diagnostic classification that was used as gold standard in ADNI. However, a certain degree of incorporation bias is inevitable since participants in ADNI were selected on having an amnestic disorder. Moreover, in the ADNI cohort exclusion of patients with cerebrovascular disease, space-occupying lesions, evidence of infections or other signs of systemic disease may also have affected the interpretation of MRI and CSF test results. These limitations indicate that the findings of the present analysis should be rigorously tested in the clinical setting of a regular memory clinic.27
Conclusions and future directions
The present results highlight the importance of the order of tests in evaluating individuals with cognitive complaints. After administration of a brief test of memory, MRI or CSF does not substantially improve diagnostic accuracy in patients with MCI. Clinical guidelines for the timely diagnosis of AD have much to gain from considering the incremental value of new tests added to the existing instruments that are widely used, cheap and associated with a low burden for patients. Ultimately, it may stimulate a more individualised approach in the diagnostic evaluation of older persons with cognitive complaints. Independent studies on the diagnostic value and cost-effectiveness of an individualised diagnostic approach in more diverse cohorts with cognitive complaints are warranted.
Supplementary Material
Contributors: ER and WAvG have carried out all statistical analyses. ER and WAvG have drafted the manuscript. BAS has contributed to the statistical analyses. ER, BAS, PE and WAvG are responsible for the intellectual content. BAS and PE have critically revised the manuscript. All authors had full access to the data and can take responsibility for the integrity of the data and the accuracy of the data analysis. ER is the guarantor of the study. The paper was prepared according to the STARD criteria for diagnostic research papers. All authors have read and approved the final manuscript.
Funding: No specific funding was obtained for the preparation of this manuscript. Data collection and sharing for this project was funded by the Alzheimer's Disease Neuroimaging Initiative (ADNI) (National Institutes of Health Grant U01 AG024904). ADNI is funded by the National Institute on Aging, the National Institute of Biomedical Imaging and Bioengineering, and through generous contributions from the following: Abbott; Alzheimer's Association; Alzheimer's Drug Discovery Foundation; Amorfix Life Sciences Ltd.; AstraZeneca; Bayer HealthCare; BioClinica, Inc; Biogen Idec Inc; Bristol-Myers Squibb Company; Eisai Inc; Elan Pharmaceuticals Inc; Eli Lilly and Company; F. Hoffmann-La Roche Ltd and its affiliated company Genentech, Inc; GE Healthcare; Innogenetics, N.V.; Janssen Alzheimer Immunotherapy Research & Development, LLC.; Johnson & Johnson Pharmaceutical Research & Development LLC.; Medpace, Inc; Merck & Co., Inc; Meso Scale Diagnostics, LLC.; Novartis Pharmaceuticals Corporation; Pfizer Inc; Servier; Synarc Inc; and Takeda Pharmaceutical Company. The Canadian Institutes of Health Research is providing funds to support ADNI clinical sites in Canada. Private sector contributions are facilitated by the Foundation for the National Institutes of Health (http://www.fnih.org). The grantee organisation is the Northern California Institute for Research and Education, and the study is coordinated by the Rev August 16 2011 Alzheimer's Disease Cooperative Study at the University of California, San Diego. ADNI data are disseminated by the Laboratory for Neuro Imaging at the University of California, Los Angeles. This research was also supported by NIH grants P30 AG010129, K01 AG030514, and the Dana Foundation.
Competing interests: None.
Patient consent: Obtained.
Provenance and peer review: Not commissioned; externally peer reviewed.
Data sharing statement: The dataset of ADNI is freely available to scientific researchers under the conditions of ADNI at http://www.loni.ucla.edu/ADNI. Participants gave informed consent, data are anonymised and risk of identification is minimal.
Sometimes also referred to as ‘Net Reclassification Index’.
References
- 1.Chertkow H. Diagnosis and treatment of dementia: introduction. Introducing a series based on the Third Canadian Consensus Conference on the Diagnosis and Treatment of Dementia. CMAJ 2008;178:316–21 [DOI] [PMC free article] [PubMed] [Google Scholar]
- 2.Dubois B, Feldman HH, Jacova C, et al. Research criteria for the diagnosis of Alzheimer's disease: revising the NINCDS-ADRDA criteria. Lancet Neurol 2007;6:734–46 [DOI] [PubMed] [Google Scholar]
- 3.Dubois B, Feldman HH, Jacova C, et al. Revising the definition of Alzheimer's disease: a new lexicon. Lancet Neurol 2010;9:1118–27 [DOI] [PubMed] [Google Scholar]
- 4.Cui Y, Liu B, Luo S, et al. Identification of conversion from mild cognitive impairment to Alzheimer’'s disease using multivariate predictors. PLoS ONE 2011;6:e21896. [DOI] [PMC free article] [PubMed] [Google Scholar]
- 5.Ewers M, Walsh C, Trojanowski JQ, et al. Prediction of conversion from mild cognitive impairment to Alzheimer's disease dementia based upon biomarkers and neuropsychological test performance. Neurobiol Aging 2012;33:1203–14 [DOI] [PMC free article] [PubMed] [Google Scholar]
- 6.Heister D, Brewer JB, Magda S, et al. Predicting MCI outcome with clinically available MRI and CSF biomarkers. Neurology 2011;77:1619–28 [DOI] [PMC free article] [PubMed] [Google Scholar]
- 7.Mattsson N, Zetterberg H, Hansson O, et al. CSF biomarkers and incipient Alzheimer disease in patients with mild cognitive impairment. JAMA 2009;302:385–93 [DOI] [PubMed] [Google Scholar]
- 8.Greenland P, O'Malley PG. When is a new prediction marker useful? A consideration of lipoprotein-associated phospholipase A2 and C-reactive protein for stroke risk. Arch Intern Med 2005;165:2454–6 [DOI] [PubMed] [Google Scholar]
- 9.Pencina MJ, D'Agostino RB, Sr, D'Agostino RB, Jr, et al. Evaluating the added predictive ability of a new marker: from area under the ROC curve to reclassification and beyond. Stat Med 2008;27:157–72 [DOI] [PubMed] [Google Scholar]
- 10.Cook NR. Statistical evaluation of prognostic versus diagnostic models: beyond the ROC curve. Clin Chem 2008;54:17–23 [DOI] [PubMed] [Google Scholar]
- 11.Petersen RC, Aisen PS, Beckett LA, et al. Alzheimer's Disease Neuroimaging Initiative (ADNI): clinical characterization. Neurology 2010;74:201–9 [DOI] [PMC free article] [PubMed] [Google Scholar]
- 12.2012. http://www.adni-info.org.
- 13.Schmand B, Eikelenboom P, Van Gool WA. Value of neuropsychological tests, neuroimaging, and biomarkers for diagnosing Alzheimer's disease in younger and older age cohorts. J Am Geriatr Soc 2011;59:1705–10 [DOI] [PubMed] [Google Scholar]
- 14.Jack CR, Jr, Bernstein MA, Fox NC, et al. The Alzheimer's Disease Neuroimaging Initiative (ADNI): MRI methods. J Magn Reson Imaging 2008;27:685–91 [DOI] [PMC free article] [PubMed] [Google Scholar]
- 15.Walhovd KB, Fjell AM, Brewer J, et al. Combining MR imaging, positron-emission tomography, and CSF biomarkers in the diagnosis and prognosis of Alzheimer disease. AJNR Am J Neuroradiol 2010;31:347–54 [DOI] [PMC free article] [PubMed] [Google Scholar]
- 16.Shaw LM, Vanderstichele H, Knapik-Czajka M, et al. Cerebrospinal fluid biomarker signature in Alzheimer's disease neuroimaging initiative subjects. Ann Neurol 2009;65:403–13 [DOI] [PMC free article] [PubMed] [Google Scholar]
- 17.Trojanowski JQ, Vandeerstichele H, Korecka M, et al. Update on the biomarker core of the Alzheimer's Disease Neuroimaging Initiative subjects. Alzheimers Dement 2010;6:230–8 [DOI] [PMC free article] [PubMed] [Google Scholar]
- 18.Bossuyt PM, Reitsma JB, Bruns DE, et al. Towards complete and accurate reporting of studies of diagnostic accuracy: the STARD initiative. BMJ 2003;326:41–4 [DOI] [PMC free article] [PubMed] [Google Scholar]
- 19.Schmand B, Eikelenboom P, Van Gool WA. Value of diagnostic tests to predict conversion to Alzheimer's disease in young and old patients with amnestic mild cognitive impairment. J Alzheimers Dis 2012;29:641–8 [DOI] [PubMed] [Google Scholar]
- 20.Schott JM, Warren JD, Barkhof F, et al. Suspected early dementia. BMJ 2011;343:d5568. [DOI] [PMC free article] [PubMed] [Google Scholar]
- 21.Hort J, O'Brien JT, Gainotti G, et al. EFNS guidelines for the diagnosis and management of Alzheimer's disease. Eur J Neurol 2010;17:1236–48 [DOI] [PubMed] [Google Scholar]
- 22.McKhann GM, Knopman DS, Chertkow H, et al. The diagnosis of dementia due to Alzheimer's disease: recommendations from the National Institute on Aging-Alzheimer's Association workgroups on diagnostic guidelines for Alzheimer's disease. Alzheimers Dement 2011;7:263–9 [DOI] [PMC free article] [PubMed] [Google Scholar]
- 23.Feldman HH, Jacova C, Robillard A, et al. Diagnosis and treatment of dementia: 2. Diagnosis. CMAJ 2008;178:825–36 [DOI] [PMC free article] [PubMed] [Google Scholar]
- 24.Scheltens P, Fox N, Barkhof F, et al. Structural magnetic resonance imaging in the practical assessment of dementia: beyond exclusion. Lancet Neurol 2002;1:13–21 [DOI] [PubMed] [Google Scholar]
- 25.Bouwman FH, Schoonenboom NS, Verwey NA, et al. CSF biomarker levels in early and late onset Alzheimer's disease. Neurobiol Aging 2009;30:1895–901 [DOI] [PubMed] [Google Scholar]
- 26.Ioannidis JP, Panagiotou OA. Comparison of effect sizes associated with biomarkers reported in highly cited individual articles and in subsequent meta-analyses. JAMA 2011;305:2200–10 [DOI] [PubMed] [Google Scholar]
- 27.Gluud C, Gluud LL. Evidence based diagnostics. BMJ 2005;330:724–6 [DOI] [PMC free article] [PubMed] [Google Scholar]
- 28.2012. http://adni.loni.ucla.edu/wp-content/uploads/2010/09/ADNI_GeneralProceduresManual.pdf.
- 29.Schmand B, Huizenga HM, Van Gool WA. Meta-analysis of CSF and MRI biomarkers for detecting preclinical Alzheimer's disease. Psychol Med 2010;40:135–45 [DOI] [PubMed] [Google Scholar]
- 30.Sperling RA, Aisen PS, Beckett LA, et al. Toward defining the preclinical stages of Alzheimer's disease: recommendations from the National Institute on Aging-Alzheimer's Association workgroups on diagnostic guidelines for Alzheimer's disease. Alzheimers Dement 2011;7:280–92 [DOI] [PMC free article] [PubMed] [Google Scholar]
- 31.Jack CR, Jr, Knopman DS, Jagust WJ, et al. Tracking pathophysiological processes in Alzheimer's disease: an updated hypothetical model of dynamic biomarkers. Lancet Neurol 2013;12:207–16 [DOI] [PMC free article] [PubMed] [Google Scholar]
Associated Data
This section collects any data citations, data availability statements, or supplementary materials included in this article.