

Abstract
The concentration of chemicals inside the bacterial cytoplasm generates an osmotic pressure, termed turgor, which inflates the cell and is necessary for cell growth and survival. In Escherichia coli, a sudden increase in external concentration causes a pressure drop across the cell envelope that drives changes in cell shape, such as plasmolysis, where the inner and outer membranes separate. Here, we use fluorescence imaging of single cells during hyperosmotic shock with a time resolution on the order of seconds to examine the response of cells to a range of different conditions. We show that shock using an outer-membrane impermeable solute results in total cell volume reduction with no plasmolysis, whereas a shock caused by outer-membrane permeable ions causes plasmolysis immediately upon shock. Slowly permeable solutes, such as sucrose, which cross the membrane in minutes, cause plasmolysis to occur gradually as the chemical potential equilibrates. In addition, we quantify the detailed morphological changes to cell shape during osmotic shock. Nonplasmolyzed cells shrink in length with an additional lateral size reduction as the magnitude of the shock increases. Quickly plasmolyzing cells shrink largely at the poles, whereas gradually plasmolyzing cells invaginate along the cell cylinder. Our results give a comprehensive picture of the initial response of E. coli to hyperosmotic shock and offer explanations for seemingly opposing results that have been reported previously.
Introduction
The Escherichia coli cell envelope is responsible for chemically isolating the cell interior from the surrounding environment and consists of the outer membrane, the periplasmic space that contains the cell wall, and the inner membrane. Each of these elements contributes to the overall permeability of the cell to different solutes. A host of inner and outer membrane-proteins facilitate the passage of ions and molecules across the two lipid bilayers, greatly increasing their permeability. Note that here we use the term membrane permeability to represent the passage of solutes through the combined lipid-protein sheet. The cell wall in the periplasm consists of porous peptidoglycan chains, although the periplasm itself is thought to be a packed physical environment.
Escherichia coli cells actively regulate their internal osmolality to maintain a favorable turgor pressure. Ordinarily, the concentration of solutes within the cytoplasm is higher than the environment resulting in a positive pressure on the cell wall. An increase in external solute concentration, termed hyperosmotic shock, causes fast water efflux and a pressure drop across the semipermeable cell envelope. This results in altered cell size, cell shape, and membrane stress levels. Proteins responsible for the detection of the internal osmolality changes as well as subsequent recovery, such as ProP, TrkA, KdpA, and BetT, presumably respond to one or more of these morphological parameters. Some of these sensors localize at specific places along the cell surface, such as the cell poles, whereas others form a more diffuse pattern (1). It is therefore of considerable interest for understanding their specific roles in osmorecovery to compare these localization patterns with the localized morphological changes, which occur upon osmotic shock. Here, we use quantitative image analysis of the E. coli periplasmic and cytoplasmic spaces to investigate cell shape and size changes during shocks of different magnitudes and compositions and find that the kinetics of membrane permeability plays a significant role in defining the shocked state.
The response of bacteria to osmotic shock has been studied for decades (2–16). However, the methods used in these experiments vary considerably, particularly in time resolution (typically 30 s up to 15 min) and the number of conditions investigated (12,14,16,17). In addition, morphological changes have largely been discussed in qualitative and binary terms, e.g., when investigating plasmolysis, a process in which the inner membrane detaches from the cell wall. This work has therefore led to an incomplete, and at points contradictory, set of conclusions. In particular, the role that solute membrane permeability plays in defining the dynamics of cell shape change has been difficult to elucidate.
What is clear from previous work is that shape change does not solely depend on the magnitude of a shock. Hyperosmotic shock produced using solutes such as pentose or sodium polyglutamate that cannot penetrate the outer and inner membranes cause both the cytoplasmic and periplasmic volumes to shrink extensively, up to 60%, without noticeable plasmolysis (16,18). On the other hand, plasmolysis does occur when using solutes that can easily penetrate the outer membrane as the periplasm and external environment quickly equilibrate tonicity (2,3,5,7,8,11,19–21). A large number of solutes fall somewhere between these two extremes and penetrate the inner and outer membranes on slow timescales. Two solutes that are commonly used to increase the external concentration in osmotic shock experiments, sodium chloride and sucrose, have been reported to exhibit very different membrane permeation kinetics. Sodium chloride is relatively fast and crosses the outer membrane on the order of seconds, whereas sucrose equilibration proceeds on the order of minutes (5). Thus, it is not a surprise that the studies of the initial response with limited time resolution using these two solutes have led to seemingly contradictory observations.
Materials and Methods
Bacterial strains
Escherichia coli strain YD133 (ΔFimA, ΔFliC, ΔFlgE derived from the K12 Keio collection strain) with plasmid pWR20 (carrying enhanced green fluorescent protein, EGFP, and kanamycin resistance) was grown from frozen stocks as described previously (22) to an optical density (OD) of 0.5. Upon reaching the required OD, cells were kept at room temperature and used for sample preparation for up to 3.5 h (up to a maximum OD of 0.85).
Sample preparation
For cytoplasmic and total cell volume measurements, cells were prepared as previously described (22). Microscope coverslips were assembled into tunnel slides and both cells and microspheres were immobilized on the glass coverslip surface (22,23).
Microscopy
Cells were observed in epifluorescence and differential interference contrast using a modified Nikon TE2000 microscope as described previously (22,24). To stabilize the sample during the measurements, the position of a microsphere attached to the coverslip surface was kept fixed in the x-, y-, and z-directions using proportional-integral-derivative feedback of the stage position (22,23) and back focal plane interferometry (25,26). Images were acquired 1 Hz for sucrose shocks and 0.5 Hz for dextran and sodium chloride shocks. Trans- and epiillumination light was shuttered in between image recordings to reduce photobleaching of the GFP.
Hyperosmotic shock
To change the osmolality of the external environment in the tunnel slide, LB is exchanged with 10 mM Tris-HCl (pH = 7.5) with defined concentrations of sodium chloride, sucrose, or dextran (Mw = 1000). Osmolalities of solutions were calibrated with an osmometer (Osmomat30, Genotec, Germany).
Data analysis
A small rectangle around each analyzed cell is chosen and the cell long axis is aligned horizontally with the image axis. A record of volume, length, and width (derived from the red, outer membrane dye signal) and cytoplasmic cell volume, length, and width (derived from the green GFP signal) were obtained by a process of background subtraction and thresholding we previously described (22). Briefly, after initial alignment and background subtraction the pixels above a certain threshold were identified and a mask of cell area obtained (22). The total cell length and width, and cytoplasmic length and width correspond to the length and width of the cell along the cell midline. The length of the cell along three pixel columns aligned with the cell axis was averaged to obtain the total cell and cytoplasmic lengths. Similarly, the length of three rows in the middle of the cell was averaged to obtain the total cell and cytoplasmic width (Fig. S1 A in the Supporting Material). To obtain the total cell volume and cytoplasmic volume the cell was assumed to be rotationally symmetric along the long axis. We recorded the width as a function of distance along the cell axis. The volume for each pixel along the length of the cell was calculated based on this width profile (see also Fig. S1) and summed to obtain the record of the total cell and cytoplasmic volume.
The resultant records were aligned at the time of osmotic shock and normalized by dividing the entire trace with the average value of volume, length, or width calculated using the first 5 s of recording that occur before osmotic shock. The average and standard deviation trace was then computed from these normalized and aligned data sets. For osmolality changes induced with sodium chloride, the FM4-64 dye bleaches significantly within ∼90 s after shock, depending on the cell. Thus, the data sets showing cytoplasmic cell volume, length, and width for high sodium chloride shocks contains more cells then the data sets showing total cell volume, length, and width (where the smaller data set is part of the larger).
Polar kymographs were calculated from cytoplasmic and total cell fluorescent images. Cytoplasmic area changes were normalized by subtracting the initial from each subsequent frame. For periplasmic area, both the cytoplasmic and total cell areas were normalized as previously mentioned, and then cytoplasmic subtracted from the total cell area. Cytoplasmic and periplasmic area changes where then converted into polar coordinates, where we define the polar extent to be the distance from the center of the cell (defined as half a distance between minimum and maximum value of the cell boundary in x and y) to the edge of the cell. Initial alignment of cells along the long axis did not take into account possible postshock morphological asymmetries, thus the polar extent in [π, 2π] interval was added to that of the [0, π] interval.
Results
Quantifying changes in volume
To obtain a record of total and cytoplasmic cell volume changes during the initial response of E. coli to hyperosmotic shock, we simultaneously monitored a cytoplasmicly-expressed GFP and fluorescent outer membrane dye, as described previously (22). We kept the observed field of view fixed in a three-dimensional position (22) and used a sampling rate of either 0.5 or 1 Hz. To isolate the initial response from the recovery, we induced the hyperosmotic shock by transferring the cells from the growth medium (Material and Methods section) to 10 mM Tris-HCl buffer supplemented with a given amount of dextran, sucrose, or sodium chloride. Fig. 1 shows the example traces from individual cells shocked with three different solutes. The fluorescent images of the outer membrane and cytoplasm prior and upon hyperosmotic shock as well as the corresponding time traces of the total and cytoplasmic length, width, and volume in response to a dextran (Fig. 1 A), sucrose (Fig. 1, B and C), and sodium chloride (Fig. 1 D) hyperosmotic shock are given. To obtain a record of normalized cell length, width, and volume trace from a time sequence of fluorescent images, we used a previously reported process of background subtraction and thresholding ((22), see also Materials and Methods).
Figure 1.
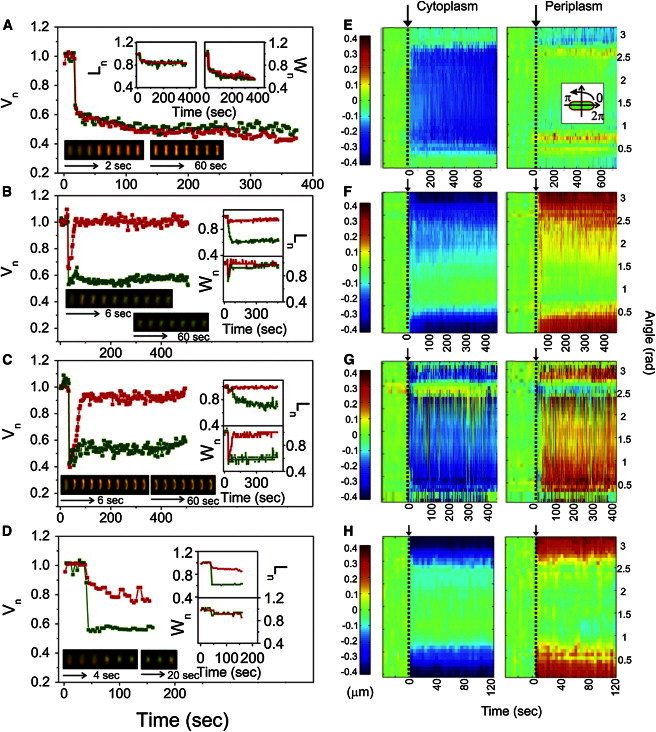
Initial response to hyperosmotic shock depends on the solute used to change the external concentration. (A–D) Total and cytoplasmic cell volume versus time. Insets top and right: total and cytoplasmic cell length and width versus time. Total cell volume, length, and width are given in red online and dark gray in print, and cytoplasmic cell volume, length, and width in green online and light gray in print. A cell is transferred from LB into 10 mM Tris-HCl buffer supplemented with 0.95 Osmol/kg dextran (A), 1.89 Osmol/kg sucrose (B), 2.5 Osmol/kg sucrose (C), and 2.08 Osmol/kg NaCl (D). Inset bottom: An overlay of fluorescent images (EGFP and FM4-64) of E. coli cells prior and during the shock. All images were acquired at a frame every 1 s in (B and C) and every 2 s in (A and D) alternating between the cytoplasmic volume and total cell volume. However, only select images of those acquired are shown in two time sequences. Images in the first sequence are 2 (A), 4 (D), and 6 (B and C) s apart. In the second sequence images are 20 (D) and 60 (A–C) s apart. Image brightness was adjusted due to photobleaching and the difference in fluorescence intensity between the FM4-64 and EGFP. Movies are given in the Supporting Material, Movies S1–S4. (E–H): Polar kymographs, obtained as described in Materials and Methods, of cytoplasmic and periplasmic polar extent changes for each of the cells in (A–D). The cell alignment is shown in the inset (E), the polar extent at the cell poles is plotted at 0 and π rad. At π/2 is the polar extent at the middle of the cell. Color scale on the left is in μm and applies to all panels.
Fig. 1, E–H, shows polar kymographs of changes in the polar extent of the cytoplasmic and periplasmic spaces before, during, and after osmotic shock for each of the example cells in Fig. 1, A–D. We used polar kymographs as a way of displaying morphological changes throughout the cell. The periplasmic polar extent kymographs are useful to show the occurrence of plasmolysis, the periplasmic space increases where detachment of inner and outer membrane (with the cell wall) occurs. To obtain the kymographs each cell was aligned with the long axis horizontally and converted to polar coordinates (inset of Fig. 1 E and Materials and Methods), such that changes in length translate into the changes in polar extent at angle π, and changes in the middle of the cell to changes in polar extent at angle π/2.
Initial response to an outer-membrane impermeable solute
To gain detailed information about morphological changes in E. coli cells upon a hyperosmotic shock caused by an outer and inner membrane impermeable solute, we looked at the effect of shocks of different magnitudes caused by dextran (5). Fig. 2 shows an averaged response of a population of E. coli cells upon transition from LB into 10 mM Tris-HCl buffer with different dextran concentrations: 0.11, 0.42, 0.95, and 1.5 Osmol/kg. The smallest dextran concentration used, 0.11 Osmol/kg, is hyposmotic. As a result, the total and cytoplasmic volumes expand by a few percent when shocked with this concentration. When the osmolyte cannot penetrate the outer membrane, the total cell volume and cytoplasmic cell volume both decrease in unison upon hyperosmotic shock. The extent of the total and cytoplasmic cell volume, length, and width decrease is plotted against the magnitude of the shock in Fig. 3. The cell volume increases with magnitude of the dextran hyperosmotic shock, up to ∼40% total volume reduction for the largest shocks (Fig. 3 A). For small hyperosmotic shocks cell’s cytoplasm shrinks in length (up to 10%) with hardly any reduction in width (Fig. 3 C). As the magnitude of the shock increases a further reduction is achieved by predominantly decreasing the width of the cell (Fig. 3, B and C).
Figure 2.
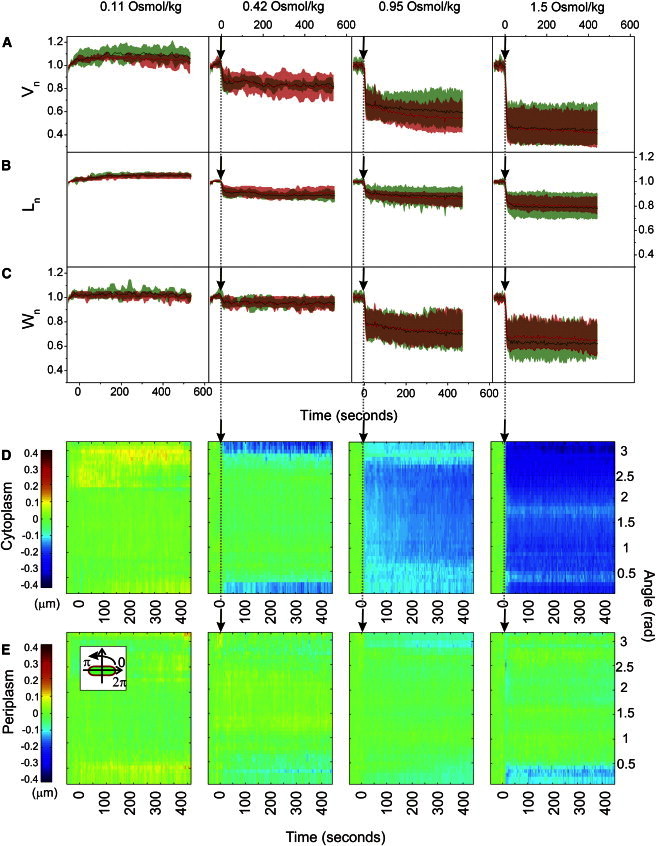
Initial response to an osmotic shock caused by an inner and outer-membrane impermeable solute. (A) Averaged total and cytoplasmic volume, (B) length, and (C) width traces in time during dextran shocks of different magnitudes (Vn(t), Ln(t), Wn(t)). Data points are recorded at 0.5 Hz frame rate alternating between the total cell and the cytoplasm. For each cell at a given shock magnitude, the traces were normalized by the initial value and aligned at the time of the shock. The average traces and standard deviations were computed from these normalized and aligned data sets. (D) Polar kymograph, obtained as described in Materials and Methods, of cytoplasmic and (E) periplasmic polar extent changes during dextran osmotic shocks of different magnitudes. Changes in cytoplasmic and periplasmic polar extent at different angles are shown for a given point in time. The cell alignment is shown in the inset (E). The polar extent at the poles is plotted at 0 and π rad. The polar extent at the middle of the cell is at π/2. Color scale on the left is in μm and applies to all panels. The following numbers of cells are included in different conditions: 0.11 Osmol/kg dextran (N = 8), 0.42 Osmol/kg dextran (N = 7), 0.95 Osmol/kg dextran (N = 17), 1.5 Osmol/kg dextran (N = 11).
Figure 3.
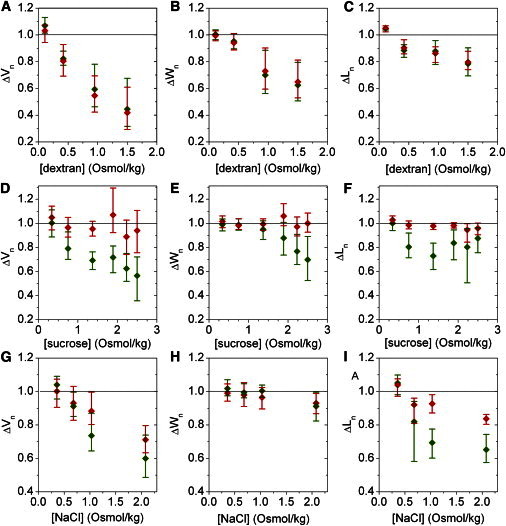
Morphological changes in response to the shock magnitude of a given solute. (A–C) Volume, width, and polar extent change in response to dextran, (D–F) sucrose, and (G–I) sodium-chloride hyperosmotic shocks of different magnitude. Data corresponding to the last 5 s of the cell volume, width, and length traces for the shock of a given magnitude, and caused by a given solute, were averaged. Total cell volume, width, and length are given in red online and dark gray in print, and cytoplasmic volume, width, and length in green online and light gray in print. Standard deviations of the mean are shown for all data points.
Fig. 2, D and E, show polar kymographs of average changes in the polar extent of the cytoplasmic and periplasmic spaces before, during, and after osmotic shock, as the shock magnitude increases from left to right. No increase in periplasmic polar extent for an inner and outer-membrane impermeable solute is visible. Plasmolysis does not occur regardless of the shock magnitude.
Initial response to a slowly permeable solute
Previous studies of E. coli’s response to changes in external osmolality have frequently used sucrose. However, for a given sucrose concentration, there have been reports that observe plasmolysis (16) and those that do not (13,14). Methods employed to study changes in cell volume vary in time resolution and particularly in their ability to access the events immediately upon the hyperosmotic shock, spanning from 15 s after the shock to ∼15 min (2,5,10,12,16). Often the time between the shock and commencement of measurements is not precisely determined and it might even vary within the scope of one study (4,9,13,14). Plasmolysis was reported to take ∼5 min to complete (12) and sucrose uptake through the outer membrane has been measured to last ∼1 min (16). The delay between shock and periplasmic equilibration could explain the different responses to hyperosmotic shock reported in the literature.
Fig. 4 shows morphological changes seen after a hyperosmotic shock induced by transferring E. coli cells from LB to 10 mM Tris-HCl with a range of different sucrose concentrations: 0.34, 0.75, 1.37, 1.89, 2.23, and 2.5 Osmol/kg, respectively. As before, the smallest sucrose concentration used, 0.34 Osmol/kg, was chosen to be less than the osmolarity of LB. All the other sucrose concentrations caused a hyperosmotic shock (Fig. 4 A). Fig. 3, D–F, summarize the changes in total and cytoplasmic cell volume, length, and width with respect to the sucrose shock magnitude. Similar to the data in Fig. 3 A, increasing the magnitude of the shock leads to an increase in cytoplasmic volume reduction up to ∼40% (Fig. 3 D). Total cell volume does not change appreciably for a 0.75 Osmol/kg shock, decreases somewhat for 1.37 Osmol/kg shock, and changes as much as the cytoplasmic volume for shocks larger than 1.37 Osmol/kg (Fig. 4 A). However, the large reduction in total cell volume is a transient event. Within 10–100 s postshock, total cell volume expands to close its initial value, causing cell plasmolysis (Fig. 4 A). Thus, up to 0.75 Osmol/kg of sucrose penetrates the outer membrane immediately upon addition, whereas any excess requires 10 s to 2 min.
Figure 4.
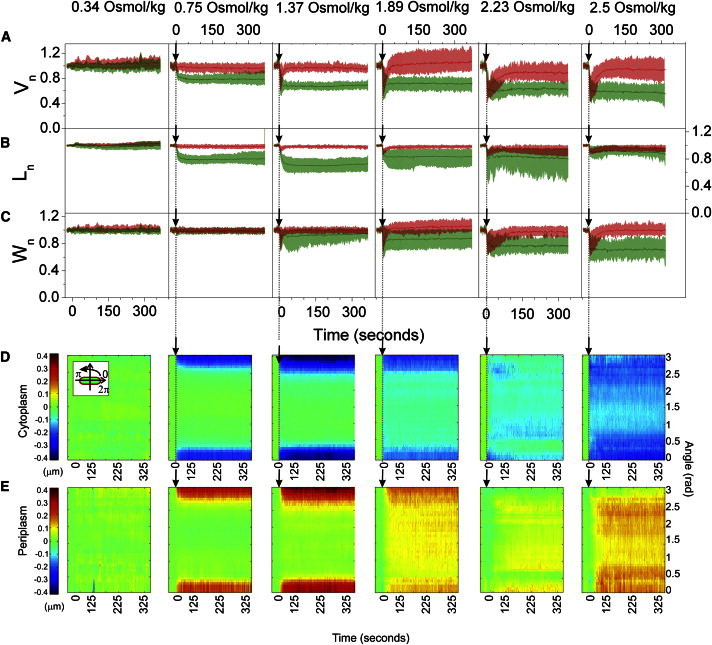
Initial response to an osmotic shock caused by a solute that penetrates the outer membrane on a minute timescale. (A) Averaged total and cytoplasmic volume, (B) length, and (C) width traces in time during sucrose shocks of different magnitudes (Vn(t), Ln(t), Wn(t)). Data points are recorded at 1 Hz frame rate alternating between the total cell and the cytoplasm. For each cell at a given shock magnitude, the traces were normalized by the initial value and aligned at the time of the shock. The average traces and standard deviations were computed from these normalized and aligned data sets. (D) Polar kymograph, obtained as described in Materials and Methods, of cytoplasmic space and (E) periplasmic space changes during sucrose osmotic shocks of different magnitudes. Changes in cytoplasmic and periplasmic polar extent at different angles are shown for a given point in time. The cell alignment is shown in the inset (E). The polar extent at the poles is plotted at 0 and π rad. The polar extent at the middle of the cell is at π/2. Color scale on the left is in μm and applies to all panels. The following numbers of cells are included in different conditions: 0.34 Osmol/kg (N = 25), 0.75 Osmol/kg (N = 33), 1.37 Osmol/kg (N = 20), 1.89 Osmol/kg sucrose (N = 20), 2.23 Osmol/kg (N = 15), 2.5 Osmol/kg sucrose (N = 16).
The cytoplasmic space decreases in length up to 40% of the initial value as the shock increases (Fig. 3 E, at 1.37 Osmol/kg sucrose). If a shock exceeds 1.37 Osmol/kg, further volume reduction occurs along the width of the cell where the length reduction decreases (Fig. 3, E and F). Polar kymographs in Fig. 4, D and E, show details of changes in cytoplasmic and periplasmic polar extent as the sucrose shock increases from left to right. A decrease in the cytoplasmic space along the poles of the cell for smaller shocks causes plasmolysis along the poles. As the shock increases plasmolysis no longer occurs on the poles but along the middle of the cell in a nonsymmetric fashion (Fig. 4 E).
Initial response to a rapidly permeable solute
Sodium chloride has been used extensively to increase the external environment concentration when studying the response of E. coli to changes in external osmolarity. To the best of our knowledge all of the reports using sodium chloride to cause hyperosmotic shock observed plasmolysis (2,3,5,7,11,18–21), with the exception of very small shocks where plasmolysis does not occur irrespective of the solute used to cause the shock (11). Most of the studies suggest that sodium chloride penetrates the outer membrane on a very short timescale (3,11,18,19,21). However, there have been reports that suggest the permeability properties of sodium chloride are more complex (11,12). To investigate the initial response of E. coli to a shock caused by a small ion, we transition the cells from LB into 10 mM Tris-HCl buffer with sodium chloride at the following concentrations: 0.36, 0.68, 1.03, and 2.08 Osmol/kg (Fig. 5). As before, a small hyposmotic shock (0.36 Osmol/kg) caused expansion of both total and cytoplasmic cell volume by a few percent. In Fig. 5 A plasmolysis is visible for all hyperosmotic shocks administered, occurring within a few seconds postshock. The maximum reduction in cytoplasmic cell volume observed is ∼40% (Fig. 3 G), as in Fig. 3, A and D. The maximum reduction in total cell volume, observed for the largest hyperosmotic shock is ∼30% (Fig. 3 G). A small total volume reduction, ∼7%, is observed for two smaller hyperosmotic shocks, indicating that the outer membrane is not fully permeable to sodium chloride even for these smaller shocks.
Figure 5.
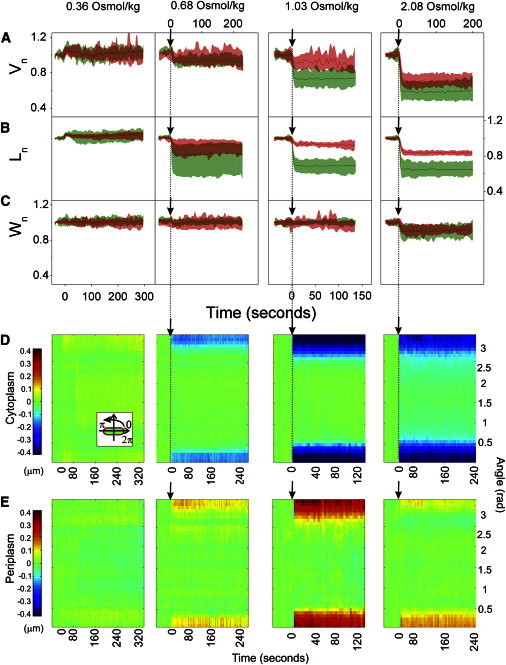
Initial response to an osmotic shock caused by an outer-membrane permeable ion. (A) Averaged total and cytoplasmic volume, (B) length, and (C) width traces in time during dextran shocks of different magnitudes (Vn(t), Ln(t), Wn(t)). Data points are recorded at 0.5 Hz frame rate alternating between the total cell and the cytoplasm. For each cell at a given shock magnitude, the traces were normalized by the initial value and aligned at the time of the shock. The average traces and standard deviations were computed from these normalized and aligned data sets. Following numbers of cells are included in different conditions: 0.36 Osmol/kg NaCl (N = 10), 0.68 Osmol/kg NaCl (cytoplasmic traces in green online and light grey in print N = 11, total cell traces in red online and dark grey in print N = 10), 1.03 Osmol/kg (cytoplasmic traces in green online and light grey in print N = 27, total cell traces in red online and dark grey in print N = 7), 2.08 Osmol/kg (cytoplasmic traces in green online and light grey in print N = 20, total cell traces in red online and dark grey in print N = 11). (D) Polar kymograph, obtained as described in Materials and Methods, of cytoplasmic space and (E) periplasmic space changes during sodium chloride osmotic shocks of different magnitudes. Changes in cytoplasmic and periplasmic polar extent at different angles are shown for a given point in time. The cell alignment is shown in the inset (E). The polar extent at the poles is plotted at 0 and π rad. The polar extent at the middle of the cell is at π/2. Color scale on the left is in μm and applies to all panels. The following numbers of cells are included in different conditions: 0.36 Osmol/kg NaCl (N = 10), 0.68 Osmol/kg NaCl (N = 10), 1.03 Osmol/kg (N = 7), 2.08 Osmol/kg (N = 11).
Discussion
We have presented a comprehensive study of the initial response of E. coli cells to hyperosmotic changes in the external environment. The morphological changes during and immediately after a hyperosmotic shock in real time on a single cell level in vivo were quantified. We found that for an outer-membrane permeable solute, plasmolysis will occur for all the shock magnitudes. We conclude that plasmolysis is a direct consequence of the solute penetrating the outer membrane and equilibrating the periplasmic space with the external environment. For solutes that do not penetrate the outer membrane, plasmolysis was not observed; total cell volume shrinks in proportion to the shock magnitude up to a 40% total volume reduction. The timing of plasmolysis occurrence reflects the permeability properties of the external solute. Small ions like sodium chloride will penetrate the outer membrane immediately, causing plasmolysis seconds after the shock. A molecule like sucrose, that requires several minutes to cross the outer membrane (16), causes a transient reduction in total cell volume followed by gradually occurring plasmolysis, presumably on the timescale of solute penetration.
Interestingly, the gradual transition of sucrose into the periplasmic space suggests that initial reduction in total cell and cytoplasmic cell volume does not result in equilibrium. Upon shock, total and cytoplasmic cell volume will decrease to equalize the chemical potential across the membranes. However, bending the cell wall to reduce the total cell volume costs mechanical energy. Immediately upon shock, therefore, the cell is in a nonequilibrium state. As the sucrose slowly enters the permiplasmic space the cell wall relaxes. The process stops when the mechanical stress is balanced by the chemical potential difference.
Our results are in agreement with all previous reports, offering an explanation of seeming discrepancies. All of the studies familiar to the authors conducted with sodium chloride as a shocking agent observed plasmolysis. In this condition, plasmolysis occurs on a very fast timescale, thus any experiment longer than a few seconds should observe it (2,3,5,7,11,18–21). On the other hand, reports that used a range of sucrose concentrations to look at the initial response obtained measurements 15 s to several minutes after the shock, finding a mixture of both plasmolysed and nonplasmolysed cells (14), or a decrease in the extent of plasmolysis for shocks higher than 400 mM sucrose (13). Given that sucrose hyperosmotic shock induced plasmolysis occurs precisely on that timescale, it is likely that they obtained measurements at random points during the process, giving the observed mixture of responses. Some of the reports that do not observe plasmolysis for both outer and inner membrane impermeable solutes propose that plasmolysis always occurs, but on a slow timescale (6). This conclusion is likely based on observations of plasmolysis with outer-membrane permeable solutes. It should be taken into account that reports that equate plasmolysis with the initial response of E. coli to a hyperosmotic shock of a large enough magnitude are misleading and likely based on a limited set of experimental data (7–9,13,17,19–21,27).
A shock with an outer-membrane impermeable solute will initially cause reduction in cell length, followed by further reduction in width, up to a total of 40% volume lost. This is in agreement with previous studies that report a flexible cell wall that exhibits stress stiffening (28).
We observed that for shocks with small molecules and ions that quickly penetrate the outer membrane, the cell cytoplasm will shrink in length causing plasmolysis along the cell poles. In contrast, solutes that slowly penetrate the outer membrane will cause more complex morphological changes, and depending on the concentration, the cell will shrink and plasmolyze predominantly in length, width, or exhibit a combination of both. There are several possible explanations for the specific shape changes we observed. The molecular mechanisms of the fast water efflux from E. coli cells are not known (22). Carbohydrate and ion transport in E. coli has been previously studied (29–31), and several sodium chloride dependant membrane transporters and channels exist (30). Although they are involved in the transport of sodium ion into the cytoplasm it is not clear to what extent they contribute to its passage into the periplasmic space during hyperosmotic shock. It is possible that the characteristic shape changes we observe are caused by the localization of membrane proteins that facilitate efflux of water or permeation of solutes into the periplasm. However, apart from the sodium chloride and small sucrose shocks, the cytoplasmic shape deformations during hyperosmotic shocks with potassium chloride also occurred along the poles (Fig. S2). Therefore, we think it is more likely that the observed shapes can be explained by the mechanical properties of the cell wall and the inner membrane and cell wall attachment. The cell poles are largely inert (32). Assuming the inner membrane is mainly linked to the cell wall through peptiodglycan synthesis and insertion proteins, it is possible that plasmolysis occurs predominantly at the poles because those are the weakest points of attachment between the inner membrane and the cell wall. Alternatively, the characteristic plasmolysis shapes could be a consequence of nucleoid arrangement, where the inner membrane collapses onto the DNA inside the cell. The poles of the cell are DNA free (33), potentially explaining the occurrence of plasmolysis along the poles. A recent report shows that the nucleoid has a large-scale coiled organization (34), which could explain constriction and subsequent occurrence of plasmolysis along the cell width. We note that these mechanisms are not exclusive and the observed cell shapes may result from multiple origins.
Finally, one study that suggests the active response to sucrose and sodium chloride increase are markedly different (15). In addition, some of the transporters involved in the active recovery to osmotic shocks can be localized (1). Localization of many others still has not been reported. The nature of different initial responses we observed could directly influence the subsequent recovery. Based on their localization, some of the transporters are less likely to be used to detect a certain type of shock (even if the increase in osmolality remains the same). The detailed characterization of the initial response has not been accessible to previous studies due to experimental limitations. In the future, we hope to extend out studies to probe the active recovery in different conditions.
Acknowledgments
We thank Yi Deng and William Ryu for supplying strains and plasmids and all members of the Shaevitz lab for valued discussions.
This research was supported by National Science Foundation CAREER award PHY-0844466, National Institutes of Health grant P50GM071508, and awards from the Alfred P. Sloan Foundation and the Pew Charitable Trusts to J.W.S.
Supporting Material
References
- 1.Romantsov T., Battle A.R., Wood J.M. Protein localization in Escherichia coli cells: comparison of the cytoplasmic membrane proteins ProP, LacY, ProW, AqpZ, MscS, and MscL. J. Bacteriol. 2010;192:912–924. doi: 10.1128/JB.00967-09. [DOI] [PMC free article] [PubMed] [Google Scholar]
- 2.Alemohammad M.M., Knowles C.J. Osmotically induced volume and turbidity changes of Escherichia coli due to salts, sucrose and glycerol, with particular reference to the rapid permeation of glycerol into the cell. J. Gen. Microbiol. 1974;82:125–142. doi: 10.1099/00221287-82-1-125. [DOI] [PubMed] [Google Scholar]
- 3.Cayley D.S., Guttman H.J., Record M.T., Jr. Biophysical characterization of changes in amounts and activity of Escherichia coli cell and compartment water and turgor pressure in response to osmotic stress. Biophys. J. 2000;78:1748–1764. doi: 10.1016/s0006-3495(00)76726-9. [DOI] [PMC free article] [PubMed] [Google Scholar]
- 4.Cota-Robles E.H. Electron microscopy of plasmolysis in Escherichia coli. J. Bacteriol. 1963;85:499–503. doi: 10.1128/jb.85.3.499-503.1963. [DOI] [PMC free article] [PubMed] [Google Scholar]
- 5.Decad G.M., Nikaido H. Outer membrane of gram-negative bacteria. XII. Molecular-sieving function of cell wall. J. Bacteriol. 1976;128:325–336. doi: 10.1128/jb.128.1.325-336.1976. [DOI] [PMC free article] [PubMed] [Google Scholar]
- 6.Koch A.L. Shrinkage of growing Escherichia coli cells by osmotic challenge. J. Bacteriol. 1984;159:919–924. doi: 10.1128/jb.159.3.919-924.1984. [DOI] [PMC free article] [PubMed] [Google Scholar]
- 7.Korber D.R., Choi A., Caldwell D.E. Bacterial plasmolysis as a physical indicator of viability. Appl. Environ. Microbiol. 1996;62:3939–3947. doi: 10.1128/aem.62.11.3939-3947.1996. [DOI] [PMC free article] [PubMed] [Google Scholar]
- 8.Mika J.T., van den Bogaart G., Poolman B. Molecular sieving properties of the cytoplasm of Escherichia coli and consequences of osmotic stress. Mol. Microbiol. 2010;77:200–207. doi: 10.1111/j.1365-2958.2010.07201.x. [DOI] [PubMed] [Google Scholar]
- 9.Mulder E., Woldringh C.L. Plasmolysis bays in Escherichia coli: are they related to development and positioning of division sites? J. Bacteriol. 1993;175:2241–2247. doi: 10.1128/jb.175.8.2241-2247.1993. [DOI] [PMC free article] [PubMed] [Google Scholar]
- 10.Olijhoek A.J., Van Eden C.G., Nanninga N. Plasmolysis during the division cycle of Escherichia coli. J. Bacteriol. 1982;152:479–484. doi: 10.1128/jb.152.1.479-484.1982. [DOI] [PMC free article] [PubMed] [Google Scholar]
- 11.Record M.T., Jr., Courtenay E.S., Guttman H.J. Responses of E. coli to osmotic stress: large changes in amounts of cytoplasmic solutes and water. Trends Biochem. Sci. 1998;23:143–148. doi: 10.1016/s0968-0004(98)01196-7. [DOI] [PubMed] [Google Scholar]
- 12.Schall B.F., Marathe G.V., Ghosh B.K. Stereological analysis of plasmolysis in logarithmic-phase Bacillus licheniformis. J. Bacteriol. 1981;146:391–397. doi: 10.1128/jb.146.1.391-397.1981. [DOI] [PMC free article] [PubMed] [Google Scholar]
- 13.Scheie P.O. Plasmolysis of Escherichia coli B-r with sucrose. J. Bacteriol. 1969;98:335–340. doi: 10.1128/jb.98.2.335-340.1969. [DOI] [PMC free article] [PubMed] [Google Scholar]
- 14.Schwarz H., Koch A.L. Phase and electron microscopic observations of osmotically induced wrinkling and the role of endocytotic vesicles in the plasmolysis of the Gram-negative cell wall. Microbiology. 1995;141:3161–3170. doi: 10.1099/13500872-141-12-3161. [DOI] [PubMed] [Google Scholar]
- 15.Shabala L., Bowman J., Shabala S. Ion transport and osmotic adjustment in Escherichia coli in response to ionic and non-ionic osmotica. Environ. Microbiol. 2009;11:137–148. doi: 10.1111/j.1462-2920.2008.01748.x. [DOI] [PubMed] [Google Scholar]
- 16.Stock J.B., Rauch B., Roseman S. Periplasmic space in Salmonella typhimurium and Escherichia coli. J. Biol. Chem. 1977;252:7850–7861. [PubMed] [Google Scholar]
- 17.Konopka M.C., Sochacki K.A., Weisshaar J.C. Cytoplasmic protein mobility in osmotically stressed Escherichia coli. J. Bacteriol. 2009;191:231–237. doi: 10.1128/JB.00536-08. [DOI] [PMC free article] [PubMed] [Google Scholar]
- 18.Koch A.L. The biophysics of the gram-negative periplasmic space. Crit. Rev. Microbiol. 1998;24:23–59. doi: 10.1080/10408419891294172. [DOI] [PubMed] [Google Scholar]
- 19.Konopka M.C., Shkel I.A., Weisshaar J.C. Crowding and confinement effects on protein diffusion in vivo. J. Bacteriol. 2006;188:6115–6123. doi: 10.1128/JB.01982-05. [DOI] [PMC free article] [PubMed] [Google Scholar]
- 20.Scheie P. Osmotic pressure in Escherichia coli as rendered detectable by lysozyme attack. J. Bacteriol. 1973;114:549–555. doi: 10.1128/jb.114.2.549-555.1973. [DOI] [PMC free article] [PubMed] [Google Scholar]
- 21.Sochacki K.A., Shkel I.A., Weisshaar J.C. Protein diffusion in the periplasm of E. coli under osmotic stress. Biophys. J. 2011;100:22–31. doi: 10.1016/j.bpj.2010.11.044. [DOI] [PMC free article] [PubMed] [Google Scholar]
- 22.Pilizota T., Shaevitz J.W. Fast, multiphase volume adaptation to hyperosmotic shock by Escherichia coli. PLoS ONE. 2012;7:e35205. doi: 10.1371/journal.pone.0035205. [DOI] [PMC free article] [PubMed] [Google Scholar]
- 23.Pilizota T., Bilyard T., Berry R.M. A programmable optical angle clamp for rotary molecular motors. Biophys. J. 2007;93:264–275. doi: 10.1529/biophysj.106.091074. [DOI] [PMC free article] [PubMed] [Google Scholar]
- 24.Wang S., Arellano-Santoyo H., Shaevitz J.W. Actin-like cytoskeleton filaments contribute to cell mechanics in bacteria. Proc. Natl. Acad. Sci. USA. 2010;107:9182–9185. doi: 10.1073/pnas.0911517107. [DOI] [PMC free article] [PubMed] [Google Scholar]
- 25.Allersma M.W., Gittes F., Schmidt C.F. Two-dimensional tracking of ncd motility by back focal plane interferometry. Biophys. J. 1998;74:1074–1085. doi: 10.1016/S0006-3495(98)74031-7. [DOI] [PMC free article] [PubMed] [Google Scholar]
- 26.Neuman K.C., Block S.M. Optical trapping. Rev. Sci. Instrum. 2004;75:2787–2809. doi: 10.1063/1.1785844. [DOI] [PMC free article] [PubMed] [Google Scholar]
- 27.Morbach S., Krämer R. Body shaping under water stress: osmosensing and osmoregulation of solute transport in bacteria. ChemBioChem. 2002;3:384–397. doi: 10.1002/1439-7633(20020503)3:5<384::AID-CBIC384>3.0.CO;2-H. [DOI] [PubMed] [Google Scholar]
- 28.Deng Y., Sun M., Shaevitz J.W. Direct measurement of cell wall stress stiffening and turgor pressure in live bacterial cells. Phys. Rev. Lett. 2011;107:158101. doi: 10.1103/PhysRevLett.107.158101. [DOI] [PubMed] [Google Scholar]
- 29.Dills S.S., Apperson A., Saier M.H., Jr. Carbohydrate transport in bacteria. Microbiol. Rev. 1980;44:385–418. doi: 10.1128/mr.44.3.385-418.1980. [DOI] [PMC free article] [PubMed] [Google Scholar]
- 30.Dimroth P. Sodium ion transport decarboxylases and other aspects of sodium ion cycling in bacteria. Microbiol. Rev. 1987;51:320–340. doi: 10.1128/mr.51.3.320-340.1987. [DOI] [PMC free article] [PubMed] [Google Scholar]
- 31.Schultz S.G., Solomon A.K. Cation transport in Escherichia coli. I. Intracellular Na and K concentrations and net cation movement. J. Gen. Physiol. 1961;45:355–369. doi: 10.1085/jgp.45.2.355. [DOI] [PMC free article] [PubMed] [Google Scholar]
- 32.Scheffers D.J., Pinho M.G. Bacterial cell wall synthesis: new insights from localization studies. Microbiol. Mol. Biol. Rev. 2005;69:585–607. doi: 10.1128/MMBR.69.4.585-607.2005. [DOI] [PMC free article] [PubMed] [Google Scholar]
- 33.Zimmerman S.B. Shape and compaction of Escherichia coli nucleoids. J. Struct. Biol. 2006;156:255–261. doi: 10.1016/j.jsb.2006.03.022. [DOI] [PubMed] [Google Scholar]
- 34.Hadizadeh Yazdi N., Guet C.C., Marko J.F. Variation of the folding and dynamics of the Escherichia coli chromosome with growth conditions. Mol. Microbiol. 2012;86:1318–1333. doi: 10.1111/mmi.12071. [DOI] [PMC free article] [PubMed] [Google Scholar]
Associated Data
This section collects any data citations, data availability statements, or supplementary materials included in this article.