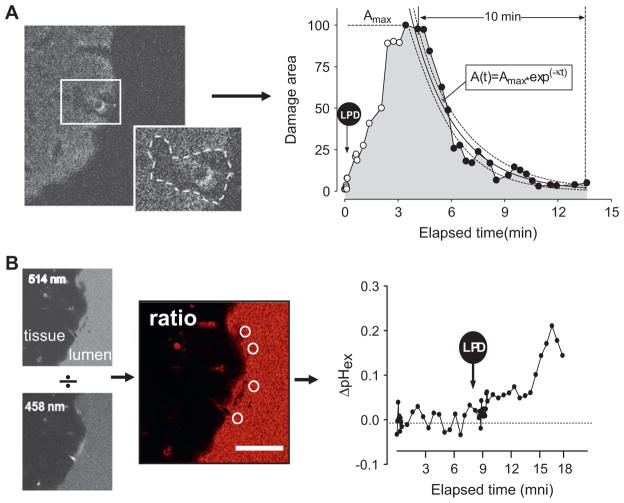
Figure 1.
Data analysis procedures during two-photon laser-induced photodamage (LPD) of the mouse gastric epithelial surface. (A) Analysis of the damaged area. Left: sample image of NAD(P)H autofluorescence collected from the mouse gastric epithelial surface ~5 min post-LPD. Autofluorescence is reduced markedly after photodamage in the region bounded by the dotted line in the insert image, and the included area is used to estimate damage size. Right: the graph shows normalised representative data points measuring the damaged area over time in a control mouse. Time of maximal damage (Tmax) and area of maximal damage (Amax) are estimated from individual data points. The rate constant of area recovery (κ, s−1) is calculated by curve fitting the data between Amax and the following 10 min (black dots in trace) to a single exponential decay equation. Dotted lines in the graph show the 95% CI on the curve fit. (B) Analysis of the extracellular pH at the gastric surface. Left: Cl-NERF added to the perfusate allows sequential collection of confocal images of juxtamucosal fluorescence at 514 and 458 nm excitation. White circles show areas used for measuring the surface pH from 514/458 ratio images. Right: the graph shows representative surface pH measurements in control mouse stomach before and after LPD (arrow). Scale bar=50 μm.

