Abstract
Obese people are known to have lower serum 25OHD levels compared to non-obese people. It is not known whether it is due to storage of vitamin D in fat, inadequate input from sunlight, diet or other unknown factors. We examined the relationship at study baseline of serum 25OHD, PTH, 1,25(OH)2D with body composition measurements using Dual energy X-ray Absorptiometry. The results showed a significant inverse relation between total body fat mass and serum 25OHD (p<0.0001) and serum 1,25(OH2)D (p=034) and an independent positive correlation between serum PTH and total body fat mass (p<0.0001). In a randomized controlled study of seven doses of vitamin D (400-4800IU/d) the increase in serum 25OHD levels was compared in women with a normal body mass index to obese women. The response to the low doses of vitamin D (400-800IU/d) was significantly less than that of the medium (1600-2400IU/d) and high doses groups (3200-4800IU) (p<0.0001) in all BMI categories. The increase in serum 25OHD in the medium and high dose groups was not significantly different with increasing level of obesity. But thinner women with a normal BMI (< 25 kg/m2) showed a much higher response to vitamin D at any dose level compared to other BMI groups. There was no significant change in total body fat mass after treatment with vitamin D or calcitriol in our randomized trials. In summary, the response to vitamin D is dependent on body weight. Women with BMI <25 kg/m2 develop much higher levels of serum 25OHD after vitamin D supplementation compared to those with BMI of >25 kg/m2. The differences in serum 25OHD levels between normal and obese women may be due to differences in volume dilution. After vitamin D supplementation, all obese women reach adequate levels of serum 25OHD but normal women (BMI<25 kg/m2) reach much higher levels of 25OHD and in this group smaller doses of vitamin D used should be used.
Keywords: Vitamin D; 25(OH) D; 1,25(OH) 2D; PTH; Obesity; Fat; Postmenopausal Women
Introduction
Many studies have shown an inverse relationship between low serum 25OHD and obesity (1, 2, 3,4). It is not clear whether this association is due to increased storage in the adipose tissue, sedentary lifestyle, low sunlight exposure, true vitamin D deficiency, genetic changes in vitamin D metabolism or other unknown factors (4, 5,6). The concept of storage of vitamin D in the adipose tissue has gained recent popularity and some studies recommend a higher intake of vitamin D in obese women, however there are no longitudinal studies to supports that suggestion. Animal studies show that the vitamin D is deposited not only in adipose tissue but also muscle, liver and skin (7,8) while data in humans is very limited (9,10). However most observational studies that examined a relationship between serum 25OHD and BMI have not measured body fat in a systematic manner.
Although there are numerous association studies between low serum 25OHD and disease such as diabetes and metabolic syndrome there is no evidence that a low serum 25OHD is clinically important because of a lack of adequate treatment trials with vitamin D. It would be helpful if there were any clinical biomarkers of vitamin D insufficiency such as secondary hyperparathyroidism in obesity. Also measurement of free serum 25OHD in obesity might be helpful.
In this study we examined the relationship between serum 25OHD, serum PTH and measurements of body composition measurements. We examined the effect of vitamin D on serum 25OHD in obese and thin individuals and we analyzed the effect of vitamin D or calcitriol and calcitriol on body fat in two intervention studies.
Methods
Study design and subject population
Study 1 (ViDOS) was a one-year randomized, double-blind placebo controlled study (ViDOS-Vitamin D supplementation in Older Subjects) of increasing doses of vitamin D3. The primary outcomes were serum 25OHD and serum PTH. The total number of women who participated in this study was 163 Caucasians, aged b 57 – 90 years. All women had vitamin D insufficiency i.e. serum 25OHD ≤ 20 ng/ml (50 nmol/L). Subjects were randomly assigned to one of 8 groups -, 400, 800, 1600, 2400, 3200, 4000 or 4800 IU of vitamin D3 per day or matching placebo. Calcium tablets contained 200mg elemental calcium (Citracal; Bayer HealthCare, Morristown, NJ) taken twice daily were given to maintain a total calcium intake between 1200-1400 mg/d based on a baseline 7-day food diary. Complete details of this study can be found in previously published primary paper (11).
In study 1(ViDOS) serum 25OHD levels and PTH levels were measured at baseline, 6 and 12 months in the Bone Metabolism laboratory Creighton University using a radioimmunoassay (Diasorin, Inc. Stillwater, MN).
Study 2 (STOP IT) was a 3-year intervention study of calcitriol 0.25mcg twice daily, conjugated estrogens 0.625mg daily, a combination of both and placebo in 488 elderly women, age 65-77 years (12). Serum 25OHD levels were measured in the Bone Metabolism laboratory Creighton University using a protein binding assay radioimmunoassay and serum. Parathyroid hormone (PTH) was measured by radioimmunoassay (Nichols).
Body composition measurement
Body composition indices (i.e. percentages of total and regional fat and fat-free mass) were measured by Dual energy X-Ray absorptiometry (DEXA Hologic Delphi). Daily quality assurance checks were performed daily using a calibration standard. The physical activity was measured by using Physical Activity Scoring (PAS) form that was filled by patients at baseline and at 12 months.
Statistical Methods and analyses
Baseline characteristics were compared among the groups by means of one-way ANOVA for continuous variables and by chi-square test for categorical variables. The variables were tested for normal distribution by using Kolmogorov-Smirnov Test. In the ViDOS study because of the inclusion criteria of serum 25OHD < 20 ng/ml, baseline 25OHD data was truncated and could not be used in correlations with body composition measures therefore we used the data from the STOP IT study that had no limitation on serum 25OHD. We used Pearson’s correlation test for the baseline analysis of STOP IT study. We used paired t-tests to look for a change in total fat and lean mass after treatment in both the studies.
In the baseline analysis we divided the study population into 4 subgroups based on their WHO classification of obesity BMI (less than 25 kg/m2, 25-29.9 kg/m2, 30-34.9 kg/m2 and 35 kg/m2 or greater, we had insufficient numbers for the extreme obesity group) and used ANOVA models to look at their body compositions measured by DXA scan.
In longitudinal studies we examined the effect of vitamin D on fat mass after one year of treatment in the ViDOS study and the effect of calcitriol on fat mass after 3 years in the STOP IT study These analyses were done using multivariate models adjusted for known confounders.
In the ViDOS study the change in serum 25OHD after vitamin D supplementation was analyzed according to BMI and vitamin D dose groups. In order to increase the numbers dose groups were divided into low (400 and 800IU/d), medium (1600 and 2400IU/d) and high (3200, 4000 and 480IU/d). The increase in serum 25OHD after 12 months of treatment was then compared it the BMI categories using the WHO definitions of obesity. To compare the response to treatment in thin and obese people we used univariate analysis. All analyses were performed using SAS analysis software. A p-value of less than 0.05 was considered as statistically significant. Multivariate mixed effects models were examined for serum 25OHD and PTH, adjusting for known covariates based on clinical experience: age, BMI category, calcium intake, 1,25 dihydroxyvitamin D, smoking status, alcohol use, average caffeine intake and serum creatinine.
Results
Study 1.Baseline analysis was performed on 163 women and the longitudinal analysis on 147 women that completed the study. There were no significant differences between the groups at baseline. Mean (±SD) age of the study group was 67 (±7.3) years and age range was 57-90 years. Mean daily intake of calcium from food and supplements was 685 (± 259) mg and mean dietary vitamin D intake was 114 (±69) IU/d. Mean BMI was 30.2 (± 5.7) kg/m2, and the range was underweight to class III obesity using the WHO classification, In 147 women the mean percentage of total body fat was 40.1% and of lean body mass was 56.4%,
Study 2 (STOP IT). Baseline analyses were performed on 488 women and longitudinal analyses on 336 women that completed the treatment study. Mean age was 71(±4) years. Mean daily intake of calcium was 742(±309) mg and mean daily vitamin D intake was 140.5 (±83.5) IU/d. The mean total BMI of the study population was 27.2 (± 4.9). The mean percentages of total body fat and lean body mass was 41.8% and 55.2%,
Baseline analyses
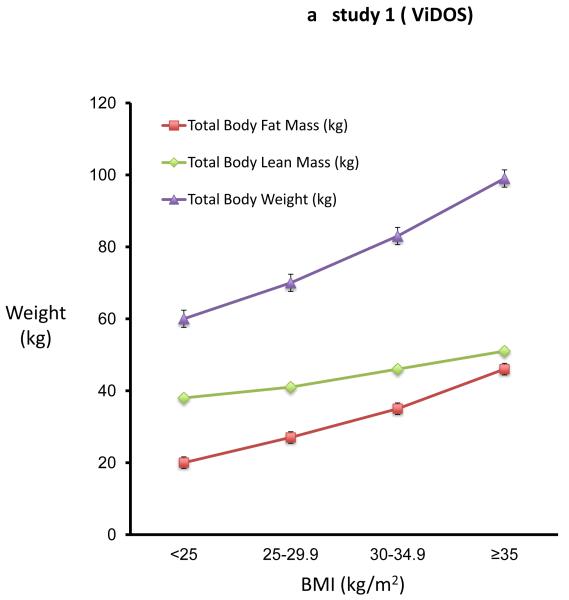
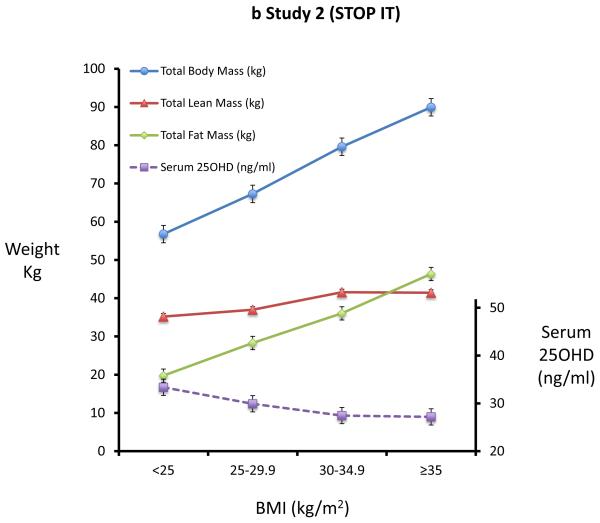
In study 1 (ViDOS) we did not use the baseline serum 25OHD data because the inclusion criterion for study restricted participants to serum 25OHD < 20ng/ml. The baseline analysis of body composition measurements in 163 elderly women results (figure 1a) was virtually identical to those in study 2 (figure 1b). Using the WHO classification of obesity, differences in body composition of fat, lean mass and BMC across four BMI groups are shown in Figures 1a and 1b. In the univariate analysis, there is a significant difference in body fat and lean mass among the four BMI groups, each group differing significantly from the other three groups. Within the normal BMI group < 25 kg/m2 the correlation between fat mass and lean body mass has the same slope as that of the obese groups. Across the WHO categories 1 to 4, weight increased by 39 kg or 65 percent, fat increased 26 kg or 130 percent and lean body mass increased by 13 kg or 34 percent. Serum 25OHD levels decrease with each BMI category (fig 1b).
Figure 1a and 1b. Body Fat increases more than body lean mass with increasing BMI.
Figure 1a shows the mean (SE) of total body weight, total body lean mass, total body fat mass in different BMI subgroups in study 1(ViDOS). Figure 1b shows the mean (SE) total body weight, total body lean mass, total body fat mass and serum 25OHD in different BMI subgroups of study 2(STOPIT).
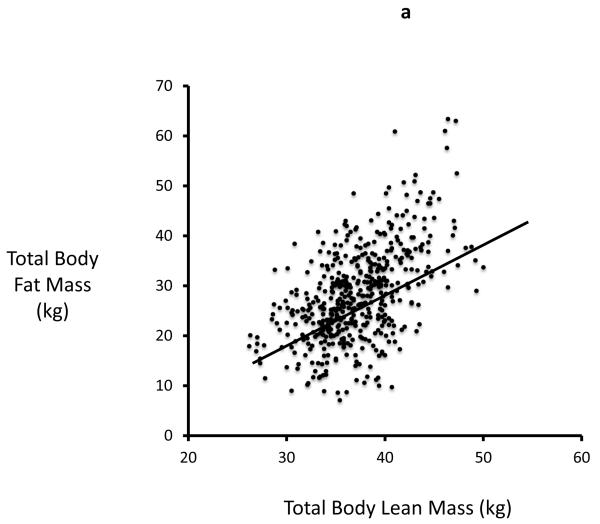
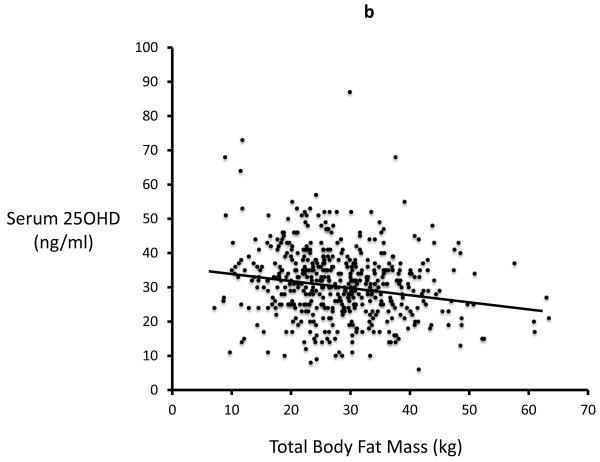
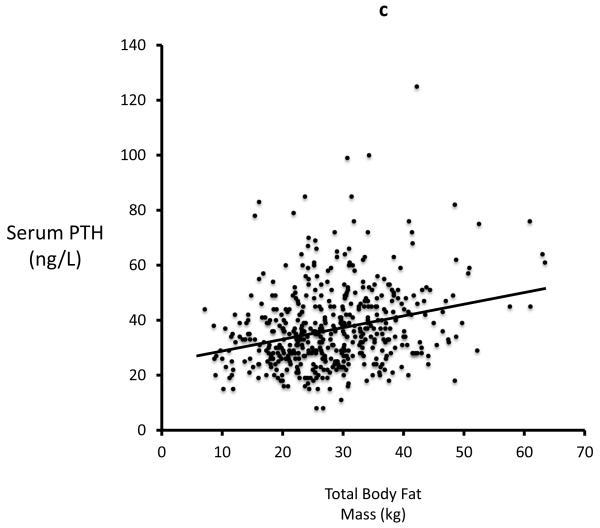
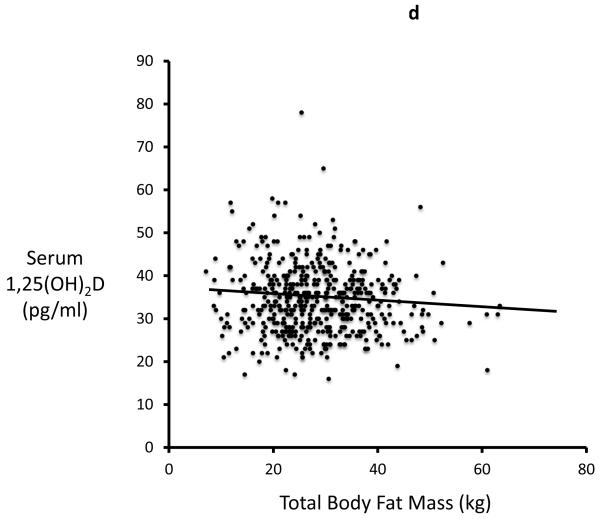
In study 2 (STOP IT) of 488 elderly women, Total body fat is highly correlated with Lean body mass (r=0.54, p<0.0001). Serum 25-OHD levels were inversely correlated with total body fat (r=0.19; p<0.0001) and with lean mass (r=0.13, p=0.03). Serum PTH is positively correlated with total body fat (r=0.27; p<0.0001) and inversely correlated with serum 25OHD. Serum 1,25(OH)2D is inversely correlated with total fat mass (r=0.09; p=0.034) Figures 2a-d.
Figure 2a, 2b, 2c and 2d.
Significant relationship exists between body fat mass and body lean mass, 25OHD, PTH, 1,25(OH)2D in STOPIT study
Figure 2a. Correlation between total body fat mass and total body lean mass measured by DXA scan(r=0.54; p<0.0001), Figure 2b. Correlation between baseline serum 25OHD and total body fat mass (r=0.19; p<0.0001), Figure 2c. Correlation between baseline serum PTH and total body fat mass (r=0.27; p<0.0001), Figure 2d. Correlation between baseline serum 1,25(OH)2D and total body fat mass (r=0.09; p=0.034).
In the multivariate analysis of factors influencing serum PTH - the significant independent predictors of serum PTH are total body fat, serum 25OHD and 1,25 (OH)2D (all p<0.001), whereas lean body mass (p=0.17) is not related (Table 1). In a similar multivariate model of serum 25OHD, the most significant predictor of serum 25OHD is serum PTH (p<0.001) while total body fat and 1,25(OH)2D are less significant predictors (p<0.05) (Table 2).
Table 1. Multivariate model of serum PTH: Factors affecting PTH.
| Effect | Parameter Estimate |
SE | p-value |
|---|---|---|---|
| Intercept | 1.36779 | 0.16358 | <.0001 |
| Age (years) | 0.00081204 | 0.00191 | 0.6713 |
| Serum 25OHD (ng/ml) | −0.00461 | 0.00066973 | <.0001 |
| Serum 1,25(OH)2D (pg/ml) | 0.0034 | 0.00086286 | <.0001 |
| Total body fat mass (kg) | 0.00382 | 0.00091496 | <.0001 |
| Total body lean mass (kg) | 0.00279 | 0.00203 | 0.17 |
| Total Body bone mineral content (kg) | −0.03667 | 0.03092 | 0.2363 |
The adjusted R2 for the model is 0.17. PTH was log transformed for better fit. 25OHD = 25 hydroxyvitamin D, 1,25(OH)2D = 1,25 dihydroxyvitamin D
Table 2. Multivariate model of serum 25OHD: Factors affecting serum 25OHD.
| Effect | Parameter Estimate |
SE | p-value |
|---|---|---|---|
| Intercept | 64.46745 | 10.99807 | <.0001 |
| Age (years) | −0.08236 | 0.12429 | 0.5079 |
| Serum PTH (ng/L) | −19.47544 | 2.83162 | <.0001 |
| Serum 1,25(OH)2D (pg/ml) | 0.12737 | 0.05671 | 0.0251 |
| Total body fat mass (kg) | −0.13327 | 0.06026 | 0.0275 |
| Total body lean mass (kg) | −0.15972 | 0.13185 | 0.2264 |
| Total Body bone mineral content (kg) | 4.16208 | 2.00443 | 0.0384 |
The adjusted R2 for the model is 0.13. PTH was log transformed for better fit. 25OHD = 25 hydroxyvitamin D, 1,25(OH)2D = 1,25 dihydroxyvitamin D
Longitudinal Analysis
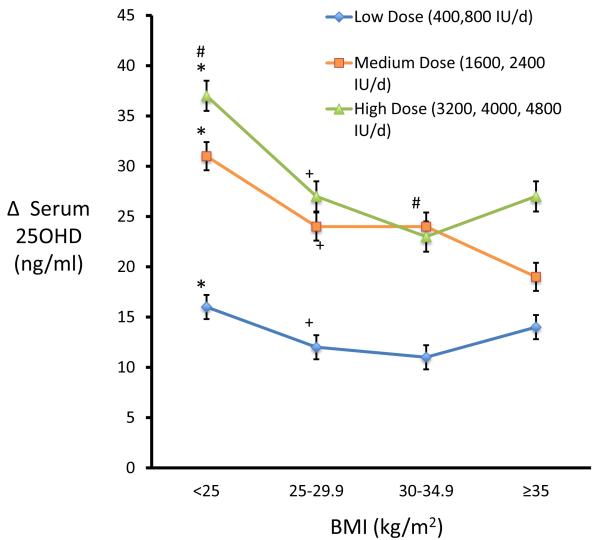
The increase in serum 25OHD after vitamin D is significantly less on lower doses than on the medium and higher doses groups (p<0.0001) (Figure 3). The highest increase in serum 25OHD after vitamin D occurs in thinner women with BMI <25 kg/m2 to. There were no significant differences in the serum 25OHD response to the medium and high doses in the obese groups, BMI groups, 30-34.9 and >35 kg/m2. There was a significant decrease in PTH at the end of the study from 36.6 to 31.3 pg/ml (p<0.0001) in study 1 and from 35 to 30 pg/ml in study 2 (p<0.0001).
Figure 3.
Higher BMI group showed a lower response when compared with group with low BMI.
The lines represent treated groups (placebo excluded) on low dose (400, 800 IU/d), medium dose (1600, 2400 IU/d) and high dose (3200, 4000, 4800 IU/d). Groups with similar symbols (*)(#)(+) are significantly different from each other.
The effect of one-year treatment with vitamin D on body fat and lean body mass
In study 1 (ViDOS)- There was no significant effect of vitamin D treatment on either body fat (p=0.098) or on lean body mass (p=0.115) (Table 3). There was no difference between placebo and treatment groups in terms of percentage change in total fat mass (p=0.711) and percentage change in lean body mass (p=0.607).
Table 3. Body composition parameters from DXA scan before and after treatment.
| Total Body Fat Mass (kg) |
p value | Total Body Lean Mass (kg) |
p value | |||
|---|---|---|---|---|---|---|
| Baseline | Final | Baseline | Final | |||
|
STOPIT Study (3-year) |
||||||
| Calcitriol | 27.5 | 27.3 | 0.572 | 37.3 | 36.3 | <0.0001 |
| Placebo | 28.4 | 28.6 | 0.628 | 37.7 | 36.7 | <0.0001 |
|
ViDOS Study (1-year) |
||||||
| Vitamin D3 | 31.7 | 32.1 | 0.098 | 43.6 | 43.4 | 0.115 |
| Placebo | 33.6 | 33.7 | 0.986 | 44.4 | 43.9 | 0.3 |
The values are mean unless specified. All p values are derived from paired t-tests and are significant if less than 0.05
18.
The effect of calcitriol treatment for 3-year on body fat and lean body mass
In the STOPIT study we only used the data for the calcitriol arm and not the estrogen + calcitriol arm There was no significant effect of calcitriol on total body fat, (p=0.572) but there was a significant decrease in lean body mass at the end of the 3-year study (p<0.0001)(Table 3). In the placebo treated group there was a significant decrease in lean body mass (p<0.0001) but not total fat mass (p=0.628). There was no difference between the placebo and calcitriol groups in the percent body fat mass (p=0.410) or lean body mass (p=0.921) at the end of the 3-year study.
In both studies longitudinal analysis showed that the only predictor final body fat mass was baseline body fat mass. There was a significant decrease in serum PTH of 15 percent on calcitriol.
Discussion
It is common to find low serum 25OHD in obese individuals and low serum 25OHD has been linked to many diseases such as diabetes and metabolic syndrome. However it is not known whether the low serum 25OHD is due to vitamin D insufficiency, secondary to the increase in fat mass or to other factors such as genotype variation in D binding protein or enzymes involved in vitamin D metabolism.
It is relevant to examine the relationship between fat and lean mass and serum vitamin D and 25 hydroxyvitamin D levels because both have been identified in fat as well as muscle, liver and skin (8,9). In both studies there is an increase of 130 percent in fat mass and 35 percent in lean body mass between the groups with a normal BMI < 25 compared to women in the largest BMI group >35. It is possible that the increased muscle mass in obesity could be related to lower serum 25OHD levels since both vitamin D and 25OHD are present in muscle. Muscle mass may be increased in obesity because it is a physiognomic characteristic or a response to carrying the greater weight of fat and also because there may be deposition of fat in muscle. In the study by Jakobsen et al 14 percent of the vitamin D stores were in muscle compared to 78 percent in fat and 25OHD stores were 33 percent in fat and 20 percent in muscle (8). Thus, muscle mass should be considered as another significant storage site of vitamin D and 25OHD in the body.
In our previous analysis (11) we showed that after vitamin D supplementation of doses between 400 - 4800IU/day serum 25OHD reached a plateau at around 45 ng/ml. Previous studies that used two to three doses of vitamin D generally inferred that the dose response was linear (13) however as our dose response study shows this is probably incorrect and the response is a quadratic function suggesting that there is a regulatory step that maintains serum 25OHD at around 45 ng/ml. Part of the variance around the mean change in the dose response curve can be explained by BMI and obese women increase serum 25OHD less than thin women. Other contributing causes to the variance are genotypes of the Cyp2R1 and Cyp24A1 enzymes that control hydroxylation in the vitamin D pathway and the D binding protein that can alter the level of free 25OHD (14). It is not known whether any of these genotype factors that alter the dose response curve are independently related to BMI. This regulation of serum 25OHD might have been predicted since 1,25(OH)2D, the most bioactive of the metabolites, is homeostatically regulated and controlling the input from 25OHD or the output to 24,25(OH)2D represent control mechanisms.
We examined the dose response to vitamin D according to BMI and divided our 7 vitamin D dose groups into low, medium and high. The low dose group (400-800IU) shows little variation in serum 25OHD across all BMI groups. In the medium and high dose vitamin D groups (1600-4800IU) doses only thin women with a normal BMI show high levels of serum 25OHD and there is no evidence from the dose response curves that in obesity serum 25OHD is being deposited in fat. The dose response curves are so parallel between thin and obese people that the difference in serum 25OHD levels must be due to a volume dilution effect (11). We do not know what is the true size of that pool and it would have to be experimentally determined. But it cannot be that large since the difference in dose response curves between normal BMI < 25 and obesity >35 is only 7ng/ml (11), this suggests therefore that low levels of serum 25OHD in obesity are mainly due to inadequate intake of vitamin D. Since sunlight is the major source of vitamin D the probably lack exposure perhaps due to lack of exercise or avoidance of sun because of heat intolerance. Although the response in serum 25OHD to vitamin D in obesity is less than that in thin women it is satisfactory according to IOM guidelines (15)
The relationship between PTH and body fat mass is not clear. Some studies suggest that PTH excess may be associated with increased body fat by increasing calcium influx into the cells thereby increasing lipogenesis (2,16,17). But there have been no longitudinal studies of the change in serum PTH on fat mass. In the cross sectional analysis the association between serum PTH and body fat mass was significantly related and the analysis showed that body fat was an independent predictor of serum PTH. In both of our intervention studies serum PTH decreased on vitamin D and calcitriol but there was no significant change in fat mass.
Our study has some limitations. These results may not be be applicable to other age groups since the metabolism of PTH, 25OHD, 1,25(OH) 2D and adipose tissue are known to change with age. Our study was not powered to detect differences in fat mass because this is secondary analysis. Nevertheless in both our studies results were similar.
Summary
The response to vitamin D supplementation was dependent on body size. In the groups with a BMI of 25, - <29.9 and > 30 kg/m2 serum 25OHD level was 7ng/ml lower in the group with a normal BMI of < 25kg/m2 probably due to a volume dilution effect. Thinner women develop much higher levels of serum 25OHD after vitamin D supplementation and in this group doses of vitamin D should be smaller. In two intervention studies in which there was a decrease in serum PTH there was no effect of vitamin D or calcitriol on body fat suggesting that neither vitamin D or PTH are important in reducing fat mass during 3 year follow up. Despite the numerous association studies between lower levels of serum 25OHD and diseases associated with obesity there is a real lack of intervention studies with vitamin D in disorders of metabolic syndrome and obesity that could confirm a causative role for vitamin D.
Highlights.
-
!!
There was an inverse and independent relationship between serum25OHD and body fat mass at baseline
-
!!
There was no treatment effect of vitamin D or calcitriol on fat mass in randomized trials
-
!!
The response to vitamin D treatment varies according to body weight and those with normal or low BMI should use smaller doses of vitamin D.
Acknowledgments
Grant Support: Study 1-National Institute on Aging (RO1-AG28168)
Study 2 - NIH (Grants UO1-AG10373 and RO1-AG10373)
Footnotes
Publisher's Disclaimer: This is a PDF file of an unedited manuscript that has been accepted for publication. As a service to our customers we are providing this early version of the manuscript. The manuscript will undergo copyediting, typesetting, and review of the resulting proof before it is published in its final citable form. Please note that during the production process errors may be discovered which could affect the content, and all legal disclaimers that apply to the journal pertain.
Disclosure: The authors have nothing to disclose.
References
- 1.Liel Y, Ulmer E, Shary J, Hollis BW, Bell NH. Low circulating vitamin D in obesity. Calcif Tissue Int. 1988;43:199–201. doi: 10.1007/BF02555135. [DOI] [PubMed] [Google Scholar]
- 2.Parikh SJ, Edelman M, Uwaifo GI, et al. The relationship between obesity and serum 1,25-dihydroxy vitamin D concentrations in healthy adults. J Clin Endocrinol Metab. 2004;89:1196–1199. doi: 10.1210/jc.2003-031398. [DOI] [PubMed] [Google Scholar]
- 3.Moschonis G, Tanagra S, Koutsikas K, Nikolaidou A, Androutsos O, Manios Y. Association between serum 25-hydroxyvitamin D levels and body composition in postmenopausal women: the postmenopausal Health Study. Menopause. 2009 Jul-Aug;16(4):701–7. doi: 10.1097/gme.0b013e318199d5d5. [DOI] [PubMed] [Google Scholar]
- 4.Jungert A, Roth HJ, Neuhauser-Berthold M. Serum 25-hydroxyvitamin D3 and body composition in an elderly cohort from Germany: a cross-sectional study. Nutr Metab (Lond) 2012 May 18;9(1):42. doi: 10.1186/1743-7075-9-42. Epub ahead of print. [DOI] [PMC free article] [PubMed] [Google Scholar]
- 5.Wortsman J, Matsuoka LY, Chen TC, Lu Z, Holick MF. Decreased bioavailability of vitamin D in obesity. Am J Clin Nutr. 2000;72:690–693. doi: 10.1093/ajcn/72.3.690. [DOI] [PubMed] [Google Scholar]
- 6.Drincic AT, Armas LA, Van Diest EE, Heaney RP. Volumetric dilution, rather than sequestration best explains the low vitamin d status of obesity. Obesity (Silver Spring) 2012 Jul;20(7):1444–8. doi: 10.1038/oby.2011.404. doi: 10.1038/oby.2011.404. Epub 2012 Jan 19.8. [DOI] [PubMed] [Google Scholar]
- 7.Brouwer DA, van Beek J, Ferwerda H, et al. Rat adipose tissue rapidly accumulates and slowly releases an orally-administered high vitamin D dose. Br J Nutr. 1998;79:527–532. doi: 10.1079/bjn19980091. [DOI] [PubMed] [Google Scholar]
- 8.Jakobsen J, Maribo H, Bysted A, Sommer HM, Hels O. 25-hydroxyvitamin D3 affects vitamin D status similar to vitamin D3 in pigs - but the meat produced has a lower content of vitamin D. Br J Nutr. 2007;98:908–913. doi: 10.1017/S0007114507756933. [DOI] [PubMed] [Google Scholar]
- 9.Blum M, Dolnikowski G, Seyoum E, Harris SS, Booth SL, Peterson J, Saltzman E, Dawson-Hughes B. Vitamin D3 in fat tissue. Endocrine. 2008;33:90–94. doi: 10.1007/s12020-008-9051-4. [DOI] [PMC free article] [PubMed] [Google Scholar]
- 10.Mawer EB, Backhouse J, Holman CA, Lumb GA, Stanbury SW. The distribution and storage of vitamin D and its metabolites in human tissues. Clin Sci. 1972 Sep;43(3):413–31. doi: 10.1042/cs0430413. [DOI] [PubMed] [Google Scholar]
- 11.Gallagher JC, Sai A, Templin T, 2nd, Smith L. Dose response to vitamin D supplementation in postmenopausal women: a randomized trial. Ann Intern Med. 2012 Mar 20;156(6):425–37. doi: 10.7326/0003-4819-156-6-201203200-00005. [DOI] [PubMed] [Google Scholar]
- 12.Gallagher JC, Fowler SE, Detter JR, Sherman SS. Combination treatment with estrogen and calcitriol in the prevention of age-related bone loss. J Clin Endocrinol Metab. 2001 Aug;86(8):3618–28. doi: 10.1210/jcem.86.8.7703. [DOI] [PubMed] [Google Scholar]
- 13.Vieth R. Vitamin D supplementation, 25-hydroxyvitamin D concentrations, and safety. Am J Clin Nutr. 1999;69(5):842–56. doi: 10.1093/ajcn/69.5.842. [DOI] [PubMed] [Google Scholar]
- 14.Wang TJ, Zhang F, Richards JB, Kestenbaum B, van Meurs JB, Berry D, et al. Common genetic determinants of vitamin D insufficiency: a genomewide association study. Lancet. 2010:376180–8. doi: 10.1016/S0140-6736(10)60588-0. PubMed. [DOI] [PMC free article] [PubMed] [Google Scholar]
- 15.Institute of Medicine . Dietary reference intakes for calcium and vitamin D. The National Academies Press; Washington, DC: 2011. [PubMed] [Google Scholar]
- 16.McCarty MF, Thomas CA. PTH excess may promote weight gain by impeding catecholamine-induced lipolysis-implications for the impact of calcium, vitamin D, and alcohol on body weight. Med Hypotheses. 2003;61:535–542. doi: 10.1016/s0306-9877(03)00227-5. [DOI] [PubMed] [Google Scholar]
- 17.Snijder MB, van Dam RM, Visser M, Deeg DJ, Dekker JM, Bouter LM, Seidell JC, Lips P. Adiposity in relation to vitamin D status and parathyroid hormone levels: a population-based study in older men and women. J Clin Endocrinol Metab. 2005 Jul;90(7):4119–23. doi: 10.1210/jc.2005-0216. Epub 2005 Apr 26. [DOI] [PubMed] [Google Scholar]


