

Abstract
OBJECTIVE
Roux-en-Y gastric bypass (RYGB) in humans can remit type 2 diabetes, but the operative mechanism is not completely understood. In mice, fibroblast growth factor (FGF) 15 (FGF19 in humans) regulates hepatic bile acid (BA) production and can also resolve diabetes. In this study, we tested the hypothesis that the FGF19–BA pathway plays a role in the remission of human diabetes after RYGB surgery.
RESEARCH DESIGN AND METHODS
Cohorts of diabetic and nondiabetic individuals of various body weights were used. In addition, RYGB patients without diabetes (No-Diabetes), RYGB patients with diabetes who experienced remission for at least 12 months after surgery (Diabetes-R), and RYGB patients with diabetes who did not go into remission after surgery (Diabetes-NoR) were studied. Circulating FGF19 and BA levels, hepatic glycogen content, and expression levels of genes regulating the FGF19–BA pathway were compared among these groups of patients using pre- and postoperative serum samples and intraoperative liver biopsies.
RESULTS
Preoperatively, patients with diabetes had lower FGF19 and higher BA levels than nondiabetic patients, irrespective of body weight. In diabetic patients undergoing RYGB, lower FGF19 levels were significantly correlated with increased hepatic expression of the cholesterol 7alpha-hydroxylase 1 (CYP7A1) gene, which modulates BA production. Following RYGB surgery, however, FGF19 and BA levels (particularly cholic and deoxycholic acids) exhibited larger increases in Diabetic-R patients compared with nondiabetic and Diabetic-NoR patients.
CONCLUSIONS
Taken together, the baseline and postoperative data implicate the FGF19–CYP7A1–BA pathway in the etiology and remission of type 2 diabetes following RYGB surgery.
Type 2 diabetes is a metabolic disease with significant health implications for which current therapies do not result in long-term resolution. Roux-en-Y gastric bypass (RYGB) surgery is a complex, anatomically disruptive procedure (1) that leads to remission of diabetes for most, but not all, patients (2,3). The mechanism for the reversal of diabetes by RYGB surgery, however, is not well-understood.
Work in mice has identified an enterohepatic pathway involving the fibroblast growth factor (FGF) 15 (FGF19 in humans) that reversed dietary diabetes (4) and improved glycogen synthesis in diabetic mice (5). Most of the FGF family members function in a paracrine fashion to regulate processes of development, transformation, angiogenesis, and energy homeostasis (6,7). FGF19- and FGF21-transgenic mice were resistant to diet-induced obesity and had improved insulin sensitivity and glucose disposal (8,9). Injection of recombinant FGF15 protein into diabetic mice resulted in the reduction of serum glucose and insulin levels, improved glucose tolerance, and decreased hepatosteatosis and body weight (10,11).
In humans, serum levels of FGF19 were increased postprandially by chenodeoxycholic acid (CDCA) and decreased by bile acid (BA) sequestrants (12). FGF19 is produced primarily in the ileum and signals in hepatocytes through its two receptors, FGF receptor 4 (FGFR4) and βKlotho, to inhibit expression of cholesterol 7alpha-hydroxylase 1 (CYP7A1) (13). In response to FGF19, CYP7A1 regulates the rate-controlling step for the conversion of cholesterol into BAs (14). In turn, the farnesoid X receptor (FXR) responds to BAs and regulates intestinal FGF19 secretion, which makes it an important regulator of glucose metabolism (15). By a feedback mechanism, BAs also regulate hepatic CYP7A1 gene expression through a multicomponent pathway involving hepatic FXR (16).
In this study, we tested the hypothesis that the enterohepatic FGF19–BA pathway plays a role in the etiology of diabetes and its remission following RYGB surgery.
RESEARCH DESIGN AND METHODS
Study participants
Two cohorts were used in this study: 1) a Geisinger Clinic–enrolled cohort consisting of patients with diabetes (Diabetes; N = 66) and control patients without diabetes (No-Diabetes or nondiabetic patients; N = 54) with mean BMIs representing BMIs of typical diabetic and control patients (i.e., 30.0 and 30.3 kg/m2, respectively) and 2) a cohort from Geisinger Clinic’s bariatric surgery program consisting of diabetic (N = 115) and nondiabetic (N = 71) patients with BMIs typical for these groups (i.e., 48.3 and 48.5 kg/m2, respectively) (Table 1). The data described in Tables 1–3 were performed using subsets of these two major cohorts, constrained by tissue or serum sample availability for each patient. Specific characteristics of each subset are provided in the supplementary figure legend and Supplementary Tables 1–3. Studies were approved by the Geisinger Clinic Institutional Review Board for research. All participants provided written informed consent.
Table 1.
Descriptive characteristics of study populations
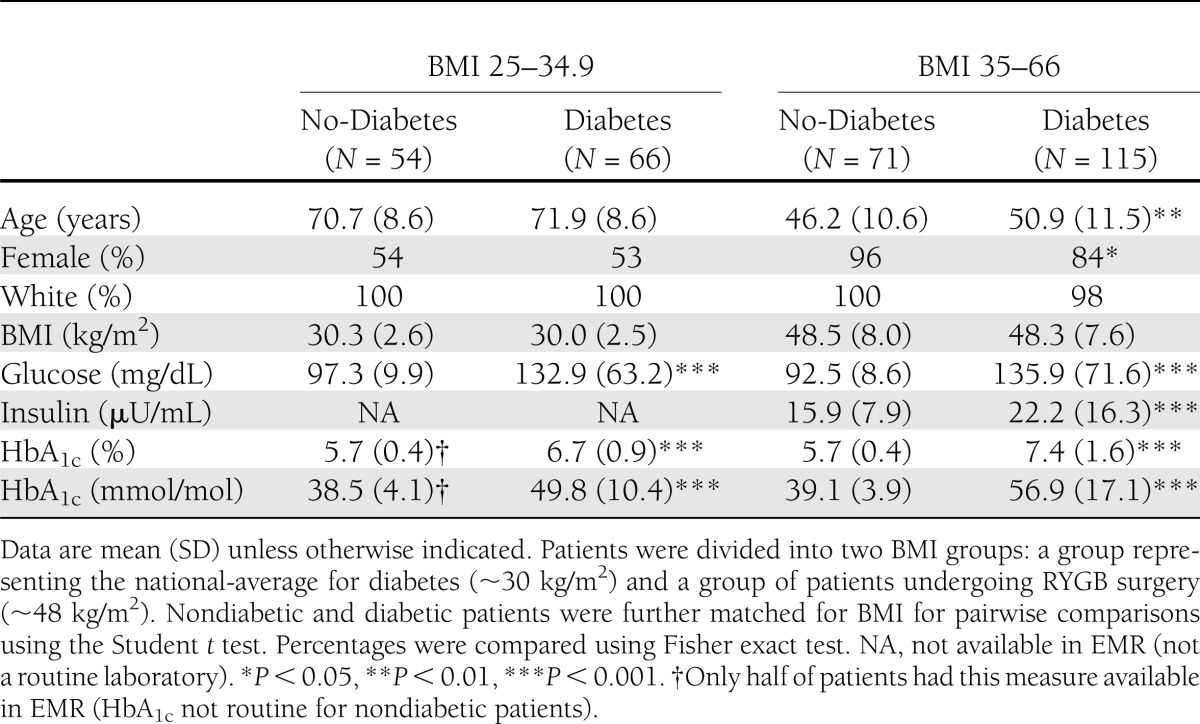
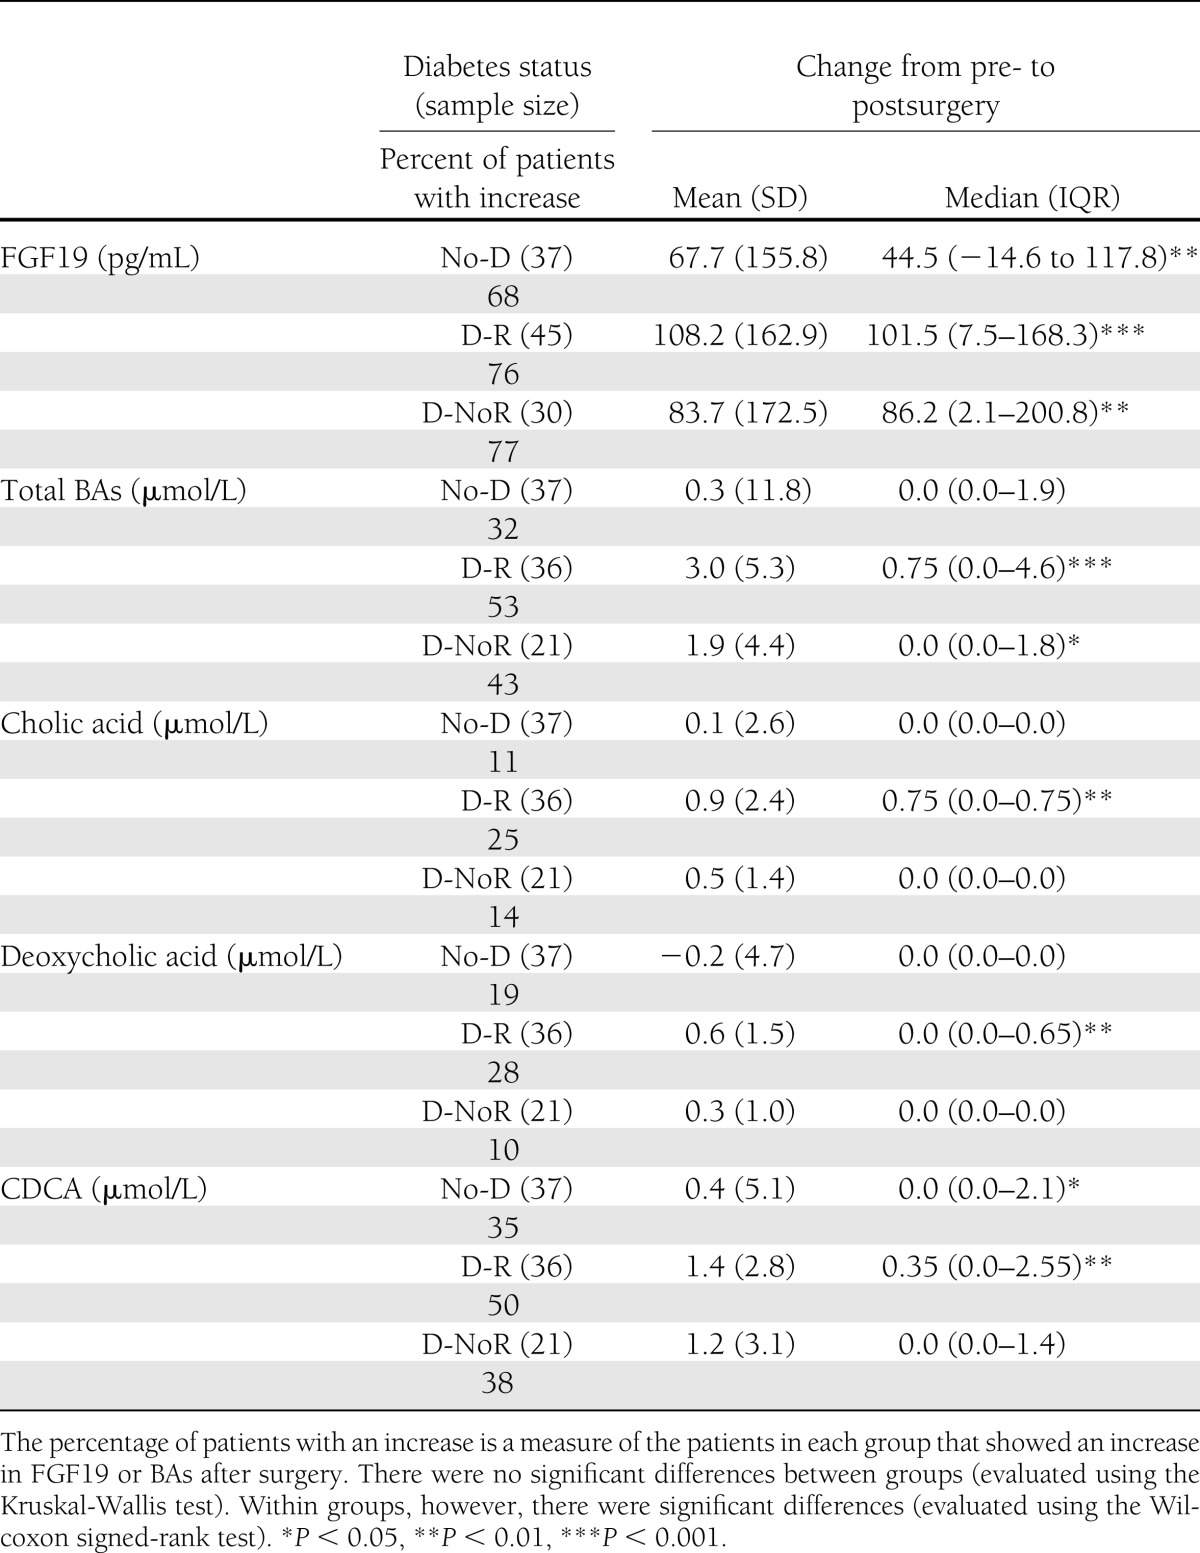
Table 3.
Comparisons of the change from pre- to postoperative serum levels of FGF19, total BAs, and fractions of BAs between three groups: RYGB patients without diabetes (No-D), RYGB diabetic patients with remission of diabetes after surgery (D-R), and diabetic patients who did not have remission of diabetes after surgery (D-NoR)
Three groups of RYGB patients were used for this study: 1) a control group that did not have diabetes before or after surgery (No-Diabetes), 2) a group that had diabetes before surgery but experienced complete remission (17) for at least 12 months after surgery (Diabetes-R), and 3) a group that had diabetes before surgery but did not go in remission at any time after surgery (Diabetes-NoR).
All presurgery serum samples were collected ∼2 months before surgery. The post-RYGB surgery serum samples were collected at various time points (days postsurgery, interquartile range [IQR]), as follows: No-Diabetes: median 157 days, IQR 146–256, mean 192, SD 112, range 10–523; Diabetes-R: median 150 days, IQR 145–309, mean 201, SD 124, range 1–497; and Diabetes-NoR: median 142 days, IQR 55–182, mean 159, SD 118, range 3–410. All postoperative samples in the Diabetes-R group were taken while patients were in a diabetes-free state and remained diabetes-free for a minimum of 12 months after surgery to conform to diabetes remission criteria (section below).
All of the blood draws were obtained in the fasted state (minimum of 12-h fast). For the determination of changes of serum FGF19 and BAs, pre- and postsurgery samples from the same patient were paired.
Definition of type 2 diabetes and remission of type 2 diabetes
The definition of type 2 diabetes was according to American Diabetes Association–recommended guidelines (18). Diabetes was defined by fasting glucose >126 mg/dL or HbA1c >6.5% (or >48 mmol/mol). All other patients were classified as individuals without diabetes (i.e., No-Diabetes group). Diabetic patients were prescribed an insulin sensitizer, or insulin, or combinations before surgery. The status of nondiabetes was further ascertained by the absence of diabetes medication and diagnosis of diabetes, as documented in our electronic medical records (EMR).
Remission of diabetes was defined according to the established definition of the cure of diabetes (17). Diabetic patients were considered to be in remission of diabetes (Diabetes-R) if they were free of any use of antidiabetic medications (e.g., metformin or insulin), their fasting blood glucose levels were <100 mg/dL, and HbA1c was <5.7% (or <39 mmol/mol) for a minimum of 12 months after RYGB. Additional confirmation was obtained by examining their EMR for the ICD-9 diagnostic code for diabetes. The group without remission after RYGB surgery (Diabetes-NoR) had at least one indication of diabetes for the aforementioned measures. Specific characteristics of the No-Diabetes, Diabetes-R, and Diabetes-NoR groups of patients, before and after surgery, are provided in the Supplementary Table 3.
FGF19 serum levels
The FGF19 assay (pg/mL) was performed according to the manufacturer’s instructions (R&D Systems, Minneapolis, MN) with sample, controls, and standards assayed in duplicate. This immunoassay used the quantitative sandwich enzyme technique, which is based on a monoclonal antibody specific to the human FGF19. The range of detection in serum is 31–554 pg/mL, with an SD of 125 pg/mL when using 36 serum samples. The coefficient of variation values of intra-assay and interassay precision are 4.5 and 5.5%, respectively.
Total and fractionated BAs
Total and fractionated BAs (i.e., cholic acid, deoxycholic acid, and CDCA; μmol/L), were measured by Quest Diagnostics (Horsham, PA) using liquid chromatography–tandem mass spectrometry. The normal reference ranges are as below, but values outside of these ranges can be measured: cholic acid: ≤3.1 µmol/L; deoxycholic acid: ≤7.3 µmol/L; CDCA: ≤9.9 µmol/L; and total BAs: 4.5–19.2 µmol/L.
Fatty liver disease
Fatty liver disease was determined by histological examination of liver biopsies obtained at RYGB. Intraoperative wedge biopsies of the liver were obtained 10 cm to the left of the falciform ligament. A portion of the biopsy was fixed in 10% neutral buffered formalin and stained with hematoxylin and eosin for routine histology and Masson’s trichrome for assessment of fibrosis. All sections were read by experienced pathologists as previously described (19) using the criteria for nonalcoholic steatohepatitis (NASH) (20) as follows: steatosis grade 0 (no intracellular lipid), 1 (0 to <33%), 2 (34 to <66%), and 3 (>67%); lobular inflammation grade 0 (no inflammation), grade 1 (mild inflammation), grade 2 (moderate inflammation), and grade 3 (severe inflammation); fibrosis grade 0 (no perisinusoidal fibrosis), grade 1 (mild perisinusoidal fibrosis), and grade 2 (moderate perisinusoidal fibrosis), bridging fibrosis, and cirrhosis. Liver function tests were measured using Roche automated clinical chemistry technology (Roche). All patients with serological, pathological, and/or clinical evidence of viral hepatitis were excluded.
Hepatic gene expression using real-time quantitative PCR
RNA preparations from liver biospecimens taken during RYGB surgery were performed using a commercial kit. Specifically, samples were placed in RNA later, and RNA was prepared using the RNeasy Lipid Tissue Mini Kit (Qiagen, Valencia, CA). RNA quality evaluation and quantitation were performed using a Nanodrop ND-1000 spectrophotometer (Thermo Scientific, Wilmington, DE). Quantitative PCR was performed in duplicate on the ABI 7500 Fast Plate (Applied Biosystems, Life Technologies, Grand Island, NY) as we have previously described (21). Analysis was conducted by subtracting the threshold cycle (Ct) value of glyceraldehyde-3-phosphate dehydrogenase (GAPDH) from the Ct value of the gene of interest as previously shown (22,23). For example, the threshold of gene detection using this equation (40 − Δ[Ct − Ct of GAPDH]) corresponds to a Ct value at ∼35. Predesigned primers for FGF4R, CYP7A1, glycogen synthase (GS), FXR, βKlotho, and GAPDH were obtained from Applied Biosystems (Hs01106908_m1, Hs00167982_m1, Hs00608677_m1, Hs00231968_m1, Hs00545621_m1, and Hs02758991_m1, respectively).
Hepatic glycogen content
Liver biospecimens taken at RYGB surgery were trimmed to ∼10 mg. Samples were homogenized on ice in 1 mL of citrate buffer (0.1 mol, pH 4.2) with sodium fluoride (250 mg/dL). The EnzyChrom Glycogen (µg/mL) Assay kit was used according to the manufacturer’s instructions (BioAssay Systems, Hayward, CA).
Statistical analyses
Means (SD) and percentages were used to describe the demographics, body size, and diabetes/lipid laboratory levels of the study populations. These characteristics and quantitative PCR data were compared between groups using two-sample t tests (continuous data) and Fisher exact test (categorical data). The distributions of FGF19, BAs, and hepatic glycogen were compared between groups using nonparametric statistical tests (i.e., Wilcoxon rank-sum test) to account for the inherent heteroskedasticity of skewed distributions (as confirmed by Shapiro-Wilk test for skewness). When evaluating change in results from pre- to post-RYGB, the within-group differences were assessed using the Wilcoxon signed-rank test, and between-group differences were assessed using the Kruskall-Wallis test. SAS version 9.2 (SAS Institute Inc.) was used for statistical analysis, and P values <0.05 were considered significant.
RESULTS
Diabetic patients had significantly lower FGF19 and higher BA serum levels than patients without diabetes
Patients were stratified into two BMI groups: 1) a nonsurgical group with a BMI range of 25–34.9 kg/m2, representing the typical diabetic population, and 2) a surgical group with a BMI range of 35–66 kg/m2, representing the typical BMI range of patients undergoing RYGB. FGF19 levels were significantly lower in the diabetic patients with the lower BMI and trended in the same direction in the RYGB group (Table 2). After combining the patients from the two BMI ranges, serum FGF19 levels were significantly lower in diabetic compared with nondiabetic patients (Table 2).
Table 2.
Comparisons of FGF19 and total BA serum levels between patients without diabetes (No-Diabetes) or with diabetes (Diabetes), representing two BMI ranges
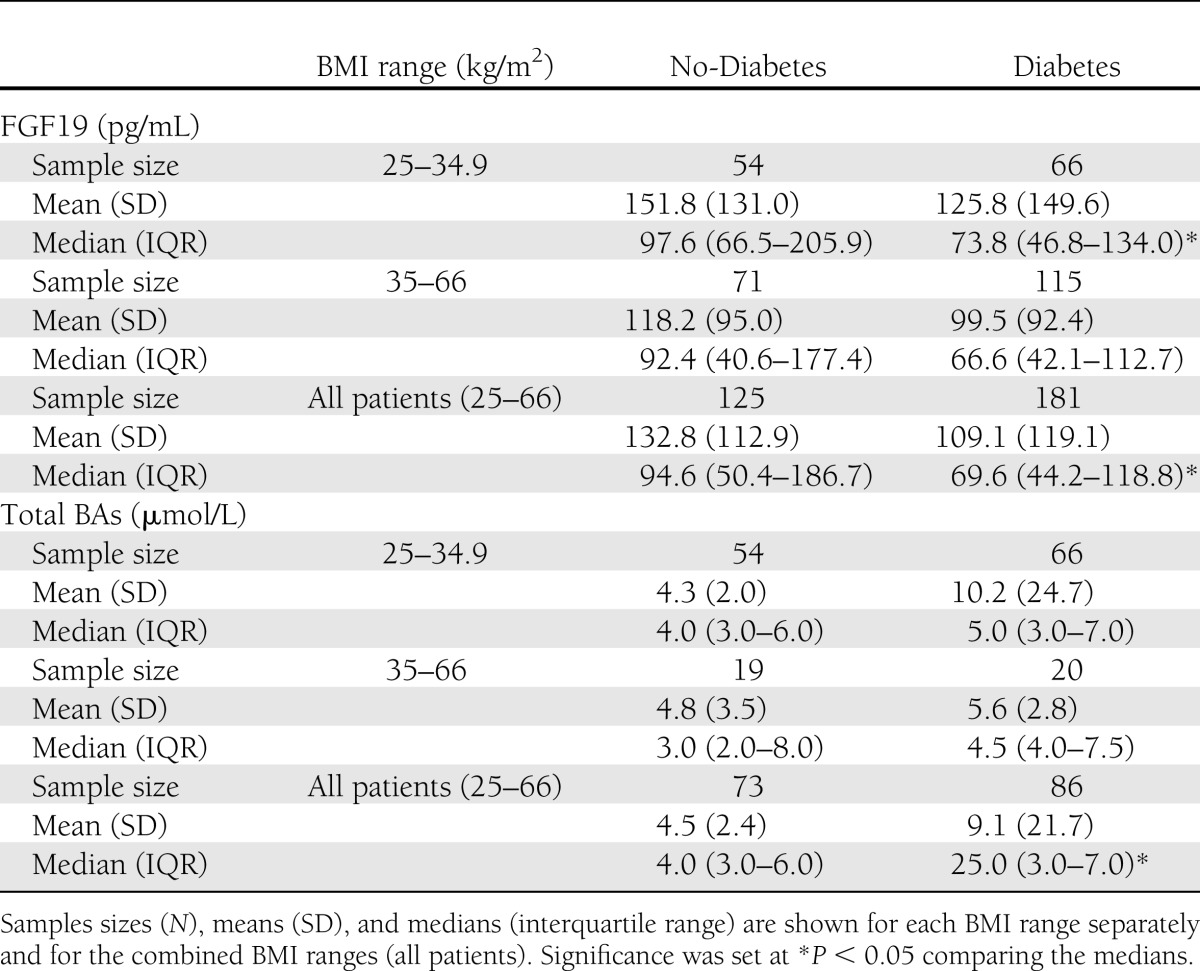
With respect to serum total BAs, diabetic patients had higher levels than nondiabetic patients in both BMI groups but not at statistically different levels, likely due to the high degree of intraindividual variation, also reported elsewhere (24). However, after combining the two BMI ranges, diabetic patients had statistically higher levels of serum BAs compared with nondiabetic patients (Table 2).
There were no differences in FGF19 or BA levels between the two BMI groups in diabetic (P = 0.125) or nondiabetic (P = 0.309) patients, suggesting a lack of effect by body weight on serum FGF19 and BA levels.
Low FGF19 levels in diabetes were correlated with higher hepatic CYP7A1 expression before surgery independently of fatty liver disease
Using RNA preparations from liver biopsies taken at RYGB, we found no significant differences in gene expression levels between Diabetes and No-Diabetes for the two receptors of FGF19, βKlotho and FGFR4, and also for FXR and GS (Supplementary Tables 1 and 2). Glycogen content in the liver was also not different between groups. Serum FGF19 levels were significantly lower in the Diabetes group compared with No-Diabetes control patients (P = 0.018; Supplementary Table 2). In addition, these lower FGF19 levels were correlated with higher hepatic CYP7A1 in diabetic but not in nondiabetic patients (r = −339; P < 0.048). There were no significant associations between FGF19 and BA, FGF19 or BA with the expression of the other hepatic genes, or with glycogen content (Supplementary Table 2).
We also tested for the possible presence of association between FGF19 and BAs with histologically defined fatty liver disease. Diabetic patients had higher incidence of nonalcoholic fatty liver disease (NAFLD) (42%) and NASH (47%) compared with nondiabetic patients (29% for both NAFLD and NASH), but there were no significant correlations in either group with FGF19, BAs, and CYP7A1 (Supplementary Table 2).
Serum FGF19 and BA levels increased after RYGB with larger increases in diabetic patients with remission of diabetes (Diabetes-R)
FGF19 serum levels increased significantly after surgery for the majority of RYGB patients. Although the between-group differences were not significant, diabetic patients who went into remission (Diabetes-R) displayed the greatest increase compared with either nondiabetic patients or diabetic patients who did not go into remission (Diabetes-NoR) (Table 3).
Total BAs, in contrast, did not increase significantly for most of the nondiabetic (32%) and Diabetes-NoR (43%) patients, but a slight majority (53%) of Diabetes-R patients displayed a significant increase (Table 3). Cholic and deoxycholic acids did not increase for the majority of patients, but the Diabetes-R group displayed the highest and most significant increase (Table 3). CDCA increased in a larger number of patients and particularly more so for 50% of the patients in the Diabetes-R group, who also displayed the highest rise (Table 3). The between-group differences were also statistically significant.
In addition, despite the wide range of postoperative time points, there were no significant differences in FGF19 and BA between the samples collected in the first 120 days after surgery (which coincides with a sharp weight loss), 121–240 days, or after 240 days (by which time weight loss begins to reach its nadir for most patients) in any of the three groups of patients (nondiabetic, Diabetes-R, Diabetes-NoR) or the three groups combined (Supplementary Fig. 1).
CONCLUSIONS
In the current study, we tested the hypothesis that remission of diabetes in humans following RYGB surgery is associated with alterations of the FGF19–BA pathway. Preoperatively, we found that body weight did not have a significant effect on FGF19 and BA levels in nondiabetic or diabetic groups of patients. Overall, however, serum FGF19 levels were significantly lower in diabetic patients compared with patients without diabetes. In addition, total BAs were higher in diabetic patients compared with patients without diabetes, suggesting the possible presence of an impairment in the enterohepatic FGF19–BA pathway in the diabetic state. We did not find any significant correlations between FGF19 and BA levels, which could be due to high variation in baseline FGF19 (sevenfold) and BA (ninefold), as already reported in normal individuals after fasting (24). The nonsurgical cohort was significantly older than the surgical one, but the trend of both FGF19 and BA was similar in both cohorts, suggesting that age may not be a significant factor for variation in these two measures.
To examine potential mechanisms of impairment in the enterohepatic FGF19–BA pathway, we used liver biopsies taken during RYGB surgery and compared hepatic signaling components of the FGF19–BA pathway between diabetic and nondiabetic patients. There was a significant correlation between lower FGF19 levels and higher CYP7A1 expression but only in the liver of diabetic patients who had elevated BA (as discussed above). In monkeys, antibody-mediated inhibition of FGF19 was also associated with increased CYP7A1 expression and increased BA (25), which is similar to the mechanistic relationships among FGF19, CYP7A1, and BA in our diabetic patients. Higher expression of CYP7A1 in diabetes should increase BA production (26), and this seemed to be the case in the diabetic group of patients, but CYP7A1 should be inhibited back by BAs through a feedback mechanism involving the hepatic FXR–small heterodimer partner–hepatocyte nuclear factor 4α pathway (16,27), keeping the FGF19–CYP7A1–BA pathway in balance. However, this was not the case in the diabetic patients, suggesting lack of response to BA in the liver as one possibility. In addition, the expression levels of hepatic FXR, βKlotho, and FGFR4 were not affected in diabetic compared with nondiabetic patients, despite their altered FGF19 and BA levels, suggesting the presence of dysregulation in the response to BA in diabetes, as well as the presence of a form of impairment in hepatic response to FGF19, which has been reported in patients with NAFLD and insulin resistance (28).
Defective BA transport and signaling may also play a direct role in the development of NAFLD (27). In our cohorts, diabetic patients had a higher incidence of NAFLD and NASH compared with nondiabetic patients, but there were no significant correlations between NAFLD or NASH and FGF19, BAs, and CYP7A1. In addition, hepatic GS gene expression and glycogen content were not different between nondiabetic and diabetic patients, which was unexpected because BA can alter glycogen synthesis (27,29). This, again, could be due to the dysregulated FGF19–CYP7A1–BA pathway in diabetic patients.
Following RYGB surgery, FGF19 and BA have been reported to increase after RYGB surgery (30,31). In this study, we show for the first time that the largest increases in FGF19 and BA serum levels took place in the diabetic patients who went into remission (Diabetes-R) compared with the nondiabetic and Diabetes-NoR patients, although there were no significant differences between groups. The Diabetes-R group was also unique in that cholic and deoxycholic acids increased exclusively in these patients. Cholic acid has been inversely correlated with insulin resistance (32), suggesting that it could play a key role in the remission of diabetes after RYGB. Weight loss after RYGB does not correlate with improved glucose homeostasis in low BMI diabetic patients (33). Similarly, we found no correlations between FGF19 and BA with body weight preoperatively, as well as with postoperative weight loss in any group, despite the fact that our serum samples were collected at various time points that correspond to different rates of weight loss after surgery (34). It is possible, however, that the variability in the time of serum sample collection may affect the precision of the measurements due to body weight changes between time points. Although we did not see this in our cohort, it could still contribute to variation and affect outcomes when comparing different groups of patients. It should also be noted that our cohort consisted mostly (∼98%) of white Caucasian patients, which is representative of the catchment area of our clinic. Hence, circulating FGF19/BA and gene expression levels may differ in other ethnic groups, which could affect the outcomes of each study. Future controlled prospective longitudinal studies with standardized times of sample collections in a variety of ethnic backgrounds will be needed to delineate the potential dynamics of FGF19 and BA levels before and after RYGB surgery.
Our experience, and that of others (35), is that most diabetic patients (∼75%) go into remission within days or 24 h after RYGB surgery. Normally, BAs from the gallbladder are secreted into the duodenum, where they mix with food from the stomach and get reabsorbed in the ileum (16). After RYGB surgery, however, BAs continue to be secreted into the empty duodenum that has been anastomosed directly onto the distal small intestine, bypassing ∼90% of the stomach, the duodenum, and ∼150 cm of the jejunum (in our clinic) and flowing closer to the ileum, where FGF19 is produced. These digestate-free BAs may be more bioactive and can alter hepatic glucose oxidation (36) and stimulate enteric FGF19 production (12,37), which was shown in this study to be lower in diabetic patients, irrespective of BMI. We hypothesize that these digestate-free BAs may be responsible for the increase of enteric FGF19 production after RYGB surgery, which in turn may resensitize the liver to FGF19 and equilibrate glucose homeostasis (38). A properly controlled study that can introduce free BAs into the jejunum, and thus emulate the availability of digestate-free BA after RYGB surgery, will be needed to substantiate this hypothesis. The Diabetes-NoR patients also displayed increases in FGF19 but did not seem to benefit in terms of remission. This may be due to the severity of their diabetes as evidenced by their high glucose and HbA1c levels and the fact that the majority of them were prescribed insulin in addition to an insulin sensitizer. Requirement of insulin has been shown to reduce significantly the chances for diabetes remission after RYGB (39).
In summary, our data indicate that the FGF19–CYP7A1–BA pathway could play a significant role in the remission of diabetes after RYGB surgery. We show in this study for the first time that at baseline, FGF19 levels were lower in diabetic patients compared with nondiabetic control subjects, irrespective of BMI. We also show that following RYGB surgery, FGF19 and BA levels increased particularly more so in patients who went into remission of diabetes. Stimulation of enteric FGF19 production by digestate-free BAs may pharmacologically mimic RYGB and help elucidate further the role of this pathway in glucose metabolism and the remission of type 2 diabetes.
Acknowledgments
This work was supported by research funds from the Geisinger Clinic and National Institutes of Health grants DK-072488 (to G.S.G., C.D.S., and G.A.), DK-088231 (to G.S.G.), and DK-091601 (to G.S.G.).
No potential conflicts of interest relevant to this article were reported.
G.S.G. selected appropriate patients from the bariatric cohort and helped with the study design and manuscript preparation. A.M.S. and S.L.R. performed all experiments. G.C.W. performed all statistical analyses. A.T.P., J.G., and W.E.S. performed all RYGB surgeries on patients and liver biopsies. C.D.S. admitted all of the patients to the weight loss bariatric program at Geisinger Clinic. G.A. conceived and designed the study, participated in patient selection, and wrote the manuscript. G.A. is the guarantor of this work and, as such, had full access to all the data in the study and takes responsibility for the integrity of the data and the accuracy of the data analysis.
The authors thank the participating patients, the Geisinger Genomics Core, and Geisinger Clinic’s MyCode program for help with the serum samples and EMR of the nonsurgery cohort.
Footnotes
This article contains Supplementary Data online at http://care.diabetesjournals.org/lookup/suppl/doi:10.2337/dc12-2255/-/DC1.
References
- 1.Kellum JM, Chikunguwo SM, Maher JW, Wolfe LG, Sugerman HJ. Long-term results of malabsorptive distal Roux-en-Y gastric bypass in superobese patients. Surg Obes Relat Dis 2011;7:189–193 [DOI] [PubMed] [Google Scholar]
- 2.Gill RS, Sharma AM, Al-Adra DP, Birch DW, Karmali S. The impact of bariatric surgery in patients with type-2 diabetes mellitus. Curr Diabetes Rev 2011;7:185–189 [DOI] [PubMed] [Google Scholar]
- 3.Schauer PR, Kashyap SR, Wolski K, et al. Bariatric surgery versus intensive medical therapy in obese patients with diabetes. N Engl J Med 2012;366:1567–1576 [DOI] [PMC free article] [PubMed] [Google Scholar]
- 4.Fu L, John LM, Adams SH, et al. Fibroblast growth factor 19 increases metabolic rate and reverses dietary and leptin-deficient diabetes. Endocrinology 2004;145:2594–2603 [DOI] [PubMed] [Google Scholar]
- 5.Kir S, Beddow SA, Samuel VT, et al. FGF19 as a postprandial, insulin-independent activator of hepatic protein and glycogen synthesis. Science 2011;331:1621–1624 [DOI] [PMC free article] [PubMed] [Google Scholar]
- 6.Dutchak PA, Katafuchi T, Bookout AL, et al. Fibroblast growth factor-21 regulates PPARγ activity and the antidiabetic actions of thiazolidinediones. Cell 2012;148:556–567 [DOI] [PMC free article] [PubMed] [Google Scholar]
- 7.Goetz R, Beenken A, Ibrahimi OA, et al. Molecular insights into the klotho-dependent, endocrine mode of action of fibroblast growth factor 19 subfamily members. Mol Cell Biol 2007;27:3417–3428 [DOI] [PMC free article] [PubMed] [Google Scholar]
- 8.Tomlinson E, Fu L, John L, et al. Transgenic mice expressing human fibroblast growth factor-19 display increased metabolic rate and decreased adiposity. Endocrinology 2002;143:1741–1747 [DOI] [PubMed] [Google Scholar]
- 9.Inagaki T, Dutchak P, Zhao G, et al. Endocrine regulation of the fasting response by PPARalpha-mediated induction of fibroblast growth factor 21. Cell Metab 2007;5:415–425 [DOI] [PubMed] [Google Scholar]
- 10.Wu X, Li Y. Role of FGF19 induced FGFR4 activation in the regulation of glucose homeostasis. Aging (Albany NY) 2009;1:1023–1027 [DOI] [PMC free article] [PubMed] [Google Scholar]
- 11.Xu J, Lloyd DJ, Hale C, et al. Fibroblast growth factor 21 reverses hepatic steatosis, increases energy expenditure, and improves insulin sensitivity in diet-induced obese mice. Diabetes 2009;58:250–259 [DOI] [PMC free article] [PubMed] [Google Scholar]
- 12.Lundåsen T, Gälman C, Angelin B, Rudling M. Circulating intestinal fibroblast growth factor 19 has a pronounced diurnal variation and modulates hepatic bile acid synthesis in man. J Intern Med 2006;260:530–536 [DOI] [PubMed] [Google Scholar]
- 13.Inagaki T, Lin VY, Goetz R, Mohammadi M, Mangelsdorf DJ, Kliewer SA. Inhibition of growth hormone signaling by the fasting-induced hormone FGF21. Cell Metab 2008;8:77–83 [DOI] [PMC free article] [PubMed] [Google Scholar]
- 14.Russell DW. The enzymes, regulation, and genetics of bile acid synthesis. Annu Rev Biochem 2003;72:137–174 [DOI] [PubMed] [Google Scholar]
- 15.Lee FY, Lee H, Hubbert ML, Edwards PA, Zhang Y. FXR, a multipurpose nuclear receptor. Trends Biochem Sci 2006;31:572–580 [DOI] [PubMed] [Google Scholar]
- 16.Chiang JY. Bile acids: regulation of synthesis. J Lipid Res 2009;50:1955–1966 [DOI] [PMC free article] [PubMed] [Google Scholar]
- 17.Buse JB, Caprio S, Cefalu WT, et al. How do we define cure of diabetes? Diabetes Care 2009;32:2133–2135 [DOI] [PMC free article] [PubMed] [Google Scholar]
- 18.American Diabetes Association Standards of medical care in diabetes—2012. Diabetes Care 2012;35(Suppl. 1):S11–S63 [DOI] [PMC free article] [PubMed] [Google Scholar]
- 19.Gerhard GS, Chokshi R, Still CD, et al. The influence of iron status and genetic polymorphisms in the HFE gene on the risk for postoperative complications after bariatric surgery: a prospective cohort study in 1,064 patients. Patient Saf Surg 2011;5:1. [DOI] [PMC free article] [PubMed] [Google Scholar]
- 20.Brunt EM. Nonalcoholic fatty liver disease: what the pathologist can tell the clinician. Dig Dis 2012;30(Suppl. 1):61–68 [DOI] [PubMed] [Google Scholar]
- 21.Stütz AM, Staszkiewicz J, Ptitsyn A, Argyropoulos G. Circadian expression of genes regulating food intake. Obesity (Silver Spring) 2007;15:607–615 [DOI] [PubMed] [Google Scholar]
- 22.Than NG, Romero R, Tarca AL, et al. Mitochondrial manganese superoxide dismutase mRNA expression in human chorioamniotic membranes and its association with labor, inflammation, and infection. J Matern Fetal Neonatal Med 2009;22:1000–1013 [DOI] [PMC free article] [PubMed] [Google Scholar]
- 23.Lillvis JH, Erdman R, Schworer CM, et al. Regional expression of HOXA4 along the aorta and its potential role in human abdominal aortic aneurysms. BMC Physiol 2011;11:9. [DOI] [PMC free article] [PubMed] [Google Scholar]
- 24.Gälman C, Angelin B, Rudling M. Pronounced variation in bile acid synthesis in humans is related to gender, hypertriglyceridaemia and circulating levels of fibroblast growth factor 19. J Intern Med 2011;270:580–588 [DOI] [PubMed] [Google Scholar]
- 25.Pai R, French D, Ma N, et al. Antibody-mediated inhibition of fibroblast growth factor 19 results in increased bile acids synthesis and ileal malabsorption of bile acids in cynomolgus monkeys. Toxicol Sci 2012;126:446–456 [DOI] [PubMed] [Google Scholar]
- 26.Li T, Matozel M, Boehme S, et al. Overexpression of cholesterol 7α-hydroxylase promotes hepatic bile acid synthesis and secretion and maintains cholesterol homeostasis. Hepatology 2011;53:996–1006 [DOI] [PMC free article] [PubMed] [Google Scholar]
- 27.Trauner M, Claudel T, Fickert P, Moustafa T, Wagner M. Bile acids as regulators of hepatic lipid and glucose metabolism. Dig Dis 2010;28:220–224 [DOI] [PubMed] [Google Scholar]
- 28.Schreuder TC, Marsman HA, Lenicek M, et al. The hepatic response to FGF19 is impaired in patients with nonalcoholic fatty liver disease and insulin resistance. Am J Physiol Gastrointest Liver Physiol 2010;298:G440–G445 [DOI] [PubMed] [Google Scholar]
- 29.Han SI, Studer E, Gupta S, et al. Bile acids enhance the activity of the insulin receptor and glycogen synthase in primary rodent hepatocytes. Hepatology 2004;39:456–463 [DOI] [PubMed] [Google Scholar]
- 30.Jansen PL, van Werven J, Aarts E, et al. Alterations of hormonally active fibroblast growth factors after Roux-en-Y gastric bypass surgery. Dig Dis 2011;29:48–51 [DOI] [PubMed] [Google Scholar]
- 31.Patti ME, Houten SM, Bianco AC, et al. Serum bile acids are higher in humans with prior gastric bypass: potential contribution to improved glucose and lipid metabolism. Obesity (Silver Spring) 2009;17:1671–1677 [DOI] [PMC free article] [PubMed] [Google Scholar]
- 32.Cariou B, Chetiveaux M, Zaïr Y, et al. Fasting plasma chenodeoxycholic acid and cholic acid concentrations are inversely correlated with insulin sensitivity in adults. Nutr Metab (Lond) 2011;8:48. [DOI] [PMC free article] [PubMed] [Google Scholar]
- 33.Cohen RV, Pinheiro JC, Schiavon CA, Salles JE, Wajchenberg BL, Cummings DE. Effects of gastric bypass surgery in patients with type 2 diabetes and only mild obesity. Diabetes Care 2012;35:1420–1428 [DOI] [PMC free article] [PubMed] [Google Scholar]
- 34.Wood GC, Chu X, Manney C, et al. An electronic health record-enabled obesity database. BMC Med Inform Decis Mak 2012;12:45. [DOI] [PMC free article] [PubMed] [Google Scholar]
- 35.Proczko-Markuszewska M, Stefaniak T, Kaska L, Kobiela J, Sledziński Z. Impact of Roux-en-Y gastric bypass on regulation of diabetes type 2 in morbidly obese patients. Surg Endosc 2012;26:2202–2207 [DOI] [PMC free article] [PubMed] [Google Scholar]
- 36.Simonen M, Dali-Youcef N, Kaminska D, et al. Conjugated bile acids associate with altered rates of glucose and lipid oxidation after Roux-en-Y gastric bypass. Obes Surg 2012;22:1473–1480 [DOI] [PMC free article] [PubMed] [Google Scholar]
- 37.Song KH, Li T, Owsley E, Strom S, Chiang JY. Bile acids activate fibroblast growth factor 19 signaling in human hepatocytes to inhibit cholesterol 7alpha-hydroxylase gene expression. Hepatology 2009;49:297–305 [DOI] [PMC free article] [PubMed] [Google Scholar]
- 38.Kir S, Kliewer SA, Mangelsdorf DJ. Roles of FGF19 in liver metabolism. Cold Spring Harb Symp Quant Biol 2011;76:139–144 [DOI] [PubMed] [Google Scholar]
- 39.Blackstone R, Bunt JC, Cortes MC, Sugerman HJ. Type 2 diabetes after gastric bypass: remission in five models using HbA1c, fasting blood glucose, and medication status. Surg Obes Relat Dis 2012;8:548–555 [DOI] [PubMed] [Google Scholar]