Abstract
We recently published new reference growth charts for Japanese girls with Turner syndrome (TS) based on the cross-sectional data of 1,447 subjects beyond the secular trend of growth in Japan. This study was undertaken for their validation and, if necessary, modification before general application. For validation, 24 subjects who had data both at younger (≤5 yr) and older ages (≥13 yr) were used. We analyzed the concordance/discordance of their height standard deviation score (SDS) defined by the charts between the two age periods. For modification, the LMS method was used with 5,772 longitudinal measurements obtained both from the previously analyzed subjects and 118 newly recruited subjects who had been followed up at the National Center for Child Health and Development or Toranomon Hospital. Significant and critical discordance (mean difference, 1.95 SDS; 95% confidence interval (CI), 1.53–2.36; p<0.0001) was detected in height SDS. This prompted us to perform the modifications. A similar analysis using the modified charts revealed no significant discordance (mean difference, 0.27 SDS; 95%CI: –0.17 – 0.71; p=0.22). They seem more adequate for clinical applications for girls with TS born after 1970. New auxological standards for Japanese girls with TS were proposed.
Keywords: Turner syndrome, growth chart, secular trend, LMS method
Introduction
Turner syndrome (TS) is the most common chromosomal disorder in females and affects about one in 1,500 to 2,500 live-born female infants (1). One of the most significant features of the syndrome is short stature. Untreated females are reported to be approximately 20 cm shorter than normal females within their respective populations (2). Growth patterns of girls with TS are different from normal populations mainly because of the short stature homeobox-containing gene on the X chromosome (SHOX) haploinsufficiency and their ovarian insufficiency. TS-specific growth curves have been published in various countries (3,4,5) including Japan (6), and they have been clinically used for evaluation of statural growth.
The currently used growth charts for Japanese girls with TS (6) were constructed with subjects whose body sizes had been obtained from questionnaires sent to their follow-up hospitals. Since we are dealing with three sets of charts in this article, these will be called “the current charts [1992]” to avoid confusion. The data consisted of 6,255 measurements from 705 girls who were born between 1955 and 1989 (median unknown). Given the year of publication, the adult height for them had to be derived from subjects born before 1972. The secular trend in adult height has reached a plateau since approximately 1990 in Japan (7). Judging from the birth-year range, the current charts [1992] were constructed with data from subjects whose majority were born before the adult height reached the plateau. For evaluation of the statural growth in girls with TS in clinical settings, use of these charts has probably become invalid. Therefore, we produced new clinical reference growth charts, which will be called “the new charts [2009]”, based on cross-sectional data from 1,447 girls whose birth years ranged from 1970 to 2002, and after 1980 in 85.2%, following exclusion of measurements derived from those with presence of puberty at measurement, with previous growth promoting treatment or without cytogenetic evidence for TS (7, 8).
Though the new charts [2009] seem to be more adequate for evaluation of the growth of girls with TS born approximately after 1970 than the current charts [1992], they have some limitations derived mainly from selection bias. The analyzed data were obtained from those diagnosed as TS in medical institutions, which means that subjects who were not significantly smaller than normal populations are more easily missing. The heights of the majority of girls with TS usually drop below the 5th percentile for normal girls only after an age between two and five years (1). This implies that this kind of selection bias affects more severely in subjects younger than five years of age. In fact, relatively small girls in the TS population tended to undergo GH earlier, and relatively tall ones often suffered from short stature for many years before GH treatment (9). The purpose of this study is to validate the new charts [2009] especially focusing on the height standard under five years of age (validation study) and to modify them before their general application if necessary (modification study).
Subjects
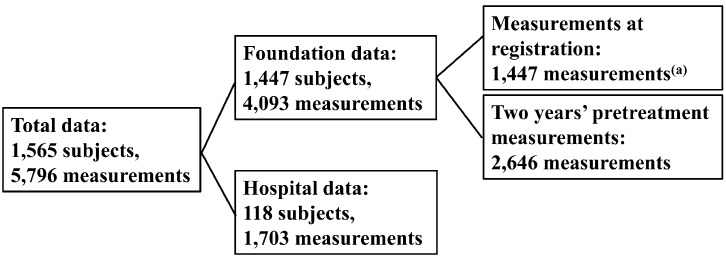
The samples were newly obtained from medical records at the National Center for Child Health and Development (NCCHD) and Toranomon Hospital. In this study, TS was defined as a karyotype that contains a cell line of monosomy lacking at least a distal major part in the short arm of the X chromosome. Between January 1980 and December 2008, 205 girls with TS born after 1970 visited one of the two hospitals. Among them, we excluded subjects with clear evidence of spontaneous pubertal signs in their medical records (37 subjects) or who had already been employed in the previous study for constructing the new charts [2009] (50 subjects). Finally, remaining 118 subjects were included in the present study, and auxological data consisting of 1,703 measurements before start of growth promoting treatments were collected whenever possible (Hospital data, Fig. 1). The age at diagnosis in these subjects ranged from 0.75 to 23.25 with a median of 9.33 yr of age. The number of subjects that had auxological data under five years of age was 89. The birth years of subjects ranged from 1970 to 2008 (median, 1984), and 64.0% of the subjects were born after 1980. For the validation study, we sampled subjects who had data for both younger (≤5 yr) and older (≥13 yr) ages from Hospital data because we wanted to know whether the new charts [2009] could be used over the whole course of growth. Twenty-four of the 118 subjects were selected for this purpose.
Fig. 1.
Total data for construction of the new charts with modification [2010] (5,772 measurements). Twenty-four outliers from 5,796 measurements were excluded for the final analysis. The new charts [2009] were constructed using 1,447 measurements (a) (7).
For establishment of new modified charts, which will be called “the new charts with modification [2010]”, we utilized both the above-mentioned data and the data of subjects included in the previous study (7, 8). The samples in the previous study were obtained from a database compiled by the Foundation for Growth Science, Japan. In the database, three years’ successive height data were available in many subjects, and we were able to collect auxological data consisting of 4,093 measurements (Foundation data, Fig. 1). In total, 5,796 measurements from 1,565 subjects were obtained for the modification study (Fig. 1). The data were cleaned in several stages. Bivariate plots of height and weight were used to identify gross disproportion. Data points were scrutinized, going back to the source data if necessary, and scriptural errors were corrected. In case a value was deemed highly unlikely (more than 5 SDS from the mean), the point was deleted even if there was no evidence of a scriptural error. In the course of the above data cleaning, 24 data were excluded because of highly unlikely measurements. The remaining data, 5,772 measurements from 1,565 subjects (their birth years are distributed from 1970 to 2006 with a median of 1985), were analyzed for the modification study. Body mass index (BMI) was calculated as the weight in kilograms divided by the square of the height in meters. Growth velocity (GV) was calculated as the annual height difference between two longitudinal measurements if the time interval of the data was between 0.5 and 1.5 yr. Perinatal information and their parents’ height were collected wherever possible. Birth length is 46.8 ± 2.7 cm (n=723), birth weight was 2.68 ± 0.44 kg (n=1,423) and target height was 158.0 ± 4.2 cm (n=1,366), which was very similar to the average adult height for Japanese females (157.9 cm) in 1990 (10). Target height was calculated by the formula fitted for the Japanese before the secular trend had reached a plateau (11). These auxological data were consistent with the previous study. Use of the retrospective data was approved by the medical ethics committees of the NCCHD.
Methods
The collected longitudinal height data (Hospital data) were calculated to age-specific standard deviation scores (SDS) using the new charts [2009]. We hypothesized that the height SDS values in infancy and early childhood defined by the new charts [2009] would be larger than those of the same subject at older ages if the new charts [2009] had significant bias in which shorter subjects were more preferentially included in the younger ages. To elucidate this hypothesis, longitudinal changes of height SDS values were investigated. The data of the twenty-four above-mentioned subjects were plotted in the new charts [2009], and the difference between the initial and later SDS value was compared (validation study). The initial SDS values meant the earliest data of the subjects, and the later values meant their last data.
To establish the new charts with modification [2010], the LMS method (12) was used with both Foundation and Hospital data (modification study). This assumes that the data can be transformed to normality by a suitable power transformation (L) and that the distribution is then summarized by the median (M) and coefficient of variation (S). The values of L, M and S are constrained to change smoothly with age, and fitted values can be used to construct any required centile curves. Using penalized likelihood, three curves (L, M and S) can be fitted as cubic splines by non-linear regression, and the extent of smoothing was controlled by equivalent degrees of freedom. Fitting and smoothing were done with lmsChartMaker Pro ver.2.3 (Medical Research Council, London, UK).
For statistical analysis in validation study, comparisons of difference in height SDS values between younger (≤5 yr) and older (≥13 yr) ages were assessed by paired t-test. To investigate the height difference between 45,X and non-45,X karyotypes, analysis of covariance (ANCOVA) was used with covariates of age and age-karyotype interaction. These analyses were performed using JMP 6.0.3 (SAS Institute Inc., Cary, NC, USA), and a p value less than 0.05 was considered statistically significant.
Results
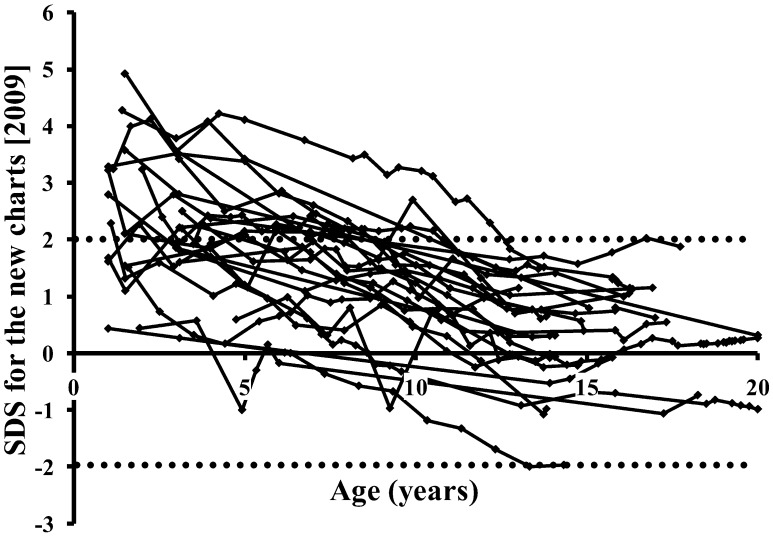
Longitudinal height SDS values of the 24 subjects in the validation study are plotted in Fig. 2. They increased to even above +2 SDS in many cases as age decreased. The initial SDS value was significantly and critically bigger than the later one (mean difference, 1.95; 95% confidence interval (CI), 1.53–2.36; p<0.0001). We considered that these mean differences of approximately two channels in the growth chart were not acceptable for clinical applications, as the projected adult heights in infancy would be significantly and seriously higher than their actual heights. Therefore, modification of the charts was considered to be essential.
Fig. 2.
Changes of longitudinal height SDS defined by the new charts [2009] (7) in the 24 subjects who had long-term data for early childhood (≤5 yr) through adolescence (≥13 yr).
For the modification study, Table 1 lists the number of subjects by age and origin of data. Table 2 summarizes the number of subjects according to their karyotypes. Heights in the 45,X subjects (n=463, 1,718 measurements) were a little but significantly taller than those in the non-45,X subjects (n=1,102, 4,054 measurements) (regression coefficient: 0.29 ± 0.087 cm, p<0.0001). When we performed a similar analysis according to the assumed number of SHOX gene copies, the heights in the subjects whose SHOX gene copy was definitely determined single (n=1,256, 4,598 measurements) were significantly smaller than those in the remaining subjects (n=309, 1,174 measurements; regression coefficient: –0.92 ± 0.11 cm, p<0.0001). As TS-specific growth curves published in various countries including Japan had been constructed with all karyotypes together, centile curves were fitted to the data all together using the LMS method.
Table 1. Age distribution of the numbers of measurements for constructing the new charts with modification [2010].
| Age (yr) | Height* | Weight/ BMI/ WFH | Growth velocity |
| 0 | 338 (1) | 319 | 58 |
| 1 | 240 (9) | 181 | 133 |
| 2 | 208 (14) | 122 | 153 |
| 3 | 364 (41) | 199 | 205 |
| 4 | 376 (74) | 189 | 234 |
| 5 | 393 (104) | 214 | 251 |
| 6 | 447 (105) | 227 | 240 |
| 7 | 469 (104) | 207 | 294 |
| 8 | 477 (113) | 202 | 329 |
| 9 | 557 (152) | 242 | 347 |
| 10 | 511 (160) | 231 | 341 |
| 11 | 413 (168) | 230 | 248 |
| 12 | 308 (131) | 179 | 177 |
| 13 | 209 (75) | 107 | 139 |
| 14 | 163 (68) | 89 | 95 |
| 15 | 117 (52) | 67 | 72 |
| 16 | 82 (38) | 49 | 43 |
| 17 | 42 (22) | 27 | 24 |
| 18 | 21 (11) | 18 | 10 |
| 19 | 14 (2) | 14 | 4 |
| 20+ | 23 (3) | 23 | 5 |
| Total | 5,772 (1,447) | 3,136 | 3,402 |
*Numbers in parentheses indicate those analyzed for constructing the new charts [2009] (7).
Table 2. Karyotypes of the 1,565 subjects recruited for construction of the new charts with modification [2010].
| Non-Mosaic | Number of subjects | Mosaic | Number of subjects | |
| Aneuploidy | 45,X | 463 | 45,X/46,XX | 96 |
| 45,X/47,XXX | 95 | |||
| 45,X/46,XY | 21 | |||
| 45,X/46,XX/47,XXX | 6 | |||
| 463 | 218 | |||
| Structural abnormality | 46,X,i(Xq) | 137 | 45,X/46,X,i(Xq) | 329 |
| 46,X,del(Xp) | 61 | 45,X/46,X,del(Xp) | 23 | |
| 46,X,r(X) | 3 | 45,X/46,X,r(X) | 119 | |
| others | 10 | 45,X/46,X,+mar | 121 | |
| others | 81 | |||
| 211 | 673 | |||
| Total | 674 | 891 |
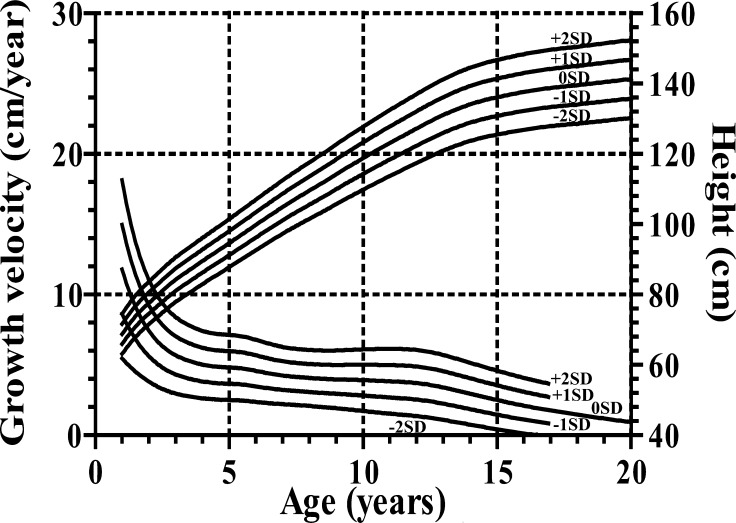
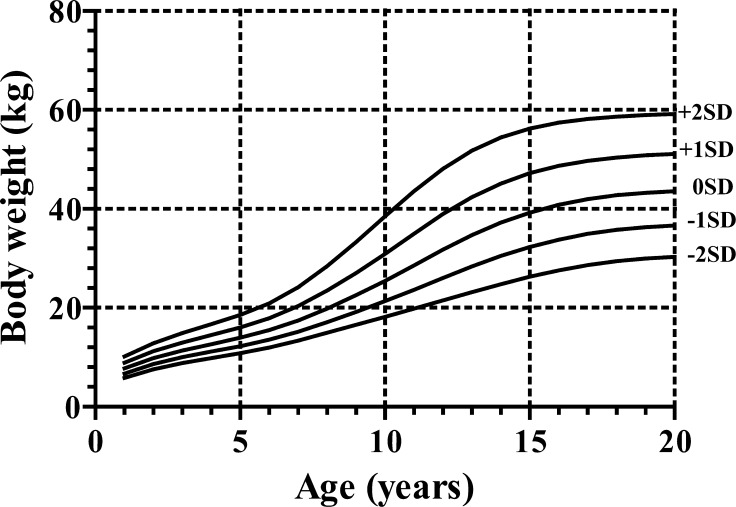
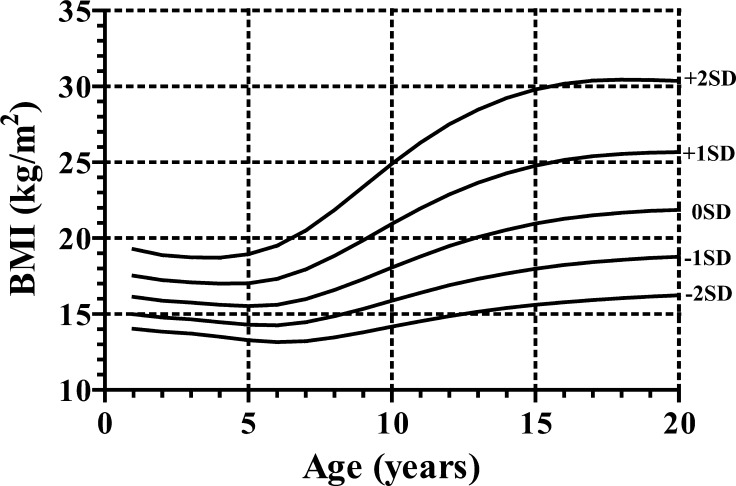
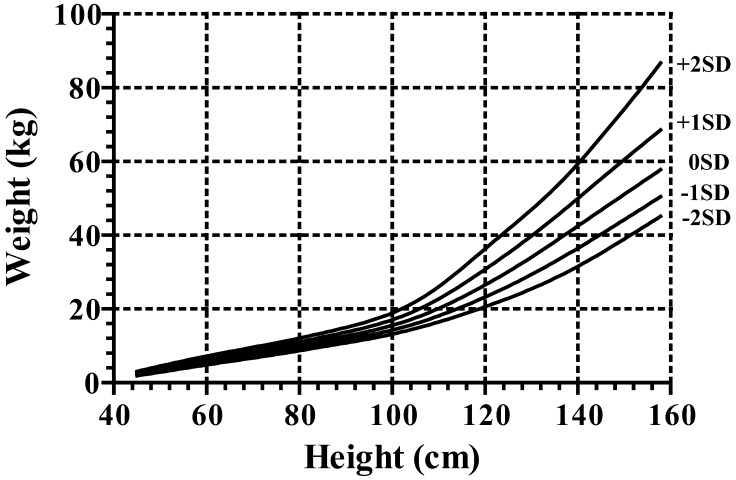
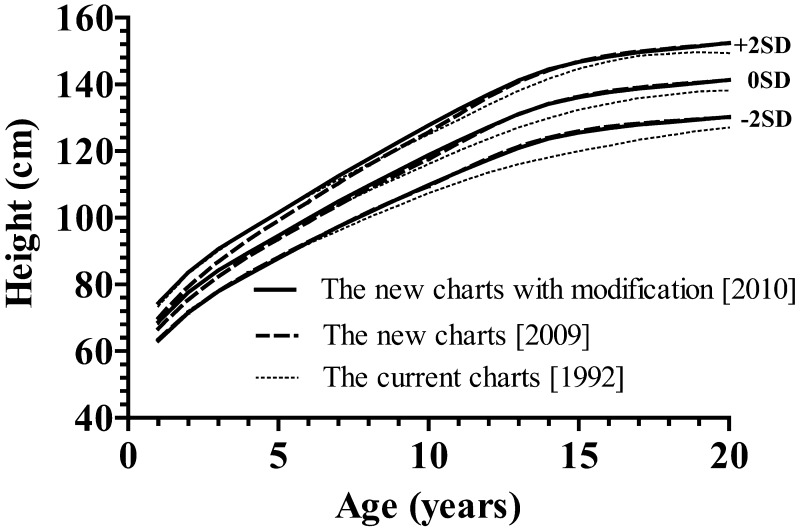
For height and growth velocity (GV), the distributions were generally assumed to be normal, while for weight, BMI and weight for height (WFH), there was appreciable skewness, and the age-varying power transformations were adjusted for them. Clinical growth references for height, GV, weight, BMI and WFH are shown in Appendices, Figs 1, 2, 3 and 4, respectively. Appendix Table 1 provides values for the mean and standard deviation of height and GV by age. Appendix Table 2 provides values for L, M and S of weight and BMI by age, and Appendix Table 3 shows each value of WFH by age. The new growth charts with modification [2010] for height are superimposed on both the new charts [2009] and the current charts [1992] in Fig. 3. The heights at older ages from the new charts with modification [2010] are taller than those from the current charts [1992] and as tall as those from the new charts [2009]. On the other hand, the heights in younger ages from the new charts with modification [2010] are taller than those from the new charts [2009] and as tall as the current charts [1992]. The similar validation study as mentioned above with the new charts with modification [2010] revealed no significant difference (mean difference, 0.27; 95%CI: –0.17 – 0.71; p=0.22).
Appendix, Fig. 1.
Height and growth velocity charts for Japanese girls with Turner syndrome.
Appendix, Fig. 2.
Weight charts for Japanese girls with Turner syndrome. It should be noted that the intervals between the neighboring lines are not equal because of the skewed distribution of weight.
Appendix, Fig. 3.
Body mass index (BMI) charts for Japanese girls with Turner syndrome. It should be noted that the intervals between the neighboring lines are not equal because of the skewed distribution of BMI.
Appendix, Fig. 4.
Weight for height (WFH) charts for Japanese girls with Turner syndrome. It should be noted that the intervals between the neighboring lines are not equal because of the skewed distribution of WFH.
Appendix Table 1. Mean and standard deviation (SD) of height and growth velocity for the Japanese girls with Turner syndrome.
| Height | Growth velocity | ||||
| Age (yr) | Mean | Standard deviation | Age (yr) | Mean | Standard deviation |
| 1 | 68.79 | 2.83 | 1 | 11.79 | 3.17 |
| 1.5 | 73.82 | 2.95 | 1.5 | 9.14 | 2.31 |
| 2 | 77.62 | 3.03 | 2 | 7.43 | 1.81 |
| 2.5 | 81.04 | 3.10 | 2.5 | 6.34 | 1.52 |
| 3 | 84.25 | 3.17 | 3 | 5.68 | 1.36 |
| 3.5 | 86.93 | 3.23 | 3.5 | 5.29 | 1.26 |
| 4 | 89.56 | 3.29 | 4 | 5.02 | 1.20 |
| 4.5 | 92.10 | 3.35 | 4.5 | 4.88 | 1.17 |
| 5 | 94.66 | 3.42 | 5 | 4.82 | 1.16 |
| 5.5 | 97.25 | 3.50 | 5.5 | 4.74 | 1.14 |
| 6 | 99.86 | 3.59 | 6 | 4.57 | 1.10 |
| 6.5 | 102.44 | 3.69 | 6.5 | 4.39 | 1.06 |
| 7 | 104.96 | 3.80 | 7 | 4.24 | 1.02 |
| 7.5 | 107.35 | 3.91 | 7.5 | 4.14 | 1.00 |
| 8 | 109.63 | 4.02 | 8 | 4.07 | 1.00 |
| 8.5 | 111.89 | 4.13 | 8.5 | 4.01 | 1.01 |
| 9 | 114.27 | 4.25 | 9 | 3.97 | 1.03 |
| 9.5 | 116.58 | 4.37 | 9.5 | 3.94 | 1.06 |
| 10 | 118.82 | 4.48 | 10 | 3.91 | 1.10 |
| 10.5 | 121.00 | 4.59 | 10.5 | 3.87 | 1.13 |
| 11 | 123.14 | 4.70 | 11 | 3.83 | 1.15 |
| 11.5 | 125.19 | 4.79 | 11.5 | 3.78 | 1.17 |
| 12 | 127.25 | 4.89 | 12 | 3.71 | 1.18 |
| 12.5 | 129.26 | 4.98 | 12.5 | 3.57 | 1.17 |
| 13 | 131.12 | 5.07 | 13 | 3.39 | 1.15 |
| 13.5 | 132.74 | 5.15 | 13.5 | 3.17 | 1.13 |
| 14 | 134.13 | 5.21 | 14 | 2.94 | 1.10 |
| 14.5 | 135.24 | 5.26 | 14.5 | 2.72 | 1.07 |
| 15 | 136.13 | 5.31 | 15 | 2.50 | 1.04 |
| 15.5 | 136.91 | 5.34 | 15.5 | 2.29 | 1.02 |
| 16 | 137.64 | 5.38 | 16 | 2.09 | 0.99 |
| 16.5 | 138.25 | 5.40 | 16.5 | 1.92 | 0.96 |
| 17 | 138.76 | 5.43 | 17 | 1.75 | |
| 17.5 | 139.19 | 5.45 | 17.5 | 1.60 | |
| 18 | 139.51 | 5.46 | 18 | 1.46 | |
| 18.5 | 139.99 | 5.49 | 18.5 | 1.31 | |
| 19 | 140.44 | 5.51 | 19 | 1.18 | |
| 19.5 | 140.90 | 5.53 | 19.5 | 1.05 | |
| 20 | 141.34 | 5.55 | 20 | 0.93 | |
Appendix Table 2. LMS values of weight and body mass index (BMI) for the Japanese girls with Turner syndrome.
| Weight | Body mass index | ||||||
| Age (yr) | L | M | S | Age (yr) | L | M | S |
| 1 | 0.26 | 7.74 | 0.14 | 1 | –1.51 | 16.14 | 0.08 |
| 1.5 | 0.09 | 8.90 | 0.14 | 1.5 | –1.48 | 15.99 | 0.08 |
| 2 | –0.04 | 9.83 | 0.13 | 2 | –1.46 | 15.89 | 0.08 |
| 2.5 | –0.14 | 10.65 | 0.13 | 2.5 | –1.44 | 15.82 | 0.08 |
| 3 | –0.23 | 11.38 | 0.13 | 3 | –1.42 | 15.75 | 0.08 |
| 3.5 | –0.30 | 12.03 | 0.13 | 3.5 | –1.40 | 15.69 | 0.08 |
| 4 | –0.37 | 12.66 | 0.13 | 4 | –1.38 | 15.62 | 0.08 |
| 4.5 | –0.43 | 13.29 | 0.13 | 4.5 | –1.36 | 15.56 | 0.08 |
| 5 | –0.48 | 13.95 | 0.13 | 5 | –1.34 | 15.53 | 0.09 |
| 5.5 | –0.54 | 14.67 | 0.14 | 5.5 | –1.32 | 15.55 | 0.09 |
| 6 | –0.59 | 15.47 | 0.14 | 6 | –1.29 | 15.62 | 0.10 |
| 6.5 | –0.64 | 16.38 | 0.14 | 6.5 | –1.27 | 15.77 | 0.10 |
| 7 | –0.68 | 17.43 | 0.15 | 7 | –1.24 | 15.99 | 0.11 |
| 7.5 | –0.71 | 18.60 | 0.15 | 7.5 | –1.21 | 16.27 | 0.11 |
| 8 | –0.72 | 19.86 | 0.16 | 8 | –1.18 | 16.59 | 0.12 |
| 8.5 | –0.72 | 21.17 | 0.16 | 8.5 | –1.14 | 16.94 | 0.12 |
| 9 | –0.69 | 22.54 | 0.17 | 9 | –1.09 | 17.31 | 0.13 |
| 9.5 | –0.63 | 23.96 | 0.18 | 9.5 | –1.05 | 17.69 | 0.13 |
| 10 | –0.56 | 25.45 | 0.18 | 10 | –1.00 | 18.07 | 0.14 |
| 10.5 | –0.47 | 26.99 | 0.19 | 10.5 | –0.95 | 18.45 | 0.14 |
| 11 | –0.37 | 28.57 | 0.20 | 11 | –0.89 | 18.81 | 0.14 |
| 11.5 | –0.27 | 30.17 | 0.20 | 11.5 | –0.84 | 19.16 | 0.15 |
| 12 | –0.17 | 31.74 | 0.20 | 12 | –0.79 | 19.48 | 0.15 |
| 12.5 | –0.07 | 33.25 | 0.20 | 12.5 | –0.74 | 19.79 | 0.15 |
| 13 | 0.02 | 34.68 | 0.20 | 13 | –0.70 | 20.07 | 0.16 |
| 13.5 | 0.10 | 36.01 | 0.20 | 13.5 | –0.66 | 20.33 | 0.16 |
| 14 | 0.17 | 37.21 | 0.20 | 14 | –0.62 | 20.56 | 0.16 |
| 14.5 | 0.23 | 38.30 | 0.19 | 14.5 | –0.58 | 20.77 | 0.16 |
| 15 | 0.29 | 39.26 | 0.19 | 15 | –0.55 | 20.97 | 0.16 |
| 15.5 | 0.33 | 40.11 | 0.19 | 15.5 | –0.51 | 21.13 | 0.16 |
| 16 | 0.38 | 40.84 | 0.18 | 16 | –0.48 | 21.28 | 0.16 |
| 16.5 | 0.41 | 41.46 | 0.18 | 16.5 | –0.46 | 21.41 | 0.16 |
| 17 | 0.44 | 41.97 | 0.18 | 17 | –0.43 | 21.51 | 0.16 |
| 17.5 | 0.46 | 42.40 | 0.17 | 17.5 | –0.40 | 21.60 | 0.16 |
| 18 | 0.48 | 42.75 | 0.17 | 18 | –0.38 | 21.68 | 0.16 |
| 18.5 | 0.50 | 43.03 | 0.17 | 18.5 | –0.36 | 21.74 | 0.16 |
| 19 | 0.51 | 43.26 | 0.17 | 19 | –0.34 | 21.79 | 0.16 |
| 19.5 | 0.52 | 43.43 | 0.17 | 19.5 | –0.32 | 21.84 | 0.16 |
| 20 | 0.53 | 43.57 | 0.17 | 20 | –0.30 | 21.87 | 0.16 |
Appendix Table 3. LMS values of weight for height (WFH) for the Japanese girls with Turner syndrome.
| Weight for height | |||
| Height (cm) | L | M | S |
| 45 | –0.60 | 2.39 | 0.12 |
| 50 | –0.61 | 3.55 | 0.11 |
| 55 | –0.63 | 4.72 | 0.10 |
| 60 | –0.64 | 5.84 | 0.10 |
| 65 | –0.66 | 6.90 | 0.09 |
| 70 | –0.68 | 7.95 | 0.09 |
| 75 | –0.70 | 9.01 | 0.08 |
| 80 | –0.73 | 10.15 | 0.08 |
| 85 | –0.76 | 11.36 | 0.08 |
| 90 | –0.80 | 12.6 | 0.08 |
| 95 | –0.85 | 13.94 | 0.08 |
| 100 | –0.91 | 15.56 | 0.09 |
| 105 | –0.98 | 17.61 | 0.10 |
| 110 | –1.01 | 20.16 | 0.11 |
| 115 | –0.95 | 23.16 | 0.13 |
| 120 | –0.78 | 26.52 | 0.14 |
| 125 | –0.54 | 30.14 | 0.15 |
| 130 | –0.32 | 34.06 | 0.15 |
| 135 | –0.23 | 38.24 | 0.16 |
| 140 | –0.36 | 42.52 | 0.16 |
| 145 | –0.66 | 46.82 | 0.16 |
| 150 | –1.01 | 51.10 | 0.16 |
| 155 | –1.36 | 55.37 | 0.15 |
Fig. 3.
Height charts for Japanese girls with Turner syndrome for comparison among the current charts [1992] (6), the new charts [2009] (7) and the new charts with modification [2010].
Discussions
Disease-specific growth charts are thought to be useful in predicting spontaneous growth pattern and can elucidate deviation due to additional disease (4, 13). Moreover, in the evaluation of growth promoting treatments, it is necessary to compare the growth pattern during treatment not only with that before treatment, but also with the spontaneous growth of untreated patients from the same population. The new growth charts [2009] had some limitations as discussed in a previously published paper (7). Briefly, in the previous study, the analyzed measurements were cross-sectional data obtained from the database at the start of GH treatment, and therefore, shorter subjects were more preferentially selected, especially at younger ages, because relatively short individuals with TS would be brought to the attention of a medical professional earlier and only individuals shorter than –2 SD would be registered for the eligible GH treatment. In this study, validation of the new charts [2009] was performed with longitudinal data (Hospital data), and we found significant and critical height SDS differences between younger (≤5 yr) and older ages (≥13 yr), indicating severe selection bias in the younger ages in the previous study. These significant differences were considered to be unacceptable in clinical practice for evaluation of height in TS and effects of growth promoting treatments. If the predicted adult height would be taller than the actual adult height by as much as 1.95 SDS, we could not evaluate growth promoting treatments. For example, in a Canadian randomized study (14), the effect of GH supplementation was additional gain of 1.3 SDS (95%CI, 1.1–1.5) for the TS-specific growth chart. Thus, the new charts [2009] were considered inappropriate for clinical practice, and modifications of the new charts were mandatory.
In this study, we modified the charts by utilizing both cross-sectional and longitudinal data because the most defective points of the new charts [2009] were derived from the fact that they were established from cross-sectional data which allowed severe selection bias. The data of relatively tall girls with TS were not included in infancy and childhood, especially for girls younger than five years of age. In total, 5,772 measurements from 1,565 subjects (their birth years are distributed from 1970 to 2006 with a median of 1985) were used. The amount of data analyzed in this study was sufficient, being comparable to amounts analyzed in construction of other TS-specific charts. All subjects were confirmed by chromosomal analyses to meet the definition of TS and were properly selected for analysis, excluding subjects who had undergone pubertal development or previous growth-promoting treatment or both. Furthermore, the similar validation study as mentioned above using the new charts with modification [2010] revealed no significant difference. The new charts with modification [2010] seem more adequate for clinical applications. We believe that these charts have been adequately and successfully produced taking these points into consideration.
Differences can be detected among the three charts (Fig. 3). For example, the adult heights from the current charts [1992], the new charts [2009] and the new charts with modification [2010] are 138.2 cm, 141.2 cm and 141.3 cm, respectively, when adult height is defined as the mean height at the age of 20 yr. These results seem attributable to the secular trend observed during this same period in Japanese women, as discussed in a previous paper (7). On the other hand, the new charts with modification [2010] in childhood (≤5 yr) are different from the new charts [2009] but close to the current used charts [1992]. The standard heights of Japanese girls at three years of age in 1960, 1970, 1980, 1990 and 2000 were 90.7 cm, 93.0 cm, 93.9 cm, 94.0 cm and 93.7 cm, respectively (10), and at five years of age, they were 103.3 cm, 106.2 cm, 107.1 cm, 107.9 cm and 107.6 cm, respectively (10). This indicates that the secular trend in height at three and five years of age has reached almost a plateau in approximately 1980 in Japan, and children born in around 1975 and after have fairly constant heights at three or five years of age. Considering the current charts [1992] were established from 705 girls who were born between 1955 and 1989 (median unknown) and were published in 1992 (7), the average course in younger ages is likely lifted up by the subjects born after around 1975. Thus, it is reasonable that the secular trend is not detectable in younger ages between the current charts [1992] and the new charts with modification [2010], although we cannot completely deny minor contribution of selection bias which still remained after the modification process. Accordingly, we believe that the new charts with modification [2010] have been adequately produced and overcome both secular trends and selection bias at younger ages.
There are two limitations to the present study. The first one is the number of study samples. The number of the older children, especially over sixteen years, was small. This limitation is shared by all other recently established reference charts. It has become more difficult to obtain height data from subjects without accompanying growth-promoting treatment because GH treatment for girls with TS has become very common in many countries including Japan, and furthermore, its starting age has been decreasing (9). Despite this limitation, the adult height in this study is –3.3 SDS of the normal population (15) and is considered to be valid by comparison to adult height SDSs reported in other countries (–4.2 to –2.5 SDS) (2). The second limitation is that we do not know whether the subjects without puberty at younger ages in this study will or will not develop spontaneous puberty later. It has been reported that those with spontaneous puberty are significantly taller than those without puberty from 12 yr of age onward, although pubertal growth spurt does not seem to affect final adult height (5). Theoretically, two types of growth charts may be needed during the peripubertal period, but we produced one specific for girls without pubertal signs because of the limited number of pubertal subjects. However, when we plotted the data from all 144 subjects (107 subjects from Foundation data and 37 subjects from Hospital data) with pubertal development on the new charts with modification [2010], they were distributed within ± 2 SDS of the other subjects’ data with only five exceptions (data not shown). This finding justifies the use of the new charts with modification [2010] for all girls with TS born after 1970 irrespective of later development of puberty.
In conclusion, we have proposed new auxological standards for Japanese girls with TS using 5,772 measurements from 1,565 subjects who did not present puberty. As these charts have overcome the issues of both secular trends and selection bias at younger ages as far as possible, they are expected to be widely used in various clinical settings and for research purposes.
Acknowledgments
We thank all the patients and doctors for the registration into this retrospective cohort. This study was partly supported by a grant from the Foundation for Growth Science, Japan.
Appendices.
These figures should not be reproduced without permission.
References
- 1.Saenger P. Turner’s syndrome. N Engl J Med 1996;335: 1749–54 [DOI] [PubMed] [Google Scholar]
- 2.Ranke MB, Grauer ML. Adult height in Turner syndrome: results of multinational survey 1993. Horm Res 1994;42: 90–4 [DOI] [PubMed] [Google Scholar]
- 3.Lyon AJ, Preece MA, Grant DB. Growth curve for girls with Turner syndrome. Arch Dis Child 1985;60: 932–5 [DOI] [PMC free article] [PubMed] [Google Scholar]
- 4.Rongen-Westerlaken C, Corel L, Broeck JVD, Broeck JVD, Massa G, Karlberg J, et al. Reference values for height, height velocity and weight in Turner’s Syndrome. Acta Paediatr 1997;86: 937–42 [DOI] [PubMed] [Google Scholar]
- 5.Massa G, Vanderschueren-Lodeweyckx M, Malvaux P. Linear growth in patients with Turner syndrome: influence of spontaneous puberty and parental height. Eur J Pediatr 1990;149: 246–50 [DOI] [PubMed] [Google Scholar]
- 6.Suwa S. Standards for growth and growth velocity in Turner’s syndrome. Acta Paediatr Jpn 1992;34: 206–20 [DOI] [PubMed] [Google Scholar]
- 7.Isojima T, Yokoya S, Ito J, Horikawa R, Tanaka T. New reference growth charts for Japanese girls with Turner syndrome. Pediatr Int 2009;51: 709–14 [DOI] [PubMed] [Google Scholar]
- 8.Isojima T, Yokoya S, Ito J, Horikawa R, Tanaka T. Inconsistent determination of overweight by two anthropometric indices in girls with Turner syndrome. Acta Paediatr 2009;98: 513–8 [DOI] [PubMed] [Google Scholar]
- 9.Isojima T, Yokoya S, Ito J, Horikawa R, Tanaka T. Trends in age and anthropometric data at start of growth hormone treatment for girls with Turner syndrome in Japan. Endocr J 2008;55: 1065–70 [DOI] [PubMed] [Google Scholar]
- 10.Ministry of Education: Annual report of school health statistics. Tokyo: The Printing Office, The Ministry of Finance; 2005. (in Japanese). [Google Scholar]
- 11.Ogata T, Matsuo N, Tamai S, Osano M, Tango T. Target height and target range for the Japanese. Jpn J Paediatr 1990;94: 1535–40(in Japanese). [Google Scholar]
- 12.Cole TJ, Green PJ. Smoothing reference centile curves: the LMS method and penalized likelihood. Stat Med 1992;11: 1305–19 [DOI] [PubMed] [Google Scholar]
- 13.Ranke MB. Disease-specific standards in congenital syndromes. Horm Res 1996;45(Suppl 2): 35–41 [DOI] [PubMed] [Google Scholar]
- 14.The Canadian growth hormone advisory committee.Impact of growth hormone supplementation on adult height in Turner syndrome: results of the Canadian randomized controlled trial. J Clin Endocrinol Metab 2005;90: 3360–6 [DOI] [PubMed] [Google Scholar]
- 15.Suwa S, Tachibana K. Standard growth charts for height and weight of Japanese children from birth to 17 years based on a cross-sectional survey of national data. Clin Pediatr Endocrinol 1993;2: 87–97 [Google Scholar]


