

Abstract
Excess iron is associated with hepatic damage and diabetes in humans, although the detailed molecular mechanisms are not known. To investigate how iron regulates glucose homeostasis, we fed C57BL/6J male mice with high-iron (HI) diets (2 or 20 g Fe/kg chow). Mice fed an HI diet exhibited elevated AMP-activated protein kinase (AMPK) activity and impaired insulin signaling in skeletal muscle and liver. Consistent with the increased AMPK activity, glucose uptake was enhanced in mice fed an HI diet. The effects of improved glucose tolerance induced by HI feeding were abolished in transgenic mice with expression of muscle specific dominant-negative AMPK. Glucose output was suppressed in the liver of wild-type mice fed an HI diet, due to decreased expression of gluconeogenic genes and decreased substrate (lactate) from peripheral glycolysis. Iron activated AMPK by increasing deacetylase and decreasing LKB1 acetylation, in turn stimulating the phosphorylation of LKB1 and AMPK. The effects of HI diet were abrogated by treatment of the mice with N-acetyl cysteine, suggesting a redox-dependent mechanism for increasing deacetylase activity. In addition, tissue from iron-fed mice exhibited an elevated AMP/ATP ratio, further contributing to AMPK activation. In summary, a diet high in iron improves glucose tolerance by activating AMPK through mechanisms that include deacetylation.—Huang J., Simcox, J., Mitchell, T. C., Jones, D., Cox, J., Luo, B., Cooksey, R. C., Boros, L. G., McClain, D. A. Iron regulates glucose homeostasis in liver and muscle via AMP-activated protein kinase in mice.
Keywords: AMPK, insulin signaling, acetylation
Iron plays a critical role in numerous biological pathways. It is a key factor in the reduction-oxidation (redox) reactions of oxidative phosphorylation in the respiratory chain and in the binding of oxygen to hemoglobin and myoglobin. The biological significance of iron largely depends on its transition ability, which, in biological systems, often involves the 1-electron redox reactions between its ferric (3+) and ferrous (2+) forms. In addition to its beneficial properties, free reduced iron is also toxic because of its participation in Fenton redox chemistry: Reduced iron reacts with hydrogen peroxide (H2O2) or lipid peroxides to produce highly reactive radicals that can damage lipids, proteins, and nucleic acids.
A large body of evidence demonstrates that iron overload is associated with development of cirrhosis and diabetes in humans (1–5), although the molecular mechanisms by which iron affects intracellular signaling and homeostatic systems are not fully understood. Many studies of iron-associated cirrhosis and diabetes have focused on hereditary hemochromatosis (HH), a genetic disease characterized by iron overload of many tissues (6). The majority of patients with HH have mutations in the HFE gene (7). Recent studies have reported that the prevalence of diabetes in adults with HH is 13–23% and that of impaired glucose tolerance is 15–30%, which represents a 2- to 4-fold increase over a comparable reference population of Northern European descent (5, 8). Mice with targeted deletion of the Hfe gene (Hfe−/−) recapitulate the biochemical abnormalities and histopathology of human HH (9). Insulin secretion, for example, is decreased both in Hfe−/− mice (10) and in human HH subjects (5). Increased gluconeogenesis and metabolic inflexibility in Hfe−/− mice also contribute to the risk of diabetes (3). These defects, however, are well compensated in Hfe−/− mice, as evidenced by improved rather than impaired glucose tolerance (11).
We have shown previously that AMP-activated protein kinase (AMPK) signaling was activated in Hfe−/− mice (11). AMPK controls energy balance at the cellular and organismal levels (12). AMPK is a sensor of cellular energy status and is activated by an elevated ratio of AMP or ADP to ATP (13). A large variety of hormonal signals and metabolic stresses, such as glucose deprivation, ischemia, hypoxia, oxidative stress, and hyperosmotic stress, activate AMPK, although not all of these signal through an increased cellular AMP:ATP and/or ADP:ATP ratio (12, 14). Activated AMPK stimulates glucose uptake and fatty acid oxidation in peripheral tissues and suppresses gluconeogenesis in liver, pathways that play important roles in the pathogenesis and treatment of diabetes (15).
In our previous study of AMPK signaling in Hfe−/− mice (11), the causality between the effects of iron and AMPK were not established, nor were the pathways fully explicated that linked those effects to changes in metabolism. Furthermore, important differences are apparent in the distributions of tissue iron in HH compared to dietary iron overload (16) and in the phenotypes resulting from these two sources of iron overload (17). Because dietary iron overload is a more important risk factor for diabetes in the general population than HH, we therefore also sought to determine whether the same effects of iron as were observed in HH would be seen in mice fed high-iron (HI) diets. Here we show that iron affects glucose tolerance in mice through its activation of AMPK in liver and muscle through mechanisms that include LKB1 deacetylation.
MATERIALS AND METHODS
Experimental animals
C57/Bl6J wild-type (WT) mice (3 mo old) were fed a normal chow (NC) diet or an HI diet for 2 mo. Normal chow (Harlan Teklad TD-8656; Harlan Bioproducts, Indianapolis, IN, USA) contains 4.5% of calories as fat and 0.5 g/kg of carbonyl iron. The moderately high iron (MHI) and HI diets contain 4.5% of calories as fat and either 2 or 20 g/kg of carbonyl iron. An additional group of mice fed a low-iron (LI) diet (4–6 mg/kg chow) were used in the stable isotope studies. Mice with muscle-specific expression of a dominant-negative AMPK were kindly provided by Morris Birnbaum (University of Pennsylvania, Philadelphia, PA, USA). Procedures were approved by the Institutional Animal Care and Use Committee of the University of Utah.
Quantification of transcript levels by RT-PCR
Quantitative RT-PCR was performed with a Light Cycler (Roche Diagnostics, Basel, Switzerland) as described previously (11). The following primers were used (designed using Primer3 software; http://www.simgene.com): phosphoenolpyruvate carboxykinase (Pepck), 5′-TTGGAGAGAATGCTCGTGTG and 5′-TGGAGAACAGCTGACTGGTG; glucose-6-phosphatase (G6Pase), 5′-AGGAAGGATGGAGGAAGGAA and 5′-TGGAACCAGATGGGAAAGAG; transferrin receptor 1 (Tfrc), 5′-CAGTCCAGCTGGCAAAGATT and 5′-GTCCAGTGTGGGAACAGGTC; and ribosomal protein L13a (Rpl13a), 5′-GGAGAAACGGAAGGAAAAGG and 5′-ACAGGAGCAGTGCCTAAGGA. Messenger RNA levels of specific genes were normalized to Rpl13a levels for the same sample. Rp113a normalized to the cDNA template amount did not show any variation with chow iron content.
Tissue nonheme iron determination
Tissue nonheme iron was quantified as described previously (18). Briefly, after digestion in trichloroacetic acid at 65°C, tissue extracts were added to the chromogen reagent containing bathophenanthroline sulfonate. Optical density was read at 535 nm and compared to iron standards.
Ex vivo glucose uptake into isolated soleus muscle
2-Deoxy-d-glucose uptake was measured as described previously (19).
Glucose and pyruvate tolerance testing
After 6 h of food withdrawal, mice were injected intraperitoneally with 1 mg/g body weight of glucose in 0.9% saline. Glucose levels were measured from tail vein blood with a glucometer (Elite; Bayer Corp., Tarrytown, NY, USA) at 0, 5, 15, 30, 60, and 120 min. Extra tail blood (30 μl) was collected at 0 and 30 min for insulin measurement. For pyruvate tolerance testing, after overnight food withdrawal, blood glucose was measured with a glucometer before and after intraperitoneal injection of sodium pyruvate (2 mg/g body weight) at 0, 5, 15, 30, 60, and 120 min.
Stable isotope tracer studies
Stable isotope studies were performed as described previously (11).
Deacetylase activity
Tissue deacetylase activity was measured in nuclear extracts using an assay kit from Enzo Life Sciences (Farmingdale, NY, USA).
Measurement of AMP and ATP
Approximately 20 mg of frozen tissue was transferred to chilled (−20°C) bead mill tubes containing 1.4-mm ceramic beads. Cold (−20°C) 90% methanol (500 μl) containing the internal standard NAD (1 mg/ml) was added, and the tubes were placed into a Omni BeadRuptor 24 (Omni International, Kennesaw, GA, USA) and homogenized at 6.5 m/s2 for 30 s. These tubes were then incubated for 60 min at −20°C and centrifuged (4°C) for 10 min at 20,000 g to precipitate the proteins. The supernatant was reserved, and a second extraction step was performed in the same manner as the first but with 60% methanol (−20°C). The supernatants were combined and vacuum dried.
Two Shimadzu LC10AD VP pumps and a CTO-10AS column oven (Shimadzu Corp., Kyoto, Japan) were used for HPLC separation. Detection was accomplished using a PE Sciex 365 triple-quadrupole mass spectrometer (Perkin Elmer Sciex, Framingham, MA, USA) modified with an Ionics EP10+ source (Ionics, Bolton, ON, Canada). Prior to LC-MS analysis to each dried sample was added 48 μl of 10 mM sodium phosphate buffer (pH 7.0) followed by 2 μl of 2-vinylpyridine. The sample was allowed to incubate at room temperature for 30 min, followed by the addition of 50 μl of 20 mM ammonium formate buffer (pH 9.2) containing 7.5 mM N-butyl amine. After centrifuging at 20,000 g for 5 min, 20 μL of each sample was injected onto a Phenomenex Gemini-NX C18 (150×3mm; 3 μm particle size, 110A pore size; Phenomenex, Torrance, CA, USA) fitted with a Phenomenex security guard precolumn. For HPLC separation, solvent A contained 20 mM ammonium formate and 7.5 mM N-dibutylamine in ultrapure water, and solvent B contained 7.5 mM N-dibutlyamine in MS-grade methanol. The initial column conditions were 5% B for 3 min, followed by a gradient elution to 90% B over 20 min. This was held for 1 min, then brought back to 5% B over 2 min. The column was then equilibrated for an additional 10 min. Data were recorded using Analyst 1.4.2 software (Sciex) with final peak heights recorded in Excel (Microsoft, Redmond, WA, USA). Data were normalized to weight and internal standard.
Tissue culture
Mouse C2C12 myoblast cells were grown in MEMα (Invitrogen, Carlsbad, CA, USA) plus 10% fetal bovine serum and 1% penicillin/streptomycin/glutamine. Myoblast differentiation was induced by 2% heat-inactivated horse serum at ∼70% confluence. The induction medium was changed every other day for 4 consecutive days. Differentiated C2C12 myotube cells were treated overnight with various concentrations of ferrous sulfate. After 2 h incubation, cells were washed with PBS and harvested.
Western blotting
Age-matched (5 mo) male mice were euthanized. Hindlimb muscle and liver were collected, and tissue homogenates were prepared for Western blot analysis. Levels of total and/or phosphorylated proteins were detected by immunoblotting using the following antibodies: acetyl-CoA carboxylase (ACC; Ser79; Cell Signaling Technology, Danvers, MA, USA), AMPK (Thr172; Cell Signaling Technology), ferritin (Abcam, Cambridge, MA, USA), p53-Lys382 (Cell Signaling Technology), Akt (Cell Signaling Technology), and IRS2 (Abcam). Signals quantified by densitometry were normalized to glyceraldehyde-3-phosphate dehydrogenase (GAPDH) levels (Santa Cruz Biotechnology, Santa Cruz, CA, USA) or, in the case of pAMPK, to total AMPK protein.
Statistical procedures
Descriptive statistics are presented as averages ± sem. A 2-tailed Student's t test was used to compare the differences between groups.
RESULTS
AMPK is activated by excess iron in muscle
We first determined whether skeletal muscle of mice fed an HI diet (20 g Fe/kg) accumulated excess iron. Ferritin, a marker for tissue iron stores, was increased 2.1-fold in skeletal muscle from mice fed an HI diet compared to control mice fed an NC diet (500 mg Fe/kg; NC=0.48±0.16, HI=0.98±0.11 arbitrary density units, n=4/group, P<0.05; Fig. 1A). The Western blots were normalized to GAPDH, and although iron deficiency up-regulates that protein, iron excess has been shown to have no effect on GAPDH expression (20). Consistent with that finding, we saw no systematic variation of GAPDH mRNA levels in our Western blots (see figures), whose gels were also normalized by equal protein loading.
Figure 1.
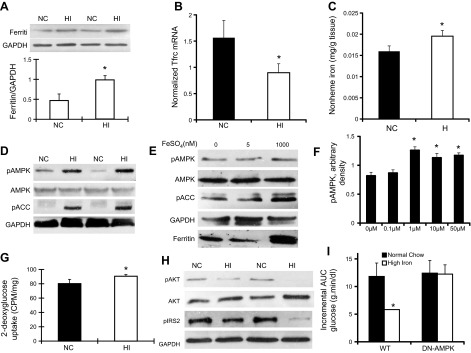
Iron activates AMPK and leads to increased glucose uptake in skeletal muscle of C57BL/6J male mice fed an HI diet. A) Hindlimb muscle was collected from age-matched (5-mo-old) male WT mice fed an NC diet (500 mg Fe/kg) or an HI diet (20 g Fe/kg). Ferritin and GAPDH were detected by Western blotting (n=4). Densitometric data from 4 independent data points were normalized to GAPDH and quantitated for statistical analysis (see text). *P < 0.05). B) Normalized Tfrc mRNA levels were determined in skeletal muscle of mice fed NC or HI diets (n=18/group). *P < 0.001. C) Tissue nonheme iron levels were determined in skeletal muscle of mice fed NC or HI diets (n=18/group). *P < 0.05. D) Skeletal muscle from WT mice fed NC or HI diets were analyzed by Western blotting for activated pAMPK, total AMPK, pACC, and GAPDH (n=3–4; P<0.01 for pAMPK, P=0.02 for pACC). E) C2C12 cells were differentiated into myoblasts and cultured in iron-free MEMα (n=3, P<0.05). Extracts of C2C12 cells grown in different iron concentrations overnight were prepared for Western blot analysis of pAMPK, total AMPK, pACC, and GAPDH. F) Dose response of pAMPK as a function of medium iron concentration. Cells were treated as in E (n=4/group). *P < 0.01. G) Soleus muscle from 5-mo-old male WT mice fed HI or NC diets was incubated with 2-[3H] deoxy-d-glucose in the presence of 13.3 nM insulin. Results for glucose uptake are corrected for extracellular tissue absorption using mannitol and normalized to muscle weight (n=6–8). *P < 0.05). H) Skeletal muscles from WT mice fed NC or HI diets were analyzed by Western blotting for pAKT, total AKT, pIRS2, and GAPDH (n=4–5 for pAKT, P<0.05; n=4 for pIRS2, P=0.16). I) Control C57BL/6J WT mice, or mice with expression of dominant-negative AMPK (AMPK-DN) in skeletal muscle, were either maintained on NC diet or fed an HI diet for 8 wk. Intraperitoneal glucose tolerance testing was then performed, and area under the curve (AUC) for glucose was calculated (n=11–12, P=0.89 for AMPK-DN mice). *P < 0.05.
Ferritin represents a sequestered pool of iron with very little turnover, so to verify that iron fluxes remain high in muscle from mice fed the HI diet, we also measured transcript levels of the transferrin receptor Tfrc. Tfrc mRNA contains iron-responsive elements (IREs) in its 3′ untranslated region that result in decreased Tfrc mRNA levels as intracellular bioavailable iron levels increase (21). Tfrc transcript levels decreased by 47% in muscle from mice fed the HI diet (P < 0.001; Fig. 1B). Finally, we directly assessed nonheme iron levels in muscle, and they were increased by 22% in skeletal muscle from mice fed the HI chow (P<0.05; Fig. 1C).
The phosphorylated form of AMPK was increased 2.7-fold in muscle from mice fed the HI diet (20 g Fe/kg; NC=4.06±0.33, HI=10.80±1.36 arbitrary density units, n=4/group, P<0.01; Fig. 1D). We confirmed activation of AMPK by examining phosphorylation of an AMPK downstream target, ACC. ACC also showed a 3.1-fold increase in phosphorylation in muscle (pAMPK: NC=4.1±0.6, HI=10.8±1.4 arbitrary density units, P<0.01; pACC: NC=5.0±0.5, HI=15.9±3.0 arbitrary density units, P=0.02; n=3–4/group; Fig. 1D). More modest elevations of dietary iron (2g Fe/kg, compared to NC, 500 mg Fe/kg) could also activate AMPK. The phosphorylated forms of AMPK and ACC were increased by 1.8- and 5.4-fold, respectively, in skeletal muscle from mice fed the MHI diet (2 g Fe/kg, P<0.05; Supplemental Fig. S1).
To further demonstrate that activation of AMPK was induced directly by iron rather than hormonal or indirect metabolic effects of iron, cultured and differentiated C2C12 myotubes were treated with different concentrations of iron, and phosphorylation of AMPK was examined by Western blotting. At 1 μM FeSO4, levels of pAMPK and pACC were increased by 1.25- and 3.0-fold, respectively, compared to C2C12 myotubes cultured in iron-free MEMα (pAMPK: iron-free=8.0±0.5, 1 μM FeSO4=10.0±0.4 arbitrary density units, P<0.05; pACC: iron-free=9.8±1.5, 1 μM FeSO4=29.8±9.4 arbitrary density units, P=0.02; Fig. 1E). Dose-response analysis revealed no significant stimulation at 100 nM FeSO4 and maximal stimulation at 1 μM FeSO4 (Fig. 1F). A time-course study revealed no increase of AMPK at 1 h, but near maximal stimulation at 4 h that was maintained through 12 h (not shown). We determined nonheme iron levels in the cells, and they were increased 3.9-fold in the iron-treated cells (1.38±0.10 vs. 0.35±0.05 arbitrary units normalized to cell number, n=4/group, P=0.0001).
Glucose uptake is increased despite decreased insulin signaling in muscle of mice fed an HI diet
Isolated soleus muscles from mice fed the HI diet exhibited a significant increase in 2-deoxyglucose uptake after insulin stimulation compared to control mice fed the NC diet (NC=80.2±6.0, HI=90.5±2.3 cpm/mg, P<0.05; Fig. 1G). The augmentation of glucose uptake was not explained by increased insulin signaling; rather, phosphorylation of AKT and its downstream target IRS2 were decreased by 60% (NC=0.52±0.11, HI=0.21±0.05 arbitrary density units, n=4–5/group, P<0.05) and 53% (NC=0.69±0.16, HI=0.32±0.15 arbitrary density units, n=4/group, P=0.16), respectively, in skeletal muscle of mice fed the HI diet compared to control mice fed the NC diet (Fig. 1H).
AMPK mediates the effects of iron on glucose homeostasis in vivo
In order to prove that AMPK activation mediates iron-regulated glucose homeostasis in vivo, we fed the HI diet (20 g Fe/kg) to mice expressing a dominant-negative AMPK (AMPK-DN) in skeletal muscle. WT mice fed the HI diet for 8 wk exhibited a 51% decrease in the incremental area under the curve for glucose (AUCG) after intraperitoneal glucose challenge (NC=11.8±2.4, HI=5.8±0.1 g·min/dl, n=4/group, P<0.05; Fig. 1I). AMPK-DN mice, by contrast, showed no augmentation of glucose uptake after 8 wk of HI diet (NC=12.4±2.2, HI=12.2±1.7 g·min/dl, n=3–4/group, P=0.95; Fig. 1I). The same pattern was seen with total AUCG as with incremental AUCG, namely a statistically significant decrease in AUCG in WT mice fed the HI diet but no difference in the AMPK-DN mice (not shown).
AMPK is activated by iron in liver
We also examined AMPK activity in liver. We first confirmed that liver in mice fed the HI diet was iron overloaded. Ferritin was elevated by 3.8-fold in liver from mice fed the HI diet compared to mice fed the NC diet (NC=20.7±1.0, HI=5.4±1.7 arbitrary density units, n=3–4/group, P<0.001; Fig. 2A). The phosphorylated form of AMPK was increased 1.9-fold (NC=0.42±0.03, HI=0.83±0.11 arbitrary density units, n=3–4/group, P<0.05) and ACC was increased 2.0-fold (NC=0.22±0.06, HI=0.43±0.08 arbitrary density units, n=3–4 /group, P=0.11) in liver from mice fed the HI diet (Fig. 2B).
Figure 2.
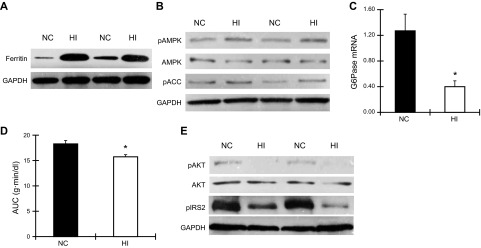
Iron activates AMPK in liver and suppresses gluconeogenesis of male C57BL/6J mice fed an HI diet. A) Liver was collected from age-matched (5-mo-old) WT mice fed an NC or HI diet. Ferritin and GAPDH were detected by Western blotting (n=3–4, P<0.001). B) Liver from WT mice fed an NC or HI diet was analyzed by Western blotting for pAMPK, total AMPK, pACC, and GAPDH (n=3–4; P<0.05 for pAMPK and P=0.11 for pACC). C) Expression of mRNA for the gluconeogenesic gene G6pase in liver of WT mice fed an NC or HI diet was examined by quantatitive RT-PCR (n=4). *P < 0.05. D) Pyruvate tolerance testing of WT mice fed an NC or HI diet was performed by measuring blood glucose after injection of 2 mg pyruvate/g body weight. AUC for glucose was calculated (n=4–5). *P < 0.05. E) Liver from mice fed an NC or HI diet was analyzed by Western blotting for pAKT, total AKT, pIRS2, and GAPDH. (n=3–4; P=0.001 for pAKT, P<0.001 for pIRS2).
Decreased hepatic glucose output in liver of mice fed an HI diet despite decreased insulin signaling
Because AMPK is known to suppress hepatic gluconeogenesis, we examined gluconeogenesis-related gene expression in liver by quantitative RT-PCR. G6Pase mRNA was decreased by 70% (P<0.05; Fig. 2C), and Pepck mRNA level was decreased by 25% although not significantly (P=0.14, data not shown). We further confirmed decreased gluconeogenesis by performing pyruvate tolerance testing. Mice fed the HI diet exhibited a 14% decrease in AUCG after intraperitoneal pyruvate challenge (P<0.05; Fig. 2D).
We next examined hepatic glucose metabolism using stable isotope-based dynamic metabolic profiling (SiDMAP) tracer studies. Intraperitoneal glucose tolerance testing was performed using [U-13C6]-d-glucose. Consistent with the data above, mice fed the HI diet exhibited a 13% decrease in hepatic glucose output compared with mice fed the NC diet (P=0.05; Table 1) and a 15.8% decrease compared with mice fed the LI diet (P<0.05; Table 1). Because intracellular lactate is one of the precursors contributing to hepatic glucose output, we examined the glucose-derived lactate fraction in liver. Mice fed the HI diet trended toward a decrease in hepatic lactate compared with mice fed the NC diet (18%, P=0.12; Table 1) and exhibited a 28.4% decrease compared with mice fed the LI diet (P<0.05; Table 1). Glucose-derived plasma lactate, the source of glucose production via Cori cycling, was 9.2% lower in mice fed the HI diet compared with mice fed the NC diet (P<0.01; Table 1) and 13.5% lower compared with mice fed the LI diet (P<0.001; Table 1). Liver lactate from glycolysis in mice fed the HI diet was 3.5% lower compared with mice fed the NC diet P<0.01; Table 1) and 3.4% lower compared with mice fed the LI diet (P<0.01; Table 1).
Table 1.
Metabolic fate of glucose in a 13C isotoplome-wide association study (IWAS) matrix
| Treatment | MHI | NC | LI |
|---|---|---|---|
| Hepatic glucose output, glucose-derived/z242 13C-labeled fraction | 45.13 ± 5.81 | 51.85 ± 3.28* | 53.58 ± 2.8* |
| Hepatic lactate level, glucose-derived 13C-labeled lactate | 6.69 ± 0.67 | 8.12 ± 1.99# | 9.34 ± 2.00* |
| Plasma lactate, glucose-derived 13C-labeled lactate | 19.07 ± 1.39 | 21 ± 1.15** | 22.05 ± 1.97*** |
| Liver lactate from glycolysis, glucose-derived M3 13C-lactate | 78.86 ± 0.53 | 81.77 ± 2.15** | 81.64 ± 1.33*** |
Metabolic fate of glucose after intraperitoneal challenge with [U-13C6]d-glucose substrate by its cross-labeling of plasma and liver metabolic products according to IWAS in WT C57BL/6J mice fed NC diet (500 mg Fe/kg), MHI diet (2 g Fe/kg), and LI diet (35 mg Fe/kg); n = 3/group.
P ≤ 0.05,
P < 0.01,
P < 0.001 vs. HI diet;
P = 0.12 vs. HI diet (not significant).
To determine whether the decreased hepatic glucose production was mediated by augmented insulin action, insulin signaling in liver was examined by Western blotting. Phosphorylation of AKT and IRS2 were lower by 68 and 72%, respectively, in liver of mice fed the HI diet (pAKT: NC= 8.7±1.0, HI=2.7±0.4 arbitrary density units, n=3/group, P=0.01; IRS2: NC=16.3±0.2, HI=4.6±1.1 arbitrary density units, n=3–4/group, P<0.05; Fig. 2E).
Mechanism for activation of AMPK in skeletal muscle and liver of mice fed an HI diet
We next examined the mechanisms by which iron activated AMPK. Because the phosphorylated form and activity of AMPK are regulated by LKB1, which in turn is regulated by acetylation (22, 23), we measured LKB1 acetylation in liver and skeletal muscle. LKB1 acetylation was decreased by 53% in skeletal muscle (NC=15.5±0.8, HI=7.2±0.3 arbitrary density units, P<0.001; Fig. 3A) and by 36% in liver of mice fed the HI diet (NC=1.48±0.03, HI=0.95±0.09 arbitrary density units, n=3/group, P<0.01; Fig. 3B). We also directly assessed lysine deacetylase activity in muscle and liver. Deacetylase activity in tissues of mice fed the HI diet was increased 2.0-fold in skeletal muscle (P<0.02) and 1.6-fold (P<0.05) in liver (Fig. 3C). We also assessed SIRT1 activity directly by assessing the acetylation of p53 at Lys382 (24). Acetylation of p53 was decreased in muscle tissue of mice fed the HI diet (P<0.01; Fig. 3D). Because deacetylation of p53 results in its degradation (25), we also assessed total p53, and its levels, too, were decreased in HI (P<0.005; Fig. 3D). Treatment with the sirtuin inhibitors nicotinamide or splitomicin abolished the increased phosphorylation of AMPK induced by iron treatment of C2C12 cells (Fig. 3E).
Figure 3.
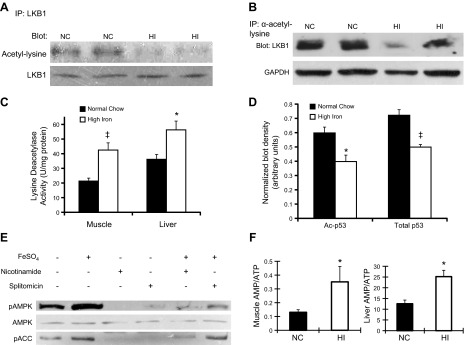
Iron activates AMPK through deacetylation of LKB1. A) Lysates of skeletal muscle from WT mice fed an NC or HI diet were incubated and precipitated by anti-LKB1. Pulldown was analyzed by Western blotting for anti-acetylated lysine (53% decrease, n=3/group, P<0.001). Anti-LKB1 was blotted as a loading control. B) Lysates of liver from WT mice fed an NC or HI diet were incubated and precipitated by anti-acetylated lysine. Pulldown was analyzed by Western blotting for LKB1 (36% decrease, n=3, P<0.01). Anti-GAPDH was blotted for normalizaton. C) Lysine deacetylase activity was measured in liver and muscle (2.0-fold increase in muscle, n=3/group; 1.6-fold increase in liver, n=3/group). *P < 0.05; ‡P < 0.02. D) Western blotting for p53 acetylation at Lys382 (left bars) and total p53 (right bars) normalized to actin (n=5–6/group). *P < 0.01, ‡P < 0.005. E) Differentiated C2C12 myotubes were grown with or without 1 μM FeSO4 overnight. These cells were also incubated with or without 10 mM nicotinamide or 100 μM splitomicin overnight. Cell lysates were prepared for Western blot analysis of pAMPK, total AMPK, phosphorylated ACC, and GAPDH. F) AMP and ATP in skeletal muscle (left panel, n=3–5) and liver (right panel, n=3) of WT mice on NC or HI were measured by LC-MS-MS-MS. *P < 0.05.
Because an increased AMP/ATP ratio is also known to increase AMPK activity, we measured AMP and ATP levels in skeletal muscle and liver. The AMP/ATP ratio was increased by 2.7-fold in skeletal muscle (P<0.05; Fig. 3F) and by 2.0-fold in liver (P<0.05; Fig. 3F) of mice fed the HI diet.
Iron overload may result in increased oxidative stress, which in turn regulates SIRT1 activity (26). We therefore determined whether oxidative stress was enhanced in skeletal muscle with dietary iron overload. Protein carbonyl levels, a commonly used indicator of protein oxidation (27) were increased by 2-fold (P<0.01; Fig. 4A)and 5.4-fold (P<0.05; Fig. 4A) in skeletal muscle and liver, respectively, of mice fed the HI diet. We next determined whether increased oxidative stress mediated iron-induced AMPK activation and also improved glucose tolerance. Similar to the study depicted in Fig. 1H, mice fed the HI diet for 8 wk exhibited a 48% decrease in the incremental AUCG after intraperitoneal glucose challenge compared to mice fed the NC diet (P<0.001; Fig. 4B). After concomitant treatment for 8 wk with the antioxidant N-acetyl cysteine (NAC), however, no difference was observed in AUCG between mice fed the NC and HI diets (P=0.36). Both groups of NAC-treated mice had significantly lower incremental AUCG than control mice fed the NC diet (P<0.01), but this was largely the effect of significantly higher fasting glucose levels in the NAC-treated animals (NAC=151±5, control=127±6 mg/dl, P<0.01; data not shown) rather than decreased glucose excursions. Thus, the total AUCG did not differ between control and NAC-treated mice (P=0.52; data not shown). The increased protein carbonyl level in muscle and liver of mice fed the HI diet was also normalized after 8 wk of NAC treatment (P=0.49 and P=0.57 for NC vs. HI in muscle and liver, respectively; Fig. 4C), as was the increased phosphorylation of AMPK (P=0.61 and P=0.78; Fig. 4D).
Figure 4.
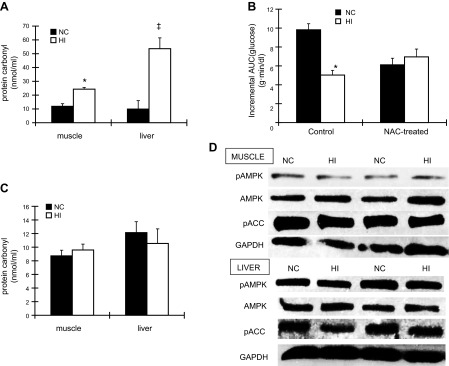
Iron induces oxidative stress, and treatment of mice with antioxidants reverses the effect of HI diet on AMPK and glucose tolerance. A) Protein carbonyl levels in skeletal muscle (left panel, n=3–5) and liver (right panel, n=3) of WT mice fed an NC or HI diet were measured. *P < 0.01; ‡P < 0.05. B) WT mice fed an NC or HI diet were treated with or without 10 mg/ml N-acetylcysteine (NAC; pH 7.0) for 2 mo. Glucose tolerance test was then performed, and incremental AUC for glucose was calculated (n=5; P<0.01 for mice with NAC treatment). *P = 0.05. C) After 2 mo of 10 mg/ml NAC treatment, protein carbonyl levels in skeletal muscle and liver of WT mice fed an NC or HI diet were measured (n=5; P=0.49 in skeletal muscle, P=0.57 in liver). D) After 2 mo of 10 mg/ml NAC treatment, skeletal muscle and liver from mice fed an NC or HI diet were analyzed by Western blotting for pAMPK, total AMPK, pACC, and GAPDH (n=3–4, P=0.61 for pAMPK in muscle; n=4, P=0.78 for pAMPK in liver).
DISCUSSION
Our previous studies in a mouse model of HH have shown that iron-overloaded Hfe−/− mice exhibit elevated AMPK activity in skeletal muscle (11), although it was not determined whether the AMPK activation was induced by iron or other secondary iron-independent signaling pathways. The mechanism of the activation of AMPK by iron and the subsequent changes in glucose homeostasis were also unknown, as was the status of insulin signaling. We report here that high dietary iron in WT mice activates AMPK in liver and muscle. This stimulation is mediated by redox signaling and decreased LKB1 acetylation, thus increasing LKB1 activity to phosphorylate and activate AMPK. Activated AMPK overruns dampened insulin signaling, increasing glucose uptake in muscle and suppressing gluconeogenesis in liver, contributing to the improved glucose tolerance observed in mice fed an HI diet. That AMPK is largely responsible is demonstrated by the lack of the effects of iron in muscle of mice expressing AMPK-DN in that tissue.
Iron entry into cells and bioavailable iron levels within cells are tightly regulated (28), so it was first necessary to determine whether skeletal muscle does accumulate excess iron with increased dietary intake, as has been previously demonstrated with HH (3, 11). Iron loading in muscle was demonstrated by 3 independent methods: increased ferritin protein levels, indicating increased iron stores in cells; decreased transferrin receptor levels, indicating higher levels of bioavailable iron flux; and increased total nonheme iron levels. These data demonstrate conclusively that despite the multiple pathways for regulation of iron and negative feedback regulation of dietary iron absorption mediated by hepcidin (28), those systems are not sufficient to prevent overload in muscle with chronic dietary excess of iron.
Numerous studies have demonstrated that in both humans and mouse models, iron overload is associated with diabetes and other markers of metabolic syndrome, such as steatohepatitis (1–5, 11, 29). The current study demonstrates that iron inhibits insulin signaling in muscle and liver, but also exerts compensatory beneficial metabolic effects by up-regulating AMPK activity. These effects were seen after feeding mice excess iron for only 2 mo, and with 2- to 4-fold elevations of ferritin and iron levels in muscle and liver. The majority of these studies were performed in mice fed a diet containing 20 g/kg elemental iron, but similar effects were seen in mice fed 1/10 that amount, only 4-fold more than normal rodent chow. “Normal” human serum ferritin values vary over a 10- to 15-fold range, suggesting that the current results are applicable to individuals with modest degrees of excess iron, such as can be seen with dietary excess. Of note, the effects of high iron on hepatic glucose handling are not attributable to overt liver damage: Mice fed these diets did not develop hepatotoxicity, as evidenced by increased serum levels of transaminases (data not shown), and it is also known that the Hfe−/− mouse model is resistant to the hepatofibrotic complications of iron overload that are seen in humans (30).
Although the observed effects of iron were to decrease glycemia in mice, over time other effects of excess iron are diabetogenic, for example, decreased insulin secretion, metabolic inflexibility, and mitochondrial dysfunction (10). These effects of iron overload in the development of diabetes would be particularly detrimental when combined with conditions causing insulin resistance, such as obesity or a high fat-diet. Finally, it is possible that the balance of the competing effects of AMPK activation compared to decreased insulin signaling may be different in humans or change over time. Thus, the final integrated effects of iron on diabetes risk are likely to be complex and modified by species, age, weight, diet, and multiple other variables.
The current studies were undertaken because of significant differences between dietary iron overload and HH, for example, in the tissue distribution of iron overload in the two conditions. Iron overload occurs in liver and muscle tissues both of Hfe−/− mice and of mice fed HI diets. Iron levels in adipose tissue (17) and macrophages (16) of Hfe−/− mice, by contrast, are lower than in WT mice, based on the fact that the lower hepcidin levels in HH result in increased expression of the iron export channel ferroportin (31, 32). Thus, tissues with relatively high ferroportin expression are paradoxically iron underloaded in HH, whereas high hepcidin in dietary iron overload lead to increased iron levels in those same tissues. In addition, in contrast to the decreased insulin signaling in liver of WT mice fed an HI diet, insulin signaling in liver of Hfe−/− mice was enhanced (3). This may be related to increased adiponectin levels in the Hfe−/− mice but decreased levels with dietary iron excess, related to the different adipocyte iron levels in the two conditions (17). In addition, macrophage iron loading on HI diets could contribute to macrophage inflammation that could, in turn, impair insulin signaling (33).
We demonstrate that one of the mechanisms of AMPK activation by iron is through the deacetylation of LKB1, one of the upstream stimulating kinases of AMPK. Deacetylation of LKB1 is largely mediated by SIRT1 (22, 23), and the decreased acetylation of the SIRT1 target p53 (24) argues that activation of SIRT1 is contributing to the observed effects. Consistent with a role of SIRT1 in responding to iron and activating AMPK, activation of SIRT1 attenuates oxidant-induced pathways (34) and mimics a low-energy state to signal increased fatty acid oxidation, a pathway also stimulated by AMPK (35). Other sirtuins, however, also modulate the LKB1/AMPK pathway (36), so we cannot be sure that other deacetylases do not contribute to the effects of iron on LKB1 acetylation. The pharmacologic effects of nicotinamide and splitomicin observed in the C2C12 cells argue that if other deacetylases are involved, they are likely to be other sirtuin family members rather than a non-NAD-dependent deacetylase. AMPK in yeast is itself activated by decreased acetylation (37), arguing that direct modulation of AMPK might add to LKB1-mediated changes in dietary iron overload. Other potential consequences of sirtuin activation by iron are possible and remain to be determined.
The sirtuins are known to respond to oxidative stress, and the experiments on the NAC-treated mice support that signaling by redox state of the tissue is playing a role in mediating the observed effects. Oxidant stress is known to increase in iron overload (10, 38). It should also be noted that factors other than enhanced skeletal muscle glucose uptake are contributing to the phenotype of the NAC-treated mice. Fasting glucose levels, for example, are significantly higher, and it may be speculated that diminished redox-dependent signaling of AMPK and its suppression of hepatic glucose production (Table 1) is a factor.
In summary, the current results and previous studies demonstrate that iron exerts significant effects across several tissues to exert effects on glucose homeostasis and diabetes risk. This system-wide association study (SWAS) greatly assists in the ultimate description of the effects of iron on metabolism, which include a complex set of dose-sensitive effects across several tissues, reflecting both beneficial and detrimental effects and both its toxic potential and regulatory actions.
Supplementary Material
Acknowledgments
The authors thank Dr. Morris Birnbaum (University of Pennsylvania, Philadelphia, PA, USA) for the AMPK-DN mice.
This work was supported by the U.S. National Institutes of Health (RO1DK081842, D.M.; 1T32DK091317, J.S.), the Research Service of the U.S. Department of Veterans Affairs, and the Marilyn Jane Robinson Foundation.
This article includes supplemental data. Please visit http://www.fasebj.org to obtain this information.
- ACC
- acetyl-CoA carboxylase
- AMPK
- AMP-activated protein kinase
- AMPK-DN
- dominant-negative AMP-activated protein kinase
- AUCG
- area under the curve for glucose
- G6Pase
- glucose-6-phosphatase
- GAPDH
- glyceraldehyde-3-phosphate dehydrogenase
- HH
- hereditary hemochromatosis
- HI
- high iron
- LI
- low iron
- MHI
- moderately high iron
- NAC
- N-acetylcysteine
- NC
- normal chow
- Pepck
- phosphoenolpyruvate carboxykinase
- Rpl13a
- ribosomal protein L13a
- Tfrc
- transferrin receptor 1
- WT
- wild type
REFERENCES
- 1. Rajpathak S. N., Wylie-Rosett J., Gunter M. J., Negassa A., Kabat G. C., Rohan T. E., Crandall J. (2009) Biomarkers of body iron stores and risk of developing type 2 diabetes. Diabetes Obes. Metab. 11, 472–479 [DOI] [PMC free article] [PubMed] [Google Scholar]
- 2. Fernandez-Real J. M., Lopez-Bermejo A., Ricart W. (2002) Cross-talk between iron metabolism and diabetes. Diabetes 51, 2348–2354 [DOI] [PubMed] [Google Scholar]
- 3. Huang J., Jones D., Luo B., Sanderson M., Soto J., Abel E. D., Cooksey R. C., McClain D. A. (2011) Iron overload and diabetes risk: a shift from glucose to fatty acid oxidation and increased hepatic glucose production in a mouse model of hereditary hemochromatosis. Diabetes 60, 80–87 [DOI] [PMC free article] [PubMed] [Google Scholar]
- 4. Dongiovanni P., Fracanzani A. L., Fargion S., Valenti L. (2011) Iron in fatty liver and in the metabolic syndrome: a promising therapeutic target. J. Hepatol. 55, 920–932 [DOI] [PubMed] [Google Scholar]
- 5. McClain D., Abraham D., Rogers J., Brady R., Gault P., Ajioka R., Kushner J. (2006) High prevalence of abnormal glucose homeostasis secondary to decreased insulin secretion in individuals with hereditary haemochromatosis. Diabetologia 49, 1661–1669 [DOI] [PubMed] [Google Scholar]
- 6. Pietrangelo A. (2010) Hereditary hemochromatosis: pathogenesis, diagnosis, and treatment. Gastroenterology 139, 393–408, e391–e392 [DOI] [PubMed] [Google Scholar]
- 7. Feder J. N., Gnirke A., Thomas W., Tsuchihashi Z., Ruddy D. A., Basava A., Dormishian F., Domingo R., Jr., Ellis M. C., Fullan A., Hinton L. M., Jones N. L., Kimmel B. E., Kronmal G. S., Lauer P., Lee V. K., Loeb D. B., Mapa F. A., McClelland E., Meyer N. C., Mintier G. A., Moeller N., Moore T., Morikang E., Prass C. E., Quintana L., Starnes S. M., Schatzman R. C., Brunke K. J., Drayna D. T., Risch N. J., Bacon B. R., Wolff R. K. (1996) A novel MHC class I-like gene is mutated in patients with hereditary haemochromatosis. Nat. Genet. 13, 399–408 [DOI] [PubMed] [Google Scholar]
- 8. Hatunic M., Finucane F. M., Brennan A. M., Norris S., Pacini G., Nolan J. J. (2010) Effect of iron overload on glucose metabolism in patients with hereditary hemochromatosis. Metabolism 59, 380–384 [DOI] [PubMed] [Google Scholar]
- 9. Zhou X. Y., Tomatsu S., Fleming R. E., Parkkila S., Waheed A., Jiang J., Fei Y., Brunt E. M., Ruddy D. A., Prass C. E., Schatzman R. C., O'Neill R., Britton R. S., Bacon B. R., Sly W. S. (1998) HFE gene knockout produces mouse model of hereditary hemochromatosis. Proc. Natl. Acad. Sci. U. S. A. 95, 2492–2497 [DOI] [PMC free article] [PubMed] [Google Scholar]
- 10. Cooksey R. C., Jouihan H. A., Ajioka R. S., Hazel M. W., Jones D. L., Kushner J. P., McClain D. A. (2004) Oxidative stress, beta-cell apoptosis, and decreased insulin secretory capacity in mouse models of hemochromatosis. Endocrinology 145, 5305–5312 [DOI] [PubMed] [Google Scholar]
- 11. Huang J., Gabrielsen J. S., Cooksey R. C., Luo B., Boros L. G., Jones D. L., Jouihan H. A., Soesanto Y., Knecht L., Hazel M. W., Kushner J. P., McClain D. A. (2007) Increased glucose disposal and AMP-dependent kinase signaling in a mouse model of hemochromatosis. J. Biol. Chem. 282, 37501–37507 [DOI] [PubMed] [Google Scholar]
- 12. Kahn B. B., Alquier T., Carling D., Hardie D. G. (2005) AMP-activated protein kinase: ancient energy gauge provides clues to modern understanding of metabolism. Cell Metab. 1, 15–25 [DOI] [PubMed] [Google Scholar]
- 13. Xiao B., Sanders M. J., Underwood E., Heath R., Mayer F. V., Carmena D., Jing C., Walker P. A., Eccleston J. F., Haire L. F., Saiu P., Howell S. A., Aasland R., Martin S. R., Carling D., Gamblin S. J. (2011) Structure of mammalian AMPK and its regulation by ADP. Nature 472, 230–233 [DOI] [PMC free article] [PubMed] [Google Scholar]
- 14. Fryer L. G., Parbu-Patel A., Carling D. (2002) Protein kinase inhibitors block the stimulation of the AMP-activated protein kinase by 5-amino-4-imidazolecarboxamide riboside. FEBS Lett. 531, 189–192 [DOI] [PubMed] [Google Scholar]
- 15. Long Y. C., Zierath J. R. (2006) AMP-activated protein kinase signaling in metabolic regulation. J. Clin. Invest. 116, 1776–1783 [DOI] [PMC free article] [PubMed] [Google Scholar]
- 16. Sullivan J. L. (2007) Macrophage iron, hepcidin, and atherosclerotic plaque stability. Exp. Biol. Med. (Maywood) 232, 1014–1020 [DOI] [PubMed] [Google Scholar]
- 17. Gabrielsen J. S., Gao Y., Simcox J. A., Huang J., Thorup D., Jones D., Cooksey R. C., Gabrielsen D., Adams T. D., Hunt S. C., Hopkins P. N., Cefalu W. T., McClain D. A. (2012) Adipocyte iron regulates adiponectin and insulin sensitivity. J. Clin. Invest. 122, 3529–3540 [DOI] [PMC free article] [PubMed] [Google Scholar]
- 18. Huberman A., Perez C. (2002) Nonheme iron determination. Anal. Biochem. 307, 375–378 [DOI] [PubMed] [Google Scholar]
- 19. Holland W. L., Brozinick J. T., Wang L. P., Hawkins E. D., Sargent K. M., Liu Y., Narra K., Hoehn K. L., Knotts T. A., Siesky A., Nelson D. H., Karathanasis S. K., Fontenot G. K., Birnbaum M. J., Summers S. A. (2007) Inhibition of ceramide synthesis ameliorates glucocorticoid-, saturated-fat-, and obesity-induced insulin resistance. Cell Metab. 5, 167–179 [DOI] [PubMed] [Google Scholar]
- 20. Quail E. A., Yeoh G. C. (1995) The effect of iron status on glyceraldehyde 3-phosphate dehydrogenase expression in rat liver. FEBS Lett. 359, 126–128 [DOI] [PubMed] [Google Scholar]
- 21. Casey J. L., Hentze M. W., Koeller D. M., Caughman S. W., Rouault T. A., Klausner R. D., Harford J. B. (1988) Iron-responsive elements: regulatory RNA sequences that control mRNA levels and translation. Science 240, 924–928 [DOI] [PubMed] [Google Scholar]
- 22. Hou X., Xu S., Maitland-Toolan K. A., Sato K., Jiang B., Ido Y., Lan F., Walsh K., Wierzbicki M., Verbeuren T. J., Cohen R. A., Zang M. (2008) SIRT1 regulates hepatocyte lipid metabolism through activating AMP-activated protein kinase. J. Biol. Chem. 283, 20015–20026 [DOI] [PMC free article] [PubMed] [Google Scholar]
- 23. Lan F., Cacicedo J. M., Ruderman N., Ido Y. (2008) SIRT1 modulation of the acetylation status, cytosolic localization, and activity of LKB1. Possible role in AMP-activated protein kinase activation. J. Biol. Chem. 283, 27628–27635 [DOI] [PMC free article] [PubMed] [Google Scholar]
- 24. Solomon J. M., Pasupuleti R., Xu L., McDonagh T., Curtis R., DiStefano P. S., Huber L. J. (2006) Inhibition of SIRT1 catalytic activity increases p53 acetylation but does not alter cell survival following DNA damage. Mol. Cell. Biol. 26, 28–38 [DOI] [PMC free article] [PubMed] [Google Scholar]
- 25. Ito A., Kawaguchi Y., Lai C. H., Kovacs J. J., Higashimoto Y., Appella E., Yao T. P. (2002) MDM2-HDAC1-mediated deacetylation of p53 is required for its degradation. EMBO J. 21, 6236–6245 [DOI] [PMC free article] [PubMed] [Google Scholar]
- 26. Brunet A., Sweeney L. B., Sturgill J. F., Chua K. F., Greer P. L., Lin Y., Tran H., Ross S. E., Mostoslavsky R., Cohen H. Y., Hu L. S., Cheng H. L., Jedrychowski M. P., Gygi S. P., Sinclair D. A., Alt F. W., Greenberg M. E. (2004) Stress-dependent regulation of FOXO transcription factors by the SIRT1 deacetylase. Science 303, 2011–2015 [DOI] [PubMed] [Google Scholar]
- 27. Stadtman E. R., Oliver C. N. (1991) Metal-catalyzed oxidation of proteins. Physiological consequences. J. Biol. Chem. 266, 2005–2008 [PubMed] [Google Scholar]
- 28. Andrews N. C., Schmidt P. J. (2007) Iron homeostasis. Ann. Rev. Physiol. 69, 69–85 [DOI] [PubMed] [Google Scholar]
- 29. Ford E. S., Cogswell M. E. (1999) Diabetes and serum ferritin concentration among U.S. adults. Diabetes Care 22, 1978–1983 [DOI] [PubMed] [Google Scholar]
- 30. Lebeau A., Frank J., Biesalski H. K., Weiss G., Srai S. K., Simpson R. J., McKie A. T., Bahram S., Gilfillan S., Schumann K. (2002) Long-term sequelae of HFE deletion in C57BL/6 x 129/O1a mice, an animal model for hereditary haemochromatosis. Eur. J. Clin. Invest. 32, 603–612 [DOI] [PubMed] [Google Scholar]
- 31. Nemeth E., Roetto A., Garozzo G., Ganz T., Camaschella C. (2004) Hepcidin is decreased in TFR2-hemochromatosis. Blood 105, 1803–1806 [DOI] [PubMed] [Google Scholar]
- 32. Nemeth E., Tuttle M. S., Powelson J., Vaughn M. B., Donovan A., Ward D. M., Ganz T., Kaplan J. (2004) Hepcidin regulates cellular iron efflux by binding to ferroportin and inducing its internalization. Science 306, 2090–2093 [DOI] [PubMed] [Google Scholar]
- 33. Shoelson S. E., Lee J., Goldfine A. B. (2006) Inflammation and insulin resistance. J. Clin. Invest. 116, 1793–1801 [DOI] [PMC free article] [PubMed] [Google Scholar]
- 34. Kume S., Haneda M., Kanasaki K., Sugimoto T., Araki S., Isono M., Isshiki K., Uzu T., Kashiwagi A., Koya D. (2006) Silent information regulator 2 (SIRT1) attenuates oxidative stress-induced mesangial cell apoptosis via p53 deacetylation. Free Rad. Biol. Med. 40, 2175–2182 [DOI] [PubMed] [Google Scholar]
- 35. Feige J. N., Lagouge M., Canto C., Strehle A., Houten S. M., Milne J. C., Lambert P. D., Mataki C., Elliott P. J., Auwerx J. (2008) Specific SIRT1 activation mimics low energy levels and protects against diet-induced metabolic disorders by enhancing fat oxidation. Cell Metab. 8, 347–358 [DOI] [PubMed] [Google Scholar]
- 36. Pillai V. B., Sundaresan N. R., Kim G., Gupta M., Rajamohan S. B., Pillai J. B., Samant S., Ravindra P. V., Isbatan A., Gupta M. P. (2010) Exogenous NAD blocks cardiac hypertrophic response via activation of the SIRT3-LKB1-AMP-activated kinase pathway. J. Biol. Chem. 285, 3133–3144 [DOI] [PMC free article] [PubMed] [Google Scholar]
- 37. Lu J. Y., Lin Y. Y., Sheu J. C., Wu J. T., Lee F. J., Chen Y., Lin M. I., Chiang F. T., Tai T. Y., Berger S. L., Zhao Y., Tsai K. S., Zhu H., Chuang L. M., Boeke J. D. (2011) Acetylation of yeast AMPK controls intrinsic aging independently of caloric restriction. Cell 146, 969–979 [DOI] [PMC free article] [PubMed] [Google Scholar]
- 38. Jouihan H. A. C. P., Cooksey R. C., Hoagland E. A., Boudina S., Abel E. D., Winge D. R., McClain D. A. (2008) Iron-mediated inhibition of mitochondrial manganese uptake mediates mitochondrial dysfunction in a mouse model of hemochromatosis. Mol. Med. 14, 98–108 [DOI] [PMC free article] [PubMed] [Google Scholar]
Associated Data
This section collects any data citations, data availability statements, or supplementary materials included in this article.