Abstract
The epithelial sodium channel (ENaC) is one of the central effectors involved in regulation of salt and water homeostasis in the kidney. To study mechanisms of ENaC regulation, we generated knockout mice lacking the insulin receptor (InsR KO) specifically in the collecting duct principal cells. Single-channel analysis in freshly isolated split-open tubules demonstrated that the InsR-KO mice have significantly lower ENaC activity compared to their wild-type (C57BL/6J) littermates when animals were fed either normal or sodium-deficient diets. Immunohistochemical and Western blot assays demonstrated no significant changes in expression of ENaC subunits in InsR-KO mice compared to wild-type littermates. Insulin treatment caused greater ENaC activity in split-open tubules isolated from wild-type mice but did not have this effect in the InsR-KO mice. Thus, these results suggest that insulin increases ENaC activity via its own receptor affecting the channel open probability. To further determine the mechanism of the action of insulin on ENaC, we used mouse mpkCCDc14 principal cells. Insulin significantly augmented amiloride-sensitive transepithelial flux in these cells. Pretreatment of the mpkCCDc14 cells with phosphatidylinositol 3-kinase (LY294002; 10 μM) or mTOR (PP242; 100 nM) inhibitors precluded this effect. This study provides new information about the importance of insulin receptors expressed in collecting duct principal cells for ENaC activity.—Pavlov, T. S., Ilatovskaya, D. V., Levchenko, V., Li, L., Ecelbarger, C. M., Staruschenko, A. Regulation of ENaC in mice lacking renal insulin receptors in the collecting duct.
Keywords: kidney, aldosterone-sensitive distal nephron, mTOR
The epithelial Na+ channel (ENaC) is one of the central effectors involved in regulation of salt and water homeostasis in the organism. Multiple factors regulate renal handling of sodium, including the renin-angiotensin-aldosterone system, insulin, growth factors, and other hormones. ENaC in the aldosterone-sensitive distal nephron (ASDN) has been shown to be causative of disturbances in total body Na+ levels associated with abnormal regulation of blood volume and blood pressure (1). Non-insulin-dependent diabetes mellitus with associated insulin insensitivity and reactive hyperinsulinemia is often complicated by hypertension that is in part due to volume expansion resulting from improper Na+ reabsorption by the kidney. In addition, drugs used to enhance insulin sensitivity in diabetes, such as thiazolidinediones, exacerbate abnormal Na+ handling by the kidney, leading to dangerous states of edema capable of manifesting in congestive heart failure (2, 3). Interestingly, insulin resistance often precedes hypertension in models of salt-sensitive hypertension, such as in the Dahl SS rats (4).
Insulin-resistant humans are characterized by impaired sodium homeostasis. Insulin has been shown to have antinatriuretic actions in humans and animal models (5). As demonstrated almost 40 yr ago, insulin administration in humans results in a reduction in urinary sodium excretion (6). These alterations occur in the absence of changes in the filtered load of glucose, glomerular filtration rate, renal blood flow, and plasma aldosterone concentration. The researchers suggested that the effect of insulin on sodium excretion was due to enhancement of sodium reabsorption in the distal nephron (6). An interest in insulin-stimulated Na+ reabsorption has risen because of the increasing incidence of hyperinsulinemic states, such as metabolic syndrome (7). Metabolic syndrome is characterized by insulin resistance leading to hyperinsulinemia, which is usually accompanied by obesity, hypertension, and hypertriglyceridemia (8, 9).
Insulin is recognized as a powerful regulator of ENaC in the ASDN. In the past 2 decades, several groups have made substantial progress in elucidating the regulation of ENaC by insulin. It has been shown that insulin increases Na+ transport in both mammalian tissues (perfused tubule studies) and in model cells (amphibian A6 and mammalian cells), in part by inducing the translocation of ENaC to the apical membrane (5, 7). Blazer-Yost et al. (10) demonstrated that insulin activates ENaC in the A6 amphibian cell line. It was proposed that stimulation of ENaC with insulin results in migration of ENaC subunits from a diffuse cytoplasmic localization to the apical and lateral membranes and that this effect is dependent on phosphatidylinositol 3 (PI 3)-kinase activity (11). It was also demonstrated that stimulation with insulin increases phosphorylation of ENaC subunits (12) and open probability (13). Other investigators examined the relationship and synergism between insulin and aldosterone signaling in the control of ENaC activity (14). Hypothetically, with regard to serum- and glucocorticoid-regulated kinase (SGK), a key mediator of ENaC recycling, aldosterone increases expression and insulin increases activity (via phosphorylation). It has been demonstrated recently that transactivation of the insulin-like growth factor 1 (IGF-1) receptor requires aldosterone (15). However, several studies suggest that insulin most likely acts independently from aldosterone to stimulate ENaC-mediated sodium reabsorption (10, 16).
A confirmation of in vitro studies in in vivo models was obtained by acute administration of insulin into C57BL6 mice, resulting in a significant reduction in excreted sodium that was restored by intraperitoneal administration of the ENaC antagonist benzamil (17). Biochemical isolation of the plasma membrane proteins from insulin- and vehicle-treated mouse kidneys demonstrated an increase in the abundance of ENaC subunits in mice injected with insulin, in agreement with the earlier in vitro studies, suggesting that ENaC was trafficked to the apical membrane in response to acute insulin stimulation (17).
While insulin seems to activate ENaC, the nature of the receptors is not crystal clear; e.g., both the IGF-1 receptor and the insulin receptor (InsR) are reportedly expressed in collecting ducts and can bind insulin. The effect of insulin and IGF-1 is initiated by binding of ligands to a cell surface receptor located on the basolateral membrane. Insulin and IGF-1 receptors share >50% overall amino acid sequence homology, but originate from different chromosomes, i.e., chromosome 7 and 8, respectively, in mice. Sequence homology reaches >80% in the tyrosine kinase domain. The IGF-1 receptor binds insulin with ∼2 orders of magnitude lower affinity than the InsR and, after activation, stimulates signaling pathways that are similar, but not identical, to those activated by the InsR (18).
The present study has been performed to explore whether insulin regulates ENaC activity in the native setting of the channel cortical collecting duct (CCD) and whether the effect of insulin is mediated through the InsR. Furthermore, the role of the InsR in regulation of ENaC activity by insulin was tested. To this end, experiments were performed in gene-targeted mice lacking InsR specifically in the collecting duct principal cells, and in their wild-type (WT) littermates (19). Additional experiments were performed in cultured principal cells to better define the downstream signaling mechanism. Our findings suggest that insulin, via its own receptor, is an important contributor to renal sodium handling via activation of ENaC. Fluctuations in circulating insulin levels, therefore, due to diet, disease, or therapy, may be expected to alter sodium handling.
MATERIALS AND METHODS
Animals
InsR-knockout (InsR-KO) mice targeted specifically to the collecting duct principal cells were bred at Georgetown University (GU) using Cre-lox mediated recombination (19). Mice with loxP sites flanking the InsR gene were crossed with mice possessing Cre-recombinase driven by the AQP2 promoter. After genotyping, to detect presence of the AQP2-promoter-driven Cre sequence (20), male InsR-KO mice (homozygous for floxed InsR and heterozygous for Cre), and littermates (homozygous for floxed InsR and negative for Cre) were phenotyped and characterized under basal conditions at GU. Mice were also shipped to the Medical College of Wisconsin (MCW) and used for additional experiments. Animal use and welfare adhered to the U.S. National Institutes of Health Guide for the Care and Use of Laboratory Animals, following protocols reviewed and approved by both the GU and MCW institutional animal care and use committees. For studies conducted at MCW, male mice were maintained on a Na+-deficient (<0.01% Na+; Harlan Teklad TD.90228; Harlan Bioproducts, Indianapolis, IN, USA) or normal Na+ diets (0.49% Na+; Harlan Teklad TD.96208) for 1 wk before experiments. For experiments with Na+-deficient or normal Na+ diets, 6–9 or 10–12 wk old male mice were used, respectively. The procedure for isolation of the CCD has been described previously (21–23).
Mouse phenotyping and characterization
Mice were maintained on Lab Diet 5001 (Purina, St. Louis, MO, USA) unless otherwise stated. Western blotting (24, 25) was done on whole homogenates from kidney cortex and inner medulla to evaluate reduction in the expression of the InsR using a rabbit polyclonal antibody against the α-subunit of InsR (SC-710; Santa Cruz Biotechnology, Santa Cruz, CA, USA). Immunofluoresence was utilized to determine cell-specific down-regulation of InsR using a commercial rabbit polyclonal antibody against the β-subunit of InsR (SC-711, Santa Cruz Biotechnology) and our own polyclonal rabbit antibody against AQP2, as a marker for collecting duct principal cells via confocal microscopy at the Lombardi Imaging Core (GU). Urine was collected in mouse metabolic cages (Hatteras Instruments, Cary, NC, USA) over the course of 24 h with ad libitum access to food and water. Urine sodium and potassium were measured with an EL-ISE Electrolyte System (Beckman Instruments, Fullerton, CA, USA). Blood pressure was determined on young (3–4 mo) male mice by radiotelemetry (Data Sciences Inc., St. Paul, MN, USA) as described previously (25).
Cell culture
Immortalized mouse CCD (mpkCCDc14) principal cells (26) were kindly provided by Dr. Alain Vandewalle (Institut National de la Santé et de la Recherche Médicale, Paris, France) and grown in defined medium on permeable supports (Costar Transwells, 0.4-μm pore, 24-mm diameter; Corning Costar, Corning, NY, USA) as described previously (27). The cells were maintained with FBS and corticosteroids, allowing them to polarize and form a monolayer with high resistance and avid Na+ reabsorption. The cells were seeded onto permeable supports at a density of 0.2–0.3 × 10⁶ cells/filter. The mpkCCDc14 cells were kept on filter supports for ≥7 d, and the medium was changed every other day.
Transepithelial electrical measurements
At 18 h before use in any investigation, growth medium was replaced with a minimal medium (without supplements and FBS) that contained only DMEM/F12 and antibiotics. Transepithelial Na+ current across mpkCCDc14 cell monolayer was calculated using Ohm's law as the quotient of transepithelial voltage to transepithelial resistance under open circuit conditions. A Millicell electrical resistance system with dual Ag/AgCl pellet electrodes (Millipore Corp., Billerica, MA, USA) was used to measure voltage and resistance (28–30).
Patch-clamp electrophysiology
Single-channel current data were acquired and subsequently analyzed with an Axopatch 200B or MultiClamp 700B patch-clamp amplifier (Molecular Devices, Sunnyvale, CA, USA) interfaced via a Digidata 1440A with a PC running the pClamp 10.2 suite of software (Molecular Devices). After a high-resistance seal was obtained, cell-attached recording was performed immediately. The membrane resistance was monitored continuously to ensure the quality of recording. For measurements of acute effects, only one experiment was performed per coverglass to avoid any possibility of examining cells whose properties might have been altered by extended exposure to insulin. When currents were acquired, they were filtered with an 8-pole, low-pass Bessel filter LPF-8 (Warner Instruments, Hamden, CT, USA) at 0.2 kHz. Typical bath solution was composed of 150 mM NaCl, 1 mM CaCl2, 2 mM MgCl2, and 10 HEPES (pH 7.4). The pipette solution for cell-attached configuration was composed of 140 mM LiCl, 2 mM MgCl2, and 10 mM HEPES (pH 7.4) (31).
Patches were selected for low noise and drift of the baseline current (low noise is associated with higher seal resistances). Slow baseline drifts were corrected for some cell-attached patches. To assess the steady-state probability of channel opening, patches were clamped to a potential of −40 or −60 mV, and control channel activity was measured for ≥1 min before application of the corresponding drugs. The channel openings were analyzed by Clampfit 10.2 software using the single-channel search in the analyze function. A 50% threshold cross-method was utilized to determine valid channel openings. All events were carefully checked visually before being accepted. NPo, the product of the number of channels N and the open probability Po, was used to measure the channel activity within a patch. Single-channel unitary current i was determined from the best-fit gaussian distribution of amplitude histograms. Channel activity was analyzed as NPo = I/i, where I is mean total current in a patch, and i is unitary current at this voltage. Where appropriate, Po was calculated by normalizing NPo for the total number of estimated channels in the patch. To increase accuracy in measurement of Po, only patches containing 5 channels or fewer were used (32).
Immunohistochemistry
Mouse kidneys were fixed in 10% formalin and processed for paraffin embedding. The kidney sections were cut at 4 μm, dried, and deparaffinized for subsequent labeled streptavidin-biotin immunohistochemistry. After deparaffinization, the slides were treated with a citrate buffer (pH 6) for a total of 35 min. The slides were blocked with a perioxidase block (Dako, Coppenhagen, Denmark), avidin block (Vector Laboratories, Burlingame, CA, USA), biotin block (Vector Laboratories), and serum-free protein block (Dako). Tissue sections were incubated for 90 min in 1:150, 1:200, and 1:750 dilutions of anti-α, anti-β, and anti-γ-ENaC antibodies (StressMarq Biosciences Inc., Victoria, BC, Canada), respectively. Secondary detection was performed with goat anti-rabbit biotinylated IgG (Biocare, Tempe, AZ, USA) followed by streptavidin HRP (Biocare) and visualized with DAB (Dako). All slides were counterstained with Mayer's hematoxylin (Dako), dehydrated and mounted with permanent mounting medium (Sakura, Torrance, CA, USA).
Western blotting
Kidney cortex sections were harvested into a gentle lysis buffer (GLB) containing 1.0% Nonidet P-40 with protease inhibitor cocktail (Roche, Indianapolis, IN, USA). Brief-pulse sonication was used on samples to ensure efficient lysis. After sonication, the cells were spin-cleared for 3 min at 10,000 g, and total protein concentration of the supernatant was measured using the Bradford protein assay (Bio-Rad, Hercules, CA, USA). The proteins were separated on 10–20% SDS-PAGE, transferred to nitrocellulose, and probed with anti-ENaC antibodies in Tris-buffered saline supplemented with 1% dry milk and 0.1% Tween 20.
Statistics
All summarized data are reported as means ± sem. Data are compared using either the Student's t test or paired t test (for Figs. 1 and 7B, D).
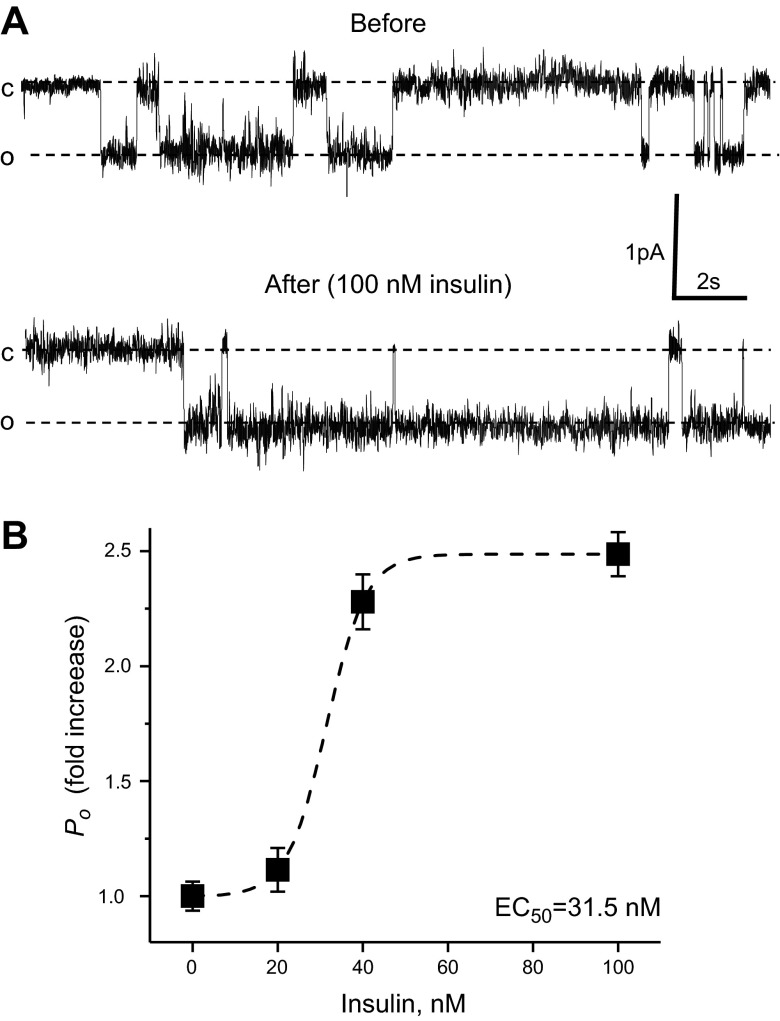
Figure 1.
Insulin increases ENaC Po in freshly isolated split-open CCDs of WT (C57BL/6J) mice fed a sodium-deficient diet for 1 wk. A) Representative current traces from a cell-attached patch in the control and after application of 100 nM insulin. B) Summary graph of ENaC Po changes in response to application of 0, 20, 40, and 100 nM insulin. For each individual experiment, the changes were normalized to ENaC Po in the control; fold increase is shown. Dashed lines are the best fit of the Hill equation. N varies from 5 to 14 experiments for each insulin concentration.
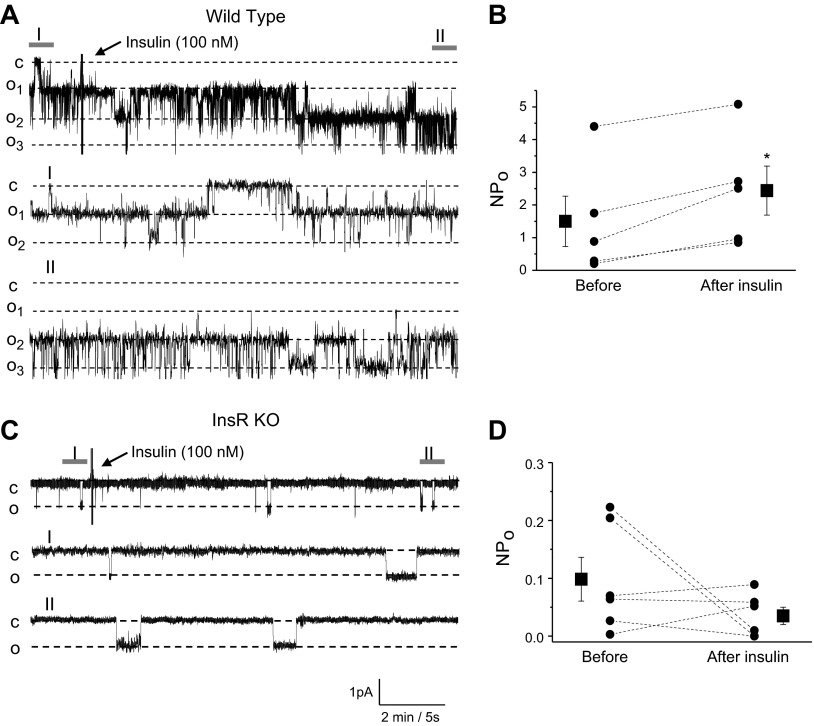
Figure 7.
Insulin acutely increases ENaC activity in CCDs via InsR. A, C) Effect of insulin on ENaC activity in freshly isolated CCDs of WT (A) and InsR-KO mice (C). Continuous current traces from representative cell-attached patches were recorded on the apical membrane of principal cells before and after treatment with insulin (100 nM). Areas before (I) and after (II) treatment are shown at middle and bottom with an expanded time scale. These patches were held at a −60 mV test potential during the course of the experiment. c, closed current level; on, open current level. B, D) Summary graphs of ENaC NPo changes from WT (B) and InsR-KO mice (D) in response to insulin application in patch-clamp experiments similar to those shown in panels A and C. *P < 0.05 vs. before insulin application.
RESULTS
Insulin acutely increases ENaC channel Po in freshly isolated split-open ASDNs
It was previously shown that insulin activates ENaC and ENaC-mediated sodium reabsorption in perfused tubules and cultured principal cells (5, 7, 10–13, 28). To test the effect of insulin on native ENaC, we used patch-clamp electrophysiology in split-open CCDs isolated from salt-restricted C57BL/6J mice to examine insulin actions on ENaC in situ. Figure 1A documents a representative current trace from a cell-attached patch monitoring ENaC activity in the control and after application of 100 nM insulin. As can be seen from this experiment, insulin acutely increases ENaC Po. Interestingly, application of insulin also caused activation of other K+ or Cl− channels, which had higher amplitude than ENaC and reversal potential near 0 mV. However, identity of these channels requires further studies. We next determined the concentration diapason of insulin regulation of ENaC activity. Figure 1B summarizes changes in ENaC Po in patch-clamp experiments in response to acute application of different concentrations of insulin. The EC50 was 31.5 nM when the hormone was directly applied to the bath solution. This concentration is higher than physiological concentrations of insulin in the kidney and is most likely required for activation of the channel, since the cell environment in this preparation is slightly different from native conditions in the intact kidneys. Receptors mediating insulin signal are localized at the basolateral plasma membrane, and it takes time for the bath solution to freely wash the basolateral side in this preparation. Similarly, Frindt and Palmer (33) could not activate ENaC in freshly isolated tubules when they applied 2 nM of insulin.
Characterization of the principal cell InsR KO
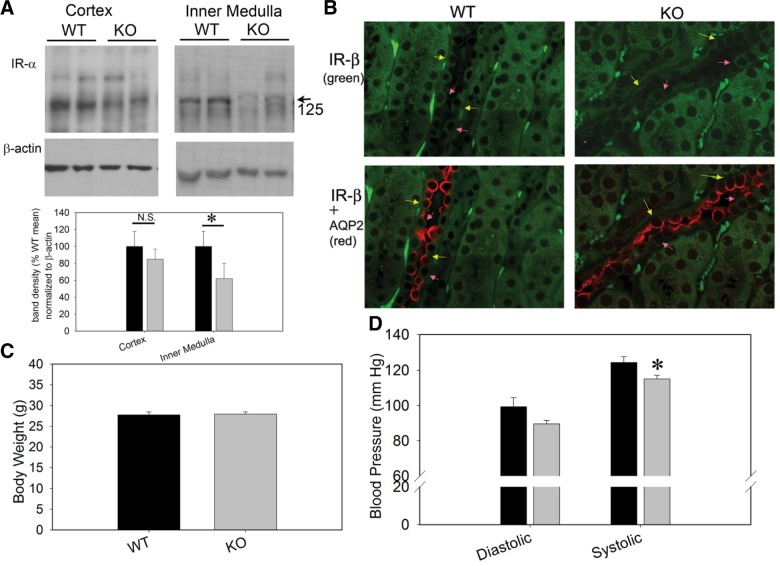
To study mechanisms of ENaC regulation by insulin, we generated InsR-KO mice targeted specifically to the collecting duct principal cells using Cre-lox-mediated recombination (19). Mice with loxP sites flanking the InsR gene were crossed with mice possessing Cre-recombinase driven by the AQP2 promoter. Figure 2A, B shows Western blots and immunofluorescence of InsR (α and β subunits, respectively) in the InsR-KO mice and WT littermates. No differences in body weight were found between genotypes (Fig. 2C). However, systolic blood pressure (measured by radiotelemetry) was significantly lower in the InsR-KO mice under basal dietary conditions (Fig. 2D).
Figure 2.
Characterization of the principal cell InsR KO. A) Western blots of cortex and inner medullary (as indicated) whole-cell homogenates (20 μg protein/lane) from 2 WT and 2 KO mice probed with an antibody against InsR (α subunit). Densitometry of major 125-kDa band was significantly reduced in the inner medulla from KO mice (n=6 mice/genotype). *P < 0.05; unpaired t test. B) Immunofluorescence of InsR (β subunit, green) using AQP2 (red) as a marker for collecting duct principal cells. Bottom panel shows absent or reduced basolateral staining for IR in principal (yellow arrows) but not in intercalated cells (pink arrows) in the KO vs. WT mice. C) Body weight of WT and KO mice at 13 wk of age was not different. D) Blood pressure (measured by radiotelemetry) was modestly lower in KO mice under basal dietary conditions (significant for systolic, n=8 mice/group). *P < 0.05.
InsR is important for ENaC activity
In the present study, we tested whether KO of InsR has an effect on ENaC activity in freshly isolated split-open CCDs. First, we formed cell-attached seals on the apical membrane of principal cells of split-open CCDs to directly assess ENaC activity in this native preparation. Figure 3A documents the representative current traces for ENaC in freshly isolated CCDs from InsR-KO mice or their WT littermates. The CCDs used in this set of experiments were isolated from salt-restricted [Na+-deficient diet (<0.01%) for 1 wk] mice to set initial ENaC activity to a high level. As seen from these current traces and summarized in Fig. 3B, ENaC activity was significantly lower in InsR-KO mice compared to their littermates.
Figure 3.
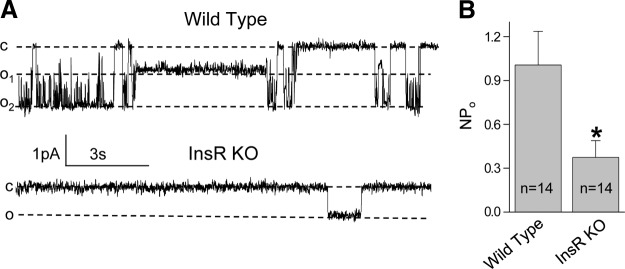
ENaC activity is down-regulated in CCDs isolated from InsR-KO mice. A) Representative current traces from cell-attached patches containing ENaC and recorded from the apical membrane of split-open CCD cells of WT and InsR-KO mice fed Na+-deficient (<0.01%) diet for 1 wk. Holding potential is −60 mV. B) Summary graphs of ENaC NPo in cell-attached patches. *P < 0.05 vs. WT littermates.
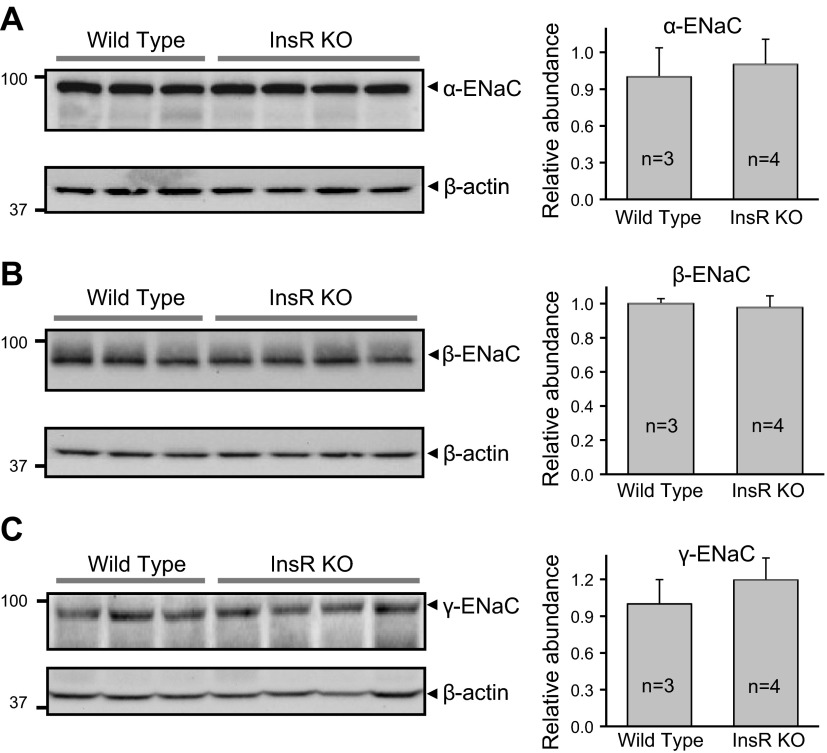
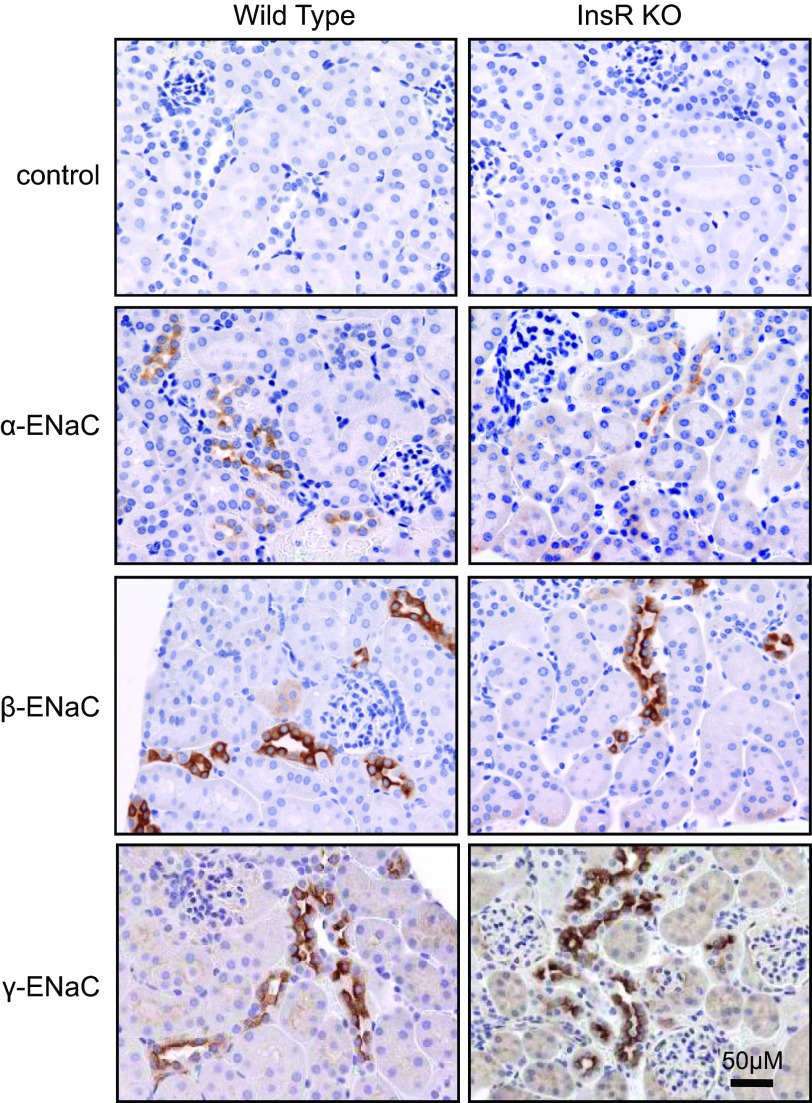
Western blot analysis was performed to test whether InsR KO resulted in changes in ENaC subunits expression in the kidney. We performed Western blot analysis of all three ENaC subunits (α, β, and γ) in tissue homogenate isolated from kidney cortex. Surprisingly, InsR KO did not change the expression level of ENaC subunits (Fig. 4). Immunohistochemistry analysis was performed further to identify expression and localization of ENaC subunits. Figure 5 shows images from kidneys immunohistochemically stained for all three ENaC subunits. Negative control (control; stained with secondary antibodies in the absence of primary antibodies) is also shown. Additional negative control experiments (stained without primary and secondary antibodies) also did not show any staining (data not shown). Staining for ENaC subunits was identified in the cytosol and profoundly at the apical membranes in both InsR-KO mice and their littermates.
Figure 4.
KO of InsR does not affect expression profiles of ENaC subunits in the kidney cortex. Western blot analysis of α-ENaC (A), β-ENaC (B), and γ-ENaC (C) subunit expression in mouse kidney cortex. Cell lysates were collected from InsR-KO mice and their WT littermates and analyzed using anti-ENaC antibodies; equal loading was verified by anti-β-actin antibodies. Summary graphs (right panels) represent densitometric analysis of relative ENaC subunit abundance.
Figure 5.
Expression and localization of ENaC subunits in the kidney from the InsR-KO mice and their WT littermates. Representative immunohistochemical staining for ENaC subunits in the kidney cortical sections of InsR-KO mice and their WT littermates at ×40 view. Top panels show negative control tissue stained with secondary antibodies in the absence of primary antibodies. Scale bar = 50 μm. Note the edges of the kidney and glomeruli, confirming the cortex localization.
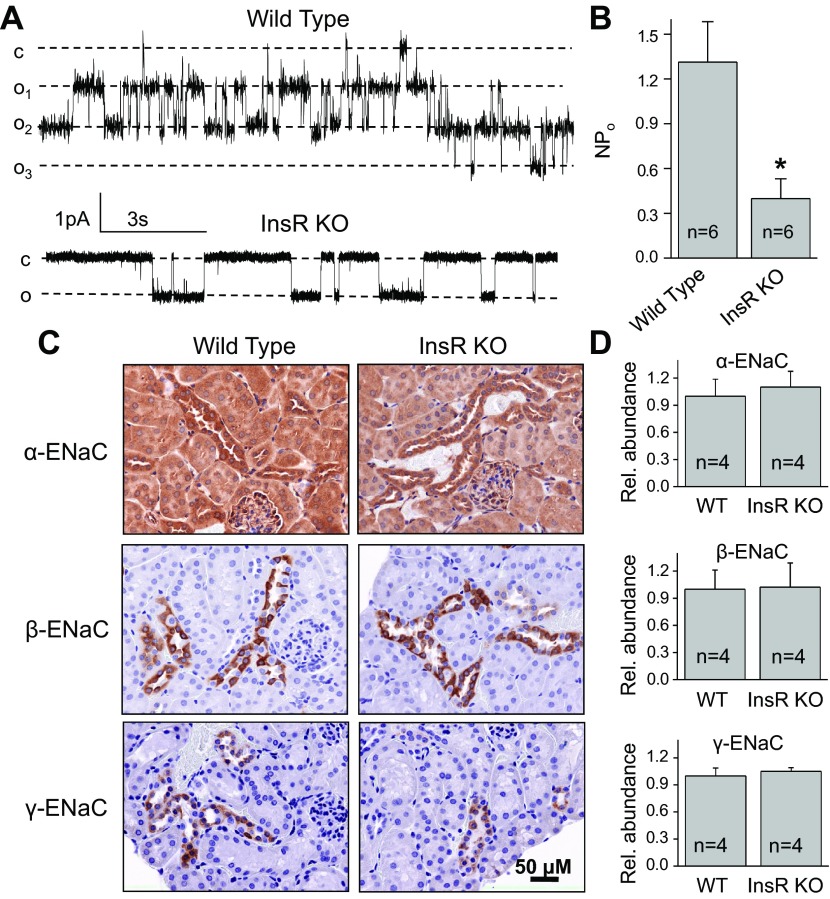
To test whether observed changes in ENaC activity are specific for animals fed a sodium-deficient diet, we have studied ENaC activity and abundance in InsR-KO mice and their WT littermates fed a normal-salt diet (0.49% NaCl). As seen in Fig. 6A, B, ENaC activity was significantly lower in CCDs isolated from InsR-KO mice compared to their littermates. Similar to data in Figs. 4 and 5, immunohistochemical (Fig. 6C) and biochemical (Fig. 6D) analysis revealed that ENaC abundance did not change in InsR-KO mice compared to control WT mice when animals were fed with normal-salt diet.
Figure 6.
ENaC activity and expression in CCDs isolated from InsR-KO mice fed a normal-salt (0.49%) diet. A, B) Representative current traces (A) and summary graphs of ENaC NPo (B) from cell-attached patches containing ENaC and recorded from the apical membrane of split-open CCD cells of WT and InsR-KO mice fed normal-Na+ diet. Holding potential is −60 mV. *P < 0.05 vs. WT littermates. C) Representative immunohistochemical staining for ENaC subunits in the kidney cortical sections of InsR-KO and their WT littermate mice at ×40 view. Scale bar = 50 μm. D) Summary graphs of Western blot analysis of α-ENaC, β-ENaC, and γ-ENaC subunit expression in mouse kidney cortex. Cell lysates were collected from InsR-KO mice and their WT littermates and analyzed using anti-ENaC antibodies; equal loading was verified by anti-β-actin antibodies.
InR is required for activation of ENaC
Figure 7A shows a representative current trace from a cell-attached patch formed on the apical membrane of a principal cell of the CCD isolated from a WT mouse before and after addition of 100 nM insulin. Areas before (Fig. 7A, I) and after (Fig. 7A, II) treatment with insulin are shown below with an expanded time scale. As summarized in Fig. 7B, insulin rapidly and markedly increased ENaC NPo in WT mice. In contrast, insulin did not affect ENaC activity in InsR-KO mice (Fig. 7C, D). These data provide direct evidence that insulin acutely up-regulates ENaC activity via its own InsR.
PI 3-kinase signaling is necessary for insulin to increase ENaC-mediated Na+ transport in principal cells
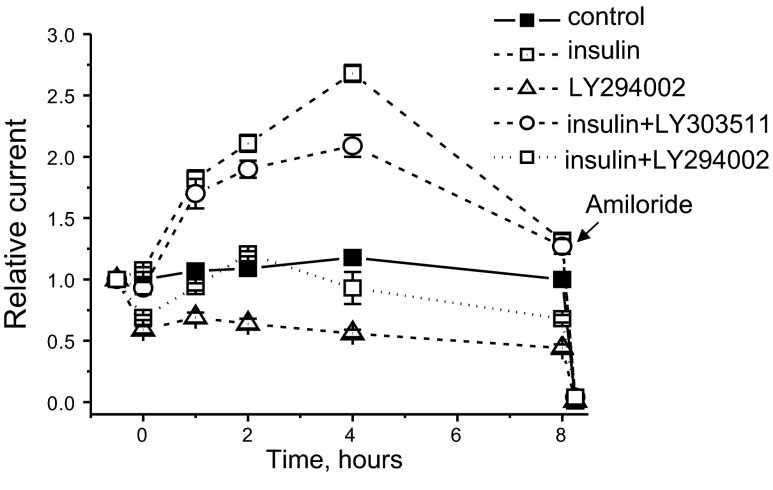
PI 3-kinase is a critical component of the signaling cascades that are responsible for increasing ENaC activity and Na+ transport (11, 34, 35). Furthermore, we have demonstrated that PI 3-kinase is necessary to IGF-1–stimulated Na+ transport in freshly isolated rat CCD and mpkCCDc14 principal cells (22). Thus, it is likely that PI 3-kinase is also integral to increases in Na+ transport in response to insulin. To test this idea, we measured insulin-stimulated transepithelial flux in mpkCCDc14 cells in the absence and presence of a PI 3-kinase inhibitor. As shown in Fig. 8, addition of 20 nM of insulin to polarized mpkCCDc14 principal cells with steady-state basal transport rates significantly increased Na+ reabsorption in a time-dependent manner above basal levels and compared to vehicle. Addition of amiloride to the apical membrane completely abolished the transepithelial current stimulated by insulin, indicating that this hormone increases Na+ reabsorption via ENaC. As summarized in Fig. 8, pretreating monolayers for 30 min with the PI 3-kinase inhibitor LY294002 (10 μM) disrupts insulin actions on ENaC-mediated Na+ reabsorption. This concentration of LY294002 was previously demonstrated as sufficient to regulate ENaC-mediated sodium reabsorption (36, 37). In contrast, the inactive analog of LY294002, LY303511, had little effect on insulin-mediated increase in Na+ transport. Therefore, PI 3-kinase is necessary for the insulin-stimulated Na+ transport.
Figure 8.
Inhibition of PI3-kinase prevents effect of insulin on ENaC activity in mpkCCDc14 cells. Pretreatment with LY29004, a PI3-kinase inhibitor, prevents ability of insulin to increase ENaC activity in mpkCCDc14 cell monolayer. Cells were serum starved overnight, and measurements were performed as described in Materials and Methods. Insulin (20 nM) was added basolaterally at time 0. Cells were pretreated with 10 μM of LY294002 or LY303511 (inactive negative control compound for LY29004) 30 min before the application of insulin or vehicle. Amiloride (10 μM) was added to the apical membrane at the end of experiment.
Mammalian target of rapamycin (mTOR) is required for insulin-mediated increase of Na+ reabsorption in principal cells
mTOR is a highly conserved serine-threonine kinase that is essential for the phosphorylation of SGK1 and the physiological control of ENaC-mediated Na+ transport (38, 39). To determine whether mTOR is necessary for insulin-dependent stimulation of ENaC-mediated Na+ transport, we used an active-site inhibitor of mTOR, PP242 (40). Initial studies were performed to identify a dose required to modulate ENaC-mediated transepithelial current in mpkCCDc14 cells in the absence of insulin. Dose-dependent studies revealed that even low concentrations of PP242 significantly decreased basal current through the monolayer (Fig. 9A). These data demonstrate that mTOR plays a role in maintenance of basal sodium transport through the mpkCCDc14 cell monolayer. The IC50 for PP242 was 198.0 ± 34.1 nM (Fig. 9B). These values were similar to those reported previously (38). As seen in Fig. 9C, PP242, like LY294001, significantly attenuated effect of insulin.
Figure 9.

Inhibition of mTOR prevents effect of insulin on ENaC activity in mpkCCDc14 cells. A) Time course of relative Na+ transport across monolayers of mpkCCDc14 cells in the absence and presence of treatment with various concentrations of PP242, an mTOR inhibitor. Values are means ± sem; n =5–12/concentration. PP242 and vehicle (control) were added bilaterally at time 0, and current was normalized to the starting level. Amiloride (10 μM) was added to the apical membrane at the end of experiment. B) Dose-response curve for PP242 effect on relative current after 8 h treatment. Dashed line is the best fit of the Hill equation, yielding IC50 = 198.0 ± 34.1 nM. C) Pretreatment with PP242 prevents ability of insulin to increase ENaC activity in mpkCCDc14 cell monolayer. Cells were serum starved overnight, and measurements were performed as described in Materials and Methods. Insulin (20 nM) was added basolaterally at time 0. PP242 at concentration of 100 nM was added bilaterally either in presence or absence of insulin at time 0.
DISCUSSION
In this study, InsR-KO mice targeted specifically to the collecting duct principal cells and a cultured mpkCCDc14 cell line were used to investigate mechanisms underlying insulin reception and intracellular signaling with regard to ENaC functions. The present work corroborated previous cell culture studies and demonstrated that insulin activates ENaC in freshly isolated split-open ASDNs. In addition, our results determine that the acute effect on ENaC is mediated through the InsR by modulating the gating of the channel.
Previous studies in mice and rats demonstrated that acute and chronic administration of insulin increases ENaC subunit abundance in the whole-kidney membrane fraction and in the apical membranes of CCDs, as measured with immunoperoxidase labeling (17, 41). In the current study, the expression analysis was made under baseline conditions without chronic insulin stimulation. Thus, it is possible that insulin administration increases both subunit abundance and activity, but baseline subunit expression is not dependent on the InsR. It was also shown that insulin increases the number of active Na+ channels in the apical membrane of amphibian A6 cells (10). In contrast, Marunaka et al. (42) demonstrated that the application of insulin to A6 cells enhances the channel open probability. Here we provide evidence that InsR KO decreases ENaC activity but has no effect on the number of channels.
Insulin signaling occurs via a highly integrated network that activates different intracellular pathways. The first, critical substrate in this network is the receptor. Insulin can associate with either the insulin or IGF-1 receptors in a concentration-dependent manner (18, 43). It is not clear which receptor mediates sodium transport response to insulin in the ASDN. Rossier and colleagues (44) have examined the possible role of insulin and IGF-1 in the same cellular model. The researchers observed that the mCCDcl1 cell line was highly responsive to IGF-1 but not to insulin. They hypothesized that as the binding properties of the IGF-1 receptor and InsR to their respective ligand are similar, the observed insulin and IGF-1 responses are signaled mainly through the IGF-1 receptor and not the InsR (44). Here we provide direct evidence that the InsR is critically important for the activation of ENaC in ASDNs, at least in response to insulin.
In addition, the implications of the PI 3-kinase/mTOR pathway were tested by inhibiting corresponding kinases and by measuring the currents in response to insulin. The role of the PI3-kinase/SGK1 pathway in insulin-stimulated sodium reabsorption was previously established. It was shown in amphibian and mammalian cell monolayers that this pathway is critical for the effects of insulin on ENaC activity (11, 34, 45, 46). Furthermore, PI3-kinase is involved in insulin-mediated activation of ENaC in mammalian taste-receptor cells (37). Our experiments with LY294002 and its inactive analog LY303511 confirm the importance of PI3-kinase signaling. Similarly, we have previously revealed that PI3-kinase is required for IGF-1 dependent activation of ENaC in rat ASDNs (22).
mTOR integrates multiple inputs, including nutrient abundance and hormonal signals, to control a variety of cellular processes. Lu et al. (38) recently demonstrated that mTOR, in conjunction with rictor (mTORC2), phosphorylates SGK1 and stimulates ENaC. In contrast, when mTOR assembled with raptor in the rapamycin-inhibited complex (mTORC1), it did not phosphorylate SGK1 or stimulate ENaC. Inhibition of mTOR blocked both SGK1 phosphorylation and ENaC-mediated Na+ transport, whereas specific inhibition of mTORC1 had no effect (38). Similarly, rapamycin had no effect on insulin-stimulated transepithelial current in mpkCCDc14 cells (45). It was proposed that mTORC1 is essential for glucocorticoid-induced Na+ retention (47). Our data also reveal that inhibition of mTOR with PP242 abolished insulin-mediated increase in sodium reabsorption.
The physiological effect of the action of insulin via ENaC in the collecting ducts is still under debate. Insulin also reportedly stimulates sodium chloride reabsorption in the proximal tubule and loop of Henle (6, 48, 49), which may be responsible for some of the whole-organ antinatriuretic actions of insulin. Furthermore, using a different mouse cross, we showed that KO of the InsR from a larger portion of the renal tubule, i.e., primarily the TAL through the CD (using Ksp-cadherin-driven Cre) resulted in slightly elevated blood pressure, delayed or impaired natriuretic ability, and reduced urine nitrates plus nitrites (UNOx; ref. 25). Recently, we also showed that this BP elevation was salt sensitive in those mice and possibly due to reduced renal nitric oxide synthase (NOS) activity (50). We believe this phenotype, however, may be a manifestation of reduced InsR in another cell type, perhaps the TAL, as blood pressure was actually slightly but significantly lower in the current model, i.e., KO from only the collecting duct principal cells, and UNOx was unaffected (19).
In addition, recent studies by Frindt and Palmer (33) using split-open rat CCDs supported the notion that the effects of insulin to increase sodium reabsorption in the CCD may be indirect, perhaps via activation of the basolateral Na+/K+ ATPase pump. They also reported that insulin up-regulated apical K+ channels but not ENaC in their preparation (33). Although only a small percentage of Na+ reabsorption is accomplished in these nephron segments, the ASDN is critical for water and electrolyte homeostasis. Recent studies in diabetic dogs demonstrate that insulin acts directly on the kidneys to chronically stimulate sodium reabsorption only in hyperglycemic conditions (51). It was also demonstrated that glucose can activate ENaC (41, 52). However, an interactive effect of glucose with insulin has not yet been reported and could potentially play a significant role in insulin-dependent regulation of Na+ reabsorption.
Overall, our data suggest an important role for normal expression of InsR in the CCD as a determinant of basal and insulin-stimulated sodium transport capability. Additional studies will be required to clarify the role of insulin as a developmental proponent of CD sodium transport capacity. These studies are important in our understanding of the effects of both type I and type II diabetes on renal CCD function and ENaC actions.
Acknowledgments
Glen Slocum and Christine Duris (Medical College of Wisconsin) are recognized for excellent technical assistance with immunohistochemistry experiments. The authors also thank Dr. Oleg Palygin (Medical College of Wisconsin) for his invaluable help with electrophysiological experiments.
This work was supported by American Diabetes Association grant 1-10-BS-168 (to A.S.), American Heart Association grants 10POST4140109 and 13SDG14220012 (to T.S.P.), and U.S. National Institutes of Health grants DK082507 (to C.M.E.) and HL108880 (to A.S.).
Footnotes
- ASDN
- aldosterone-sensitive distal nephron
- CCD
- cortical collecting duct
- ENaC
- epithelial Na+ channel
- InsR
- insulin receptor
- InsR KO
- insulin receptor knockout
- IGF-1
- insulin-like growth factor 1
- KO
- knockout
- PI 3
- phosphatidylinositol 3
- mTOR
- mammalian target of rapamycin
- SGK
- serum- and glucocorticoid-regulated kinase
REFERENCES
- 1. Staruschenko A. (2012) Regulation of transport in the connecting tubule and cortical collecting duct. Compr. Physiol. 2, 1541–1584 [DOI] [PMC free article] [PubMed] [Google Scholar]
- 2. Pavlov T. S., Imig J. D., Staruschenko A. (2010) Regulation of ENaC-mediated sodium reabsorption by peroxisome proliferator-activated receptors. PPAR Res. 2010, 703735. [DOI] [PMC free article] [PubMed] [Google Scholar]
- 3. Guan Y., Hao C., Cha D. R., Rao R., Lu W., Kohan D. E., Magnuson M. A., Redha R., Zhang Y., Breyer M. D. (2005) Thiazolidinediones expand body fluid volume through PPARgamma stimulation of ENaC-mediated renal salt absorption. Nat. Med. 11, 861–866 [DOI] [PubMed] [Google Scholar]
- 4. Kotchen T. A., Zhang H. Y., Covelli M., Blehschmidt N. (1991) Insulin resistance and blood pressure in Dahl rats and in one-kidney, one-clip hypertensive rats. Am. J. Physiol. 261, E692–E697 [DOI] [PubMed] [Google Scholar]
- 5. Tiwari S., Riazi S., Ecelbarger C. A. (2007) Insulin's impact on renal sodium transport and blood pressure in health, obesity, and diabetes. Am. J. Physiol. Renal Physiol. 293, F974–F984 [DOI] [PubMed] [Google Scholar]
- 6. DeFronzo R. A., Cooke C. R., Andres R., Faloona G. R., Davis P. J. (1975) The effect of insulin on renal handling of sodium, potassium, calcium, and phosphate in man. J. Clin. Invest. 55, 845–855 [DOI] [PMC free article] [PubMed] [Google Scholar]
- 7. Shane M. A., Nofziger C., Blazer-Yost B. L. (2006) Hormonal regulation of the epithelial Na+ channel: from amphibians to mammals. Gen. Comp. Endocrinol. 147, 85–92 [DOI] [PubMed] [Google Scholar]
- 8. Lastra G., Dhuper S., Johnson M. S., Sowers J. R. (2010) Salt, aldosterone, and insulin resistance: impact on the cardiovascular system. Nat. Rev. Cardiol. 7, 577–584 [DOI] [PubMed] [Google Scholar]
- 9. Reaven G. M. (2011) Relationships among insulin resistance, type 2 diabetes, essential hypertension, and cardiovascular disease: similarities and differences. J. Clin. Hypertens. 13, 238–243 [DOI] [PMC free article] [PubMed] [Google Scholar]
- 10. Blazer-Yost B. L., Liu X., Helman S. I. (1998) Hormonal regulation of ENaCs: insulin and aldosterone. Am. J. Physiol. 274, C1373–C1379 [DOI] [PubMed] [Google Scholar]
- 11. Blazer-Yost B. L., Esterman M. A., Vlahos C. J. (2003) Insulin-stimulated trafficking of ENaC in renal cells requires PI 3-kinase activity. Am. J. Physiol. Cell Physiol. 284, C1645–C1653 [DOI] [PubMed] [Google Scholar]
- 12. Zhang Y. H., Alvarez de la Rosa D., Canessa C. M., Hayslett J. P. (2005) Insulin-induced phosphorylation of ENaC correlates with increased sodium channel function in A6 cells. Am. J. Physiol. Cell Physiol. 288, C141–C147 [DOI] [PubMed] [Google Scholar]
- 13. Tallini N. Y., Stoner L. C. (2002) Amiloride-sensitive sodium current in everted Ambystoma initial collecting tubule: short-term insulin effects. Am. J. Physiol. Cell Physiol. 283, C1171–C1181 [DOI] [PubMed] [Google Scholar]
- 14. Wang J., Barbry P., Maiyar A. C., Rozansky D. J., Bhargava A., Leong M., Firestone G. L., Pearce D. (2001) SGK integrates insulin and mineralocorticoid regulation of epithelial sodium transport. Am. J. Physiol. Renal Physiol. 280, F303–F313 [DOI] [PubMed] [Google Scholar]
- 15. Holzman J. L., Liu L., Duke B. J., Kemendy A. E., Eaton D. C. (2007) Transactivation of the IGF-1R by aldosterone. Am. J. Physiol. Renal Physiol. 292, F1219–F1228 [DOI] [PubMed] [Google Scholar]
- 16. Record R. D., Johnson M., Lee S., Blazer-Yost B. L. (1996) Aldosterone and insulin stimulate amiloride-sensitive sodium transport in A6 cells by additive mechanisms. Am. J. Physiol. 271, C1079–C1084 [DOI] [PubMed] [Google Scholar]
- 17. Tiwari S., Nordquist L., Halagappa V. K., Ecelbarger C. A. (2007) Trafficking of ENaC subunits in response to acute insulin in mouse kidney. Am. J. Physiol. Renal Physiol. 293, F178–F185 [DOI] [PubMed] [Google Scholar]
- 18. Vigneri R., Squatrito S., Sciacca L. (2010) Insulin and its analogs: actions via insulin and IGF receptors. Acta Diabetol. 47, 271–278 [DOI] [PubMed] [Google Scholar]
- 19. Li L., Garikepati R. M., Tsukerman S., Kohan D., Wade J. B., Tiwari S., Ecelbarger C. M. (2013) Reduced ENaC activity and blood pressure in mice with genetic knockout of the insulin receptor in the renal collecting duct. Am. J. Physiol. Renal Physiol. 304, F279–F288 [DOI] [PMC free article] [PubMed] [Google Scholar]
- 20. Ge Y., Bagnall A., Stricklett P. K., Strait K., Webb D. J., Kotelevtsev Y., Kohan D. E. (2006) Collecting duct-specific knockout of the endothelin B receptor causes hypertension and sodium retention. Am. J. Physiol. Renal Physiol. 291, F1274–F1280 [DOI] [PubMed] [Google Scholar]
- 21. Pochynyuk O., Rieg T., Bugaj V., Schroth J., Fridman A., Boss G. R., Insel P. A., Stockand J. D., Vallon V. (2010) Dietary Na+ inhibits the open probability of the epithelial sodium channel in the kidney by enhancing apical P2Y2-receptor tone. FASEB J. 24, 2056–2065 [DOI] [PMC free article] [PubMed] [Google Scholar]
- 22. Staruschenko A., Pochynyuk O., Vandewalle A., Bugaj V., Stockand J. D. (2007) Acute regulation of the epithelial Na+ channel by phosphatidylinositide 3-OH kinase signaling in native collecting duct principal cells. J. Am. Soc. Nephrol. 18, 1652–1661 [DOI] [PubMed] [Google Scholar]
- 23. Sun P., Lin D. H., Yue P., Jiang H., Gotlinger K. H., Schwartzman M. L., Falck J. R., Goli M., Wang W. H. (2010) High potassium intake enhances the inhibitory effect of 11,12-EET on ENaC. J. Am. Soc. Nephrol. 21, 1667–1677 [DOI] [PMC free article] [PubMed] [Google Scholar]
- 24. Tiwari S., Blasi E. R., Heyen J. R., McHarg A. D., Ecelbarger C. M. (2008) Time course of AQP-2 and ENaC regulation in the kidney in response to PPAR agonists associated with marked edema in rats. Pharmacol. Res. 57, 383–392 [DOI] [PubMed] [Google Scholar]
- 25. Tiwari S., Sharma N., Gill P. S., Igarashi P., Kahn C. R., Wade J. B., Ecelbarger C. M. (2008) Impaired sodium excretion and increased blood pressure in mice with targeted deletion of renal epithelial insulin receptor. Proc. Natl. Acad. Sci. U. S. A. 105, 6469–6474 [DOI] [PMC free article] [PubMed] [Google Scholar]
- 26. Bens M., Vallet V., Cluzeaud F., Pascual-Letallec L., Kahn A., Rafestin-Oblin M. E., Rossier B. C., Vandewalle A. (1999) Corticosteroid-dependent sodium transport in a novel immortalized mouse collecting duct principal cell line. J. Am. Soc. Nephrol. 10, 923–934 [DOI] [PubMed] [Google Scholar]
- 27. Levchenko V., Zheleznova N. N., Pavlov T. S., Vandewalle A., Wilson P. D., Staruschenko A. (2010) EGF and its related growth factors mediate sodium transport in mpkCCDc14 cells via ErbB2 (neu/HER-2) receptor. J. Cell. Physiol. 223, 252–259 [DOI] [PubMed] [Google Scholar]
- 28. Ilatovskaya D. V., Pavlov T. S., Levchenko V., Staruschenko A. (2013) ROS production as a common mechanism of ENaC regulation by EGF, insulin and IGF-1. Am. J. Physiol. Cell Physiol. 304, C102–C111 [DOI] [PMC free article] [PubMed] [Google Scholar]
- 29. Mamenko M., Zaika O., Ilatovskaya D. V., Staruschenko A., Pochynyuk O. (2012) Angiotensin II increases activity of the Epithelial Na+ Channel (ENaC) in the distal nephron additively to aldosterone. J. Biol. Chem. 287, 660–671 [DOI] [PMC free article] [PubMed] [Google Scholar]
- 30. Ilatovskaya D. V., Pavlov T. S., Levchenko V., Negulyaev Y. A., Staruschenko A. (2011) Cortical actin binding protein cortactin mediates ENaC activity via Arp2/3 complex. FASEB J. 25, 2688–2699 [DOI] [PubMed] [Google Scholar]
- 31. Pavlov T. S., Chahdi A., Ilatovskaya D. V., Levchenko V., Vandewalle A., Pochynyuk O., Sorokin A., Staruschenko A. (2010) Endothelin-1 inhibits the epithelial Na+ channel through betaPix/14-3-3/Nedd4-2. J. Am. Soc. Nephrol. 21, 833–843 [DOI] [PMC free article] [PubMed] [Google Scholar]
- 32. Pavlov T. S., Ilatovskaya D. V., Levchenko V., Mattson D. L., Roman R. J., Staruschenko A. (2011) Effects of cytochrome P450 metabolites of arachidonic acid on the epithelial sodium channel (ENaC). Am. J. Physiol. Renal Physiol. 301, F672–F681 [DOI] [PMC free article] [PubMed] [Google Scholar]
- 33. Frindt G., Palmer L. G. (2012) Effects of insulin on Na and K transporters in the rat CCD. Am. J. Physiol. Renal Physiol. 302, F1227–F1233 [DOI] [PMC free article] [PubMed] [Google Scholar]
- 34. Blazer-Yost B. L., Paunescu T. G., Helman S. I., Lee K. D., Vlahos C. J. (1999) Phosphoinositide 3-kinase is required for aldosterone-regulated sodium reabsorption. Am. J. Physiol. 277, C531–C536 [DOI] [PubMed] [Google Scholar]
- 35. Blazer-Yost B. L., Nofziger C. (2005) Phosphoinositide lipid second messengers: new paradigms for transepithelial signal transduction. Pflügers Arch. 450, 75–82 [DOI] [PubMed] [Google Scholar]
- 36. Wang J., Knight Z. A., Fiedler D., Williams O., Shokat K. M., Pearce D. (2008) Activity of the p110-alpha subunit of phosphatidylinositol-3-kinase is required for activation of epithelial sodium transport. Am. J. Physiol. Renal Physiol. 295, F843–F850 [DOI] [PMC free article] [PubMed] [Google Scholar]
- 37. Baquero A. F., Gilbertson T. A. (2011) Insulin activates epithelial sodium channel (ENaC) via phosphoinositide 3-kinase in mammalian taste receptor cells. Am. J. Physiol. Cell Physiol. 300, C860–C871 [DOI] [PMC free article] [PubMed] [Google Scholar]
- 38. Lu M., Wang J., Jones K. T., Ives H. E., Feldman M. E., Yao L. J., Shokat K. M., Ashrafi K., Pearce D. (2010) mTOR complex-2 activates ENaC by phosphorylating SGK1. J. Am. Soc. Nephrol. 21, 811–818 [DOI] [PMC free article] [PubMed] [Google Scholar]
- 39. Lu M., Wang J., Ives H. E., Pearce D. (2011) mSIN1 protein mediates SGK1 protein interaction with mTORC2 protein complex and is required for selective activation of the epithelial sodium channel. J. Biol. Chem. 286, 30647–30654 [DOI] [PMC free article] [PubMed] [Google Scholar]
- 40. Feldman M. E., Apsel B., Uotila A., Loewith R., Knight Z. A., Ruggero D., Shokat K. M. (2009) Active-site inhibitors of mTOR target rapamycin-resistant outputs of mTORC1 and mTORC2. PLoS Biol. 7, e38. [DOI] [PMC free article] [PubMed] [Google Scholar]
- 41. Song J., Hu X., Riazi S., Tiwari S., Wade J. B., Ecelbarger C. A. (2006) Regulation of blood pressure, the epithelial sodium channel (ENaC), and other key renal sodium transporters by chronic insulin infusion in rats. Am. J. Physiol. Renal Physiol. 290, F1055–F1064 [DOI] [PubMed] [Google Scholar]
- 42. Marunaka Y., Hagiwara N., Tohda H. (1992) Insulin activates single amiloride-blockable Na channels in a distal nephron cell line (A6). Am. J. Physiol. 263, F392–F400 [DOI] [PubMed] [Google Scholar]
- 43. Li G., Barrett E. J., Wang H., Chai W., Liu Z. (2005) Insulin at physiological concentrations selectively activates insulin but not insulin-like growth factor I (IGF-I) or insulin/IGF-I hybrid receptors in endothelial cells. Endocrinology 146, 4690–4696 [DOI] [PubMed] [Google Scholar]
- 44. Gonzalez-Rodriguez E., Gaeggeler H. P., Rossier B. C. (2007) IGF-1 vs insulin: respective roles in modulating sodium transport via the PI-3 kinase/Sgk1 pathway in a cortical collecting duct cell line. Kidney Int. 71, 116–125 [DOI] [PubMed] [Google Scholar]
- 45. Mansley M. K., Wilson S. M. (2010) Effects of nominally selective inhibitors of the kinases PI3K, SGK1 and PKB on the insulin-dependent control of epithelial Na+ absorption. Br. J. Pharmacol. 161, 571–588 [DOI] [PMC free article] [PubMed] [Google Scholar]
- 46. Record R. D., Froelich L. L., Vlahos C. J., Blazer-Yost B. L. (1998) Phosphatidylinositol 3-kinase activation is required for insulin-stimulated sodium transport in A6 cells. Am. J. Physiol. 274, E611–E617 [DOI] [PubMed] [Google Scholar]
- 47. Mansley M. K., Wilson S. M. (2010) Dysregulation of epithelial Na+ absorption induced by inhibition of the kinases TORC1 and TORC2. Br. J. Pharmacol. 161, 1778–1792 [DOI] [PMC free article] [PubMed] [Google Scholar]
- 48. Kirchner K. A. (1988) Insulin increases loop segment chloride reabsorption in the euglycemic rat. Am. J. Physiol. 255, F1206–F1213 [DOI] [PubMed] [Google Scholar]
- 49. Ito O., Kondo Y., Takahashi N., Kudo K., Igarashi Y., Omata K., Imai Y., Abe K. (1994) Insulin stimulates NaCl transport in isolated perfused MTAL of Henle's loop of rabbit kidney. Am. J. Physiol. 267, F265–F270 [DOI] [PubMed] [Google Scholar]
- 50. Li L., Garikepati R. M., Tsukerman S., Tiwari S., Ecelbarger C. M. (2012) Salt-sensitivity of nitric oxide generation and blood pressure in mice with targeted knockout of the insulin receptor from the renal tubule. Am. J. Physiol. 303, R505–R512 [DOI] [PMC free article] [PubMed] [Google Scholar]
- 51. Manhiani M. M., Duggan A. D., Wilson H., Brands M. W. (2012) Chronic intrarenal insulin replacement reverses diabetes mellitus-induced natriuresis and diuresis. Hypertension 59, 421–430 [DOI] [PMC free article] [PubMed] [Google Scholar]
- 52. Hills C. E., Bland R., Bennett J., Ronco P. M., Squires P. E. (2006) High glucose up-regulates ENaC and SGK1 expression in HCD-cells. Cell. Physiol. Biochem. 18, 337–346 [DOI] [PubMed] [Google Scholar]


