Abstract
Vasovagal responses (VVRs) are characterized by transient drops in blood pressure (BP) and heart rate (HR) and increased amplitude of low-frequency oscillations in the Mayer wave frequency range. Typical VVRs were induced in anesthetized, male, Long-Evans rats by sinusoidal galvanic vestibular stimulation (sGVS). VVRs were also produced by single sinusoids that transiently increased BP and HR, by 70–90° nose-up tilts, and by 60° tilts of the gravitoinertial acceleration vector using translation while rotating (TWR). The average power of the BP signal in the Mayer wave range increased substantially when tilts were >70° (0.91 g), i.e., when linear accelerations in the x–z plane were ≥0.9–1.0 g. The standard deviations of the wavelet-filtered BP signals during tilt and TWR overlaid when they were normalized to 1 g. Thus, the amplitudes of the Mayer waves coded the magnitude of the linear acceleration ≥1 g acting on the head and body, and the average power in this frequency range was associated with the generation of VVRs. These data show that VVRs are a natural outcome of stimulation of the vestibulosympathetic reflex and are not a disease. The results also demonstrate the usefulness of the rat as a small animal model for studying human VVRs.—Cohen, B., Martinelli, G. P., Raphan, T., Schaffner, A., Xiang, Y., Holstein, G. R., Yakushin, S. B. The vasovagal response of the rat: its relation to the vestibulosympathetic reflex and to Mayer waves.
Keywords: blood pressure, heart rate, sinusoidal galvanic vestibular stimulation, linear acceleration, faints, otolith system
Neurogenically mediated vasovagal responses (VVRs) in humans are characterized by a sudden drop in arterial blood pressure (BP) and a decrease in heart rate (HR), often followed by a faint, i.e., by vasovagal syncope (VVS) (1). Despite being relatively common (2–4), the origin and neural basis of VVRs are not known (5–7), and there have been no small animal models in which to investigate the central neural mechanisms that produce the VVR (8). Since there are no physical signs of neurogenically mediated VVR or VVS, diagnosis is usually based on history and a tilt test, in which subjects are passively tilted from a supine position to ≈20° from the spatial vertical (to a 70° position) on the tilt table and maintained in that orientation for 10–15 min. Drops in BP and HR during this period presage a faint and confirm the diagnosis of VVS. The passive tilt continuously activates the vestibular otolith organs, the saccule and utricle, as well as body tilt receptors (8, 9), which initiate a VVR in susceptible individuals.
BP and HR are complex signals comprised of multiple waveforms reflecting various processes acting on the cardiovascular system, such as respiration, exertion, diurnal cycles, and hormonal influences. Because the BP and HR waveforms are composed of many different frequencies that vary as a function of time, wavelet analysis is advantageous because it provides information about how each of these various components changes over time. The low-frequency components of BP signals (<0.25 Hz), below the respiratory rate, were discovered by Traube (1865; ref. 10), confirmed by Hering (1869), and further studied by Mayer (11). They were initially termed Traube-Hering-Mayer waves but are now typically referred to simply as Mayer waves. Despite 150 yr of study, the mechanisms underlying the genesis of Mayer waves remains unclear. These waves have been most frequently elicited by hypoxia and loss of blood, but they also occur in the natural state (12, 13).
Oscillatory modulation of BP and HR in the frequency range below breathing, i.e., in the Mayer wave frequency range, could be of peripheral or central origin (11, 12, 14, 15). The phenomenon could originate from blood circulation through the different vascular beds, which contribute to the systemic arterial blood pressure with different strengths. Alternatively, these frequencies could be induced by resonant activation of the baroreflex loop, which may be reflected in the activity of sympathetic neurons (16–18). For example, activation of renal sympathetic nerves by sinusoidal stimulation at a single frequency induces BP oscillations in the Mayer wave range in rabbits (13, 19). Other studies, however, suggest that Mayer waves may originate in the central nervous system (ref. 20; see ref. 12 for review). Regardless, numerous models have posited a fundamental role for Mayer waves in stabilizing BP and HR (15, 21–32), although their role in modulating both BP and HR remains unclear.
We have recently shown that sinusoidal galvanic vestibular stimulation (sGVS) at low frequencies (0.02–0.2 Hz) induces VVRs in anesthetized rats (8). sGVS was introduced and has been used extensively by Macefield and colleagues (33–39) to activate muscle sympathetic nerves in the legs of humans. Applied binaurally at frequencies between 0.5 and 0.8 Hz, sGVS elicits muscle sympathetic nerve activity (MSNA) in the peroneal nerves of supine healthy human subjects. This neuronal activity results in constriction of the blood vessels in the legs, which would serve to prevent pooling of blood on standing. However, it is not known how the neural activity induced by sGVS is altered to produce VVRs.
Based on findings in anesthetized rats, we postulated that sGVS predominantly activates the otolith system, mimicking the effects of pure linear acceleration on the saccule and utricle (40, 41). This finding is consistent with previous reports that sinusoidal otolith stimulation at low g levels can evoke sinusoidal oscillations in BP and HR (42, 43). It is likely that this response is mediated by the vestibulosympathetic reflex (VSR), a pathway involving the vestibular nerve and nuclei that participates in sympathetic control. In fact, sGVS in rats activates neurons in the vestibular nuclei and presympathetic medullary regions that are important for cardiovascular functions (44). However, it is not clear why sGVS produces MSNA in humans and VVRs in the rat. Moreover, the relationship between the neural pathways that generate VVRs and the ones responsible for the VSR is also not known. In view of these questions, the present study compared the effects of sGVS, tilt, and a specific otolith stimulus [translation while rotating (TWR)] on the oscillatory BP and HR responses reflecting Mayer wave activation and VVR generation (8). Using these stimuli, we tested the hypothesis that changes in linear acceleration in the x–z plane of the rat are sufficient to induce VVRs. We were also interested in determining whether VVRs in the rat were a viable small animal model of VVRs in humans, since no such small animal model currently exists.
MATERIALS AND METHODS
Adult male Long-Evans rats (Harlan Laboratories, South Easton, MA, USA) weighing 300–400 g were used in these studies. The experiments and surgical procedures were approved by the Institutional Animal Care and Use Committee of the Mount Sinai School of Medicine (New York, NY, USA). The implantation of a BP measurement device and a head fixation mount were accomplished during the same aseptic surgical session (8, 44). Operations were performed under isoflurane anesthesia (4% induction, 2% maintenance). Telemetric BP sensors (DSI, St. Paul, MN, USA) were implanted in the abdominal aorta through an incision in the groin. The femoral artery was isolated and clamped. A transducer catheter was inserted into this vessel via a small arteriotomy and advanced into the abdominal aorta. The catheter was secured with ties around the artery, and the body of the sensor was placed into a subcutaneous pocket in the flank. After recovery from anesthesia, animals were returned to their cages. Postsurgical pain was managed with buprenorphine (0.05 mg/kg BID, s.c.) for 3 d, and rats were available for experiments 7–10 d after the surgery. Behavioral changes were not evident after this procedure, indicating that there was adequate collateral circulation to the legs despite closure of the femoral artery. In other rats, changes in BP and HR were monitored using photoplethysmography (PPG). Input was derived from a clip attached to one of the paws. PPG gives an accurate measure of HR (44) and a reflection of changes in BP. However, BPs derived from the PPG can be estimated accurately if they are calibrated with an intra-aortic sensor. A complete description and verification of the value of PPG in determining HR is included in a previous report (44).
sGVS
Subdermal needle electrodes were inserted under the skin behind the internal auditory meatus of each ear (8). Currents of 3 mA were applied between the two ears at frequencies between 0.025 and 0.1 Hz. The stimulus consisted of sinusoidal oscillation given over ∼5 min, with 15 min between consecutive stimuli.
Tilt
To investigate the effects of tilt, BP and HR were recorded while animals (anesthetized with isoflurane) were raised in pitch to positions from prone to nose up. The axis of rotation of the animals was 9 cm below and 5 cm behind the rats' hind paws, so that both the vertical semicircular canals and the otolith organs were stimulated by the elevations and depressions. BP and HR were recorded with PPG and/or an intra-aortic sensor and analyzed for transient and oscillatory modulations. In one set of experiments, 3 rats that were susceptible to activation of VVRs by sGVS were tested for the threshold of tilt that would produce a VVR. These rats were tilted from a prone position (0°) to 10, 30, 50, 60, 70, and 90°, in random order. Regardless of whether a VVR was induced, the animals were returned to the prone position for 15 min before receiving the next tilt. One additional animal was repeatedly tilted 90° nose up, nose down, left side down, and right side down in random order.
TWR
TWR was accomplished by moving rats, anesthetized with 0.6 mg/kg mixture of ketamine-xylazine-acepromazine (30-5-1 mg/kg), along a 184-cm linear sled that rotated about a central axis at 300°/s. The test was done in darkness, and rotation continued throughout the test. The animals were prone during the test, resulting in linear acceleration along the x–z plane. Rotation was initiated with the rats placed over the center of the sled, i.e., over the axis of rotation. At 1 min after the onset of rotation, when all semicircular canal responses had dissipated, the animals were moved sinusoidally at 0.025 Hz from one end of the sled to the other. The centripetal acceleration oscillated with an amplitude of 1.8 g. Because the frequency of the sinusoidal oscillation was so low, only minimal Coriolis forces were generated by the oscillations along the linear sled, and they could be neglected (45). BP and HR were monitored with PPG throughout the test. Criteria for producing a VVR were similar to those utilized for sGVS and tilt.
Data analysis
Intra-aortic BPs recorded by telemetric sensor were collected using a wand receiver (DSI) placed in close proximity to the animals. BP data, as well as the position of each axis and GVS current level, were sampled at 1 kHz with 12-bit resolution (Data Translation, Inc., Marlborough, MA, USA). Signals derived from the intra-aortic sensor and PPG were used to analyze BP and compute HR (beats/min) from the systoles.
Wavelet transforms of the BP and HR obtained during sGVS, tilt, and TWR were utilized to assess the temporal changes of the signals for specific frequency bands. A complete description of this analysis is given in a previous publication (8). We have developed an average power metric for wavelet functions that include frequency bands that encompass the Mayer wave range (0.015–0.24 Hz) when animals are tilted at angles of 10, 30, 50, 70, and 90°. The power of the signal having frequency components in the Mayer wave range was computed by squaring the signal reconstructed from components in the Mayer wave range right after the onset of the stimulus. Averaging was done over 10, 40, and 200 s to determine how the averaging period affected peak average power. The analysis was performed using Matlab and its implementation of the Daubechies function, db4, as the mother wavelet (Mathworks, Inc., Natick, MA, USA). Standard deviations of wavelet-filtered responses for each frequency band were computed in order to compare results of wavelet decomposition of different data sets (46).
RESULTS
VVRs from sGVS
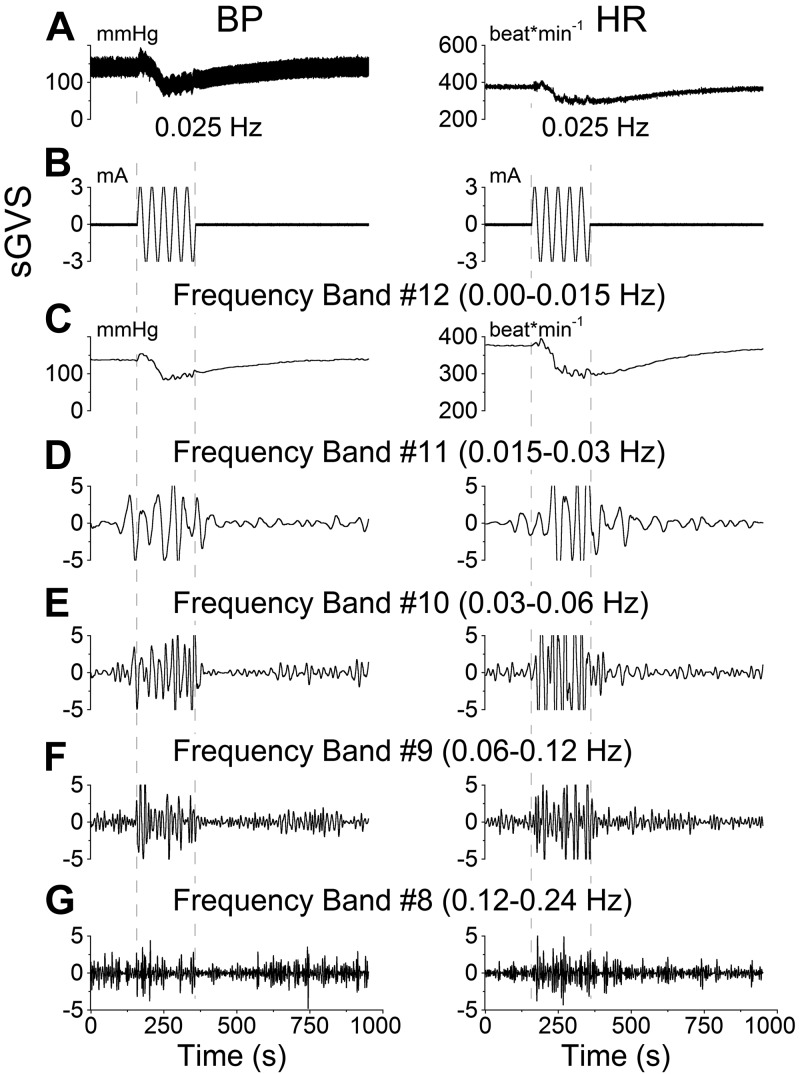
BP and HR responses to sGVS at low frequencies (Fig. 1A, B) in the anesthetized rat consisted of a transient response, characterized by an initial drop in HR and BP and a period of slow recovery that lasted several minutes. Using wavelet analysis, the responses were observed in bands that contained the transient response (Fig. 1C, band 12), the frequency of stimulation (Fig. 1D, band 11), as well as twice (Fig. 1E, band 10), 4 times (Fig. 1F, band 9), and 8 times (Fig. 1G, band 8) the frequency of stimulation. sGVS induced an increase in activity in all frequency bands. The maximal activity of the low-frequency oscillations (Mayer waves) induced by activation at 0.025 Hz was in the band that contained twice the frequency of stimulation (Fig. 1E). Such double oscillations were commonly elicited for sGVS frequencies < 0.1 Hz (8).
Figure 1.
Wavelet analyses of a VVR induced in rat R672 by sGVS at 0.025 Hz, 3 mA. A) Traces of BP (left panel) and HR (right panel). B) sGVS. C–G) Wavelet decomposition of the data from A into 5 frequency bands that comprise the transient response, which includes all low frequencies (band 12 and higher), labeled band 12 for simplicity (C), and the Mayer wave range: band 11 (D), band 10 (E), band 9 (F), and band 8 (G). Left panels: BP. Right panels: HR.
Based on these data, we hypothesized that VVRs are the outcome of strong and/or repeated stimulation of the VSR. To test this, anesthetized rats were repeatedly stimulated with single sinusoids (Fig. 2). Initially, the single sinusoids triggered increases in BP (Fig. 2, trace 1). As stimulation was repeated at 2-min intervals, the stimulus-induced elevation in BP was reduced (Fig. 2, traces 2, 3). The fourth and fifth repetitions of the stimulus produced prolonged drops in BP, characteristic of VVRs. Several minutes later, after the BP had returned to baseline, single sinusoids again produced stable increases in BP (Fig. 2, traces 6–10). This finding demonstrates that VVRs are a natural outcome of activation of the VSR. These data also show that following a VVR, responses to vestibular stimuli through the VSR are stabilized, suggesting that VVRs and syncope are restorative phenomena that stabilize the cardiovascular system's response to vestibulosympathetic activation.
Figure 2.
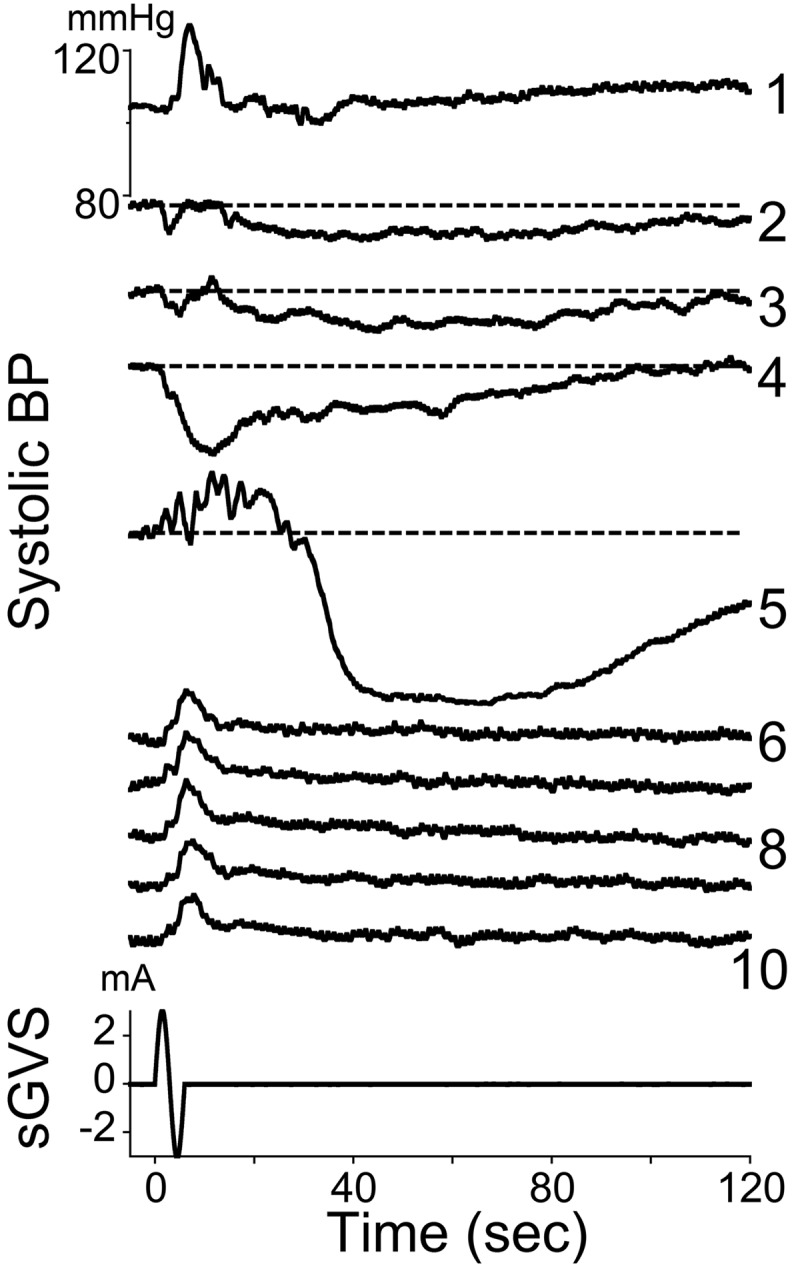
Changes in systolic BP in response to 10 sine waves of 3 mA at 0.05 Hz. Consecutive responses are labeled with numbers on the right. Horizontal dashed lines in responses 2–5 are BP levels at the onset of each stimulus. The fifth sinusoid induced a brief increase in BP with superimposed large oscillations. This was followed by a profound decrease in BP that gradually recovered over several minutes. Subsequent stimulations over the next 25 min only induced increases in BP at a fixed latency, and there were no further drops in BP associated with these increases. Bottom traces: sGVS stimulus (mA) and time (s).
VVRs from tilt
Since VVRs in humans are diagnosed using a tilt test, it was of interest to know whether rats had a threshold for susceptibility to induction of VVRs by tilt. Three rats were placed in a prone position on a horizontal platform and were tilted to angles between 10 and 90° (spatial vertical) while HR was recorded using PPG (Fig. 3). Elevations of 10–60° caused slight increases in HR that slowly attenuated over several minutes after the tilt. One animal had a VVR when tilted 70° (Fig. 3A, blue trace), while all three animals had clear VVRs induced by 90° tilt (Fig. 3, red traces). Thus, the threshold for induction of VVRs in these rats was between 70 and 90° of tilt, which is a change in the direction of the equivalent linear acceleration of gravity (1.0 g) from being through the top of the head to being along the naso-occipital axis. Side-down and nose-down tilts did not produce significant changes in HR and/or BP.
Figure 3.
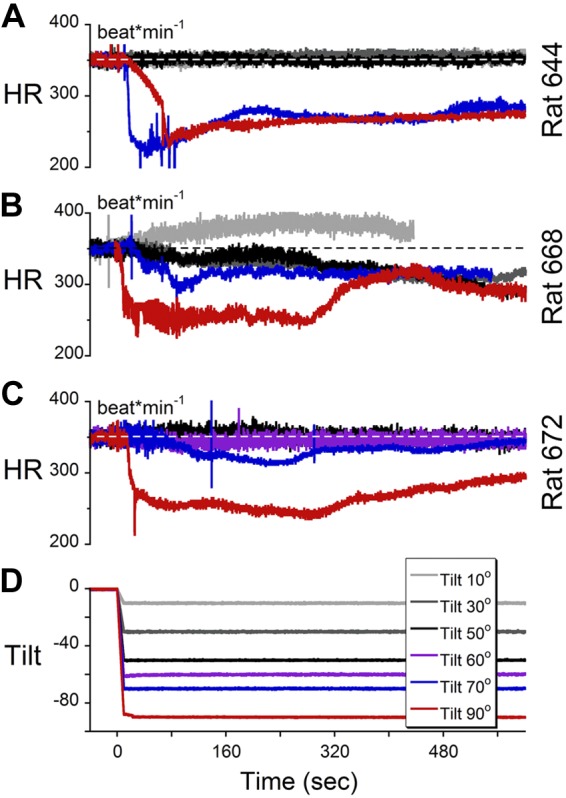
A–C) HR of animals 644 (A), 668 (B), and 672 (C) during tilts at various angles. D) A tilt angle of 90° (red traces) induced VVR in all 3 animals, tilt of 70° induced VVR in rat 644, and tilts <70° did not induce VVR in any of the 3 animals.
VVRs from sGVS and tilt
The relative incidence of susceptibility to VVRs elicited by tilt and by sGVS was determined in a random sample of 14 naive rats using PPG. Six of these subjects (40%) had VVRs induced by sGVS, and 6 (40%) had VVRs induced by 70° tilt. Five animals belonged to both groups, an overlap of 80%. Thus, a relatively high percentage (40%) of anesthetized rats were susceptible to VVR elicited by either sGVS or tilt, with a significant overlap in susceptibility to VVRs from either stimulus. This finding supports the hypothesis that low-frequency sGVS activates the otoliths, as do tilts, and that either stimulus can excite the mechanism that produces VVRs.
Relationship of VVRs during tilt to Mayer waves
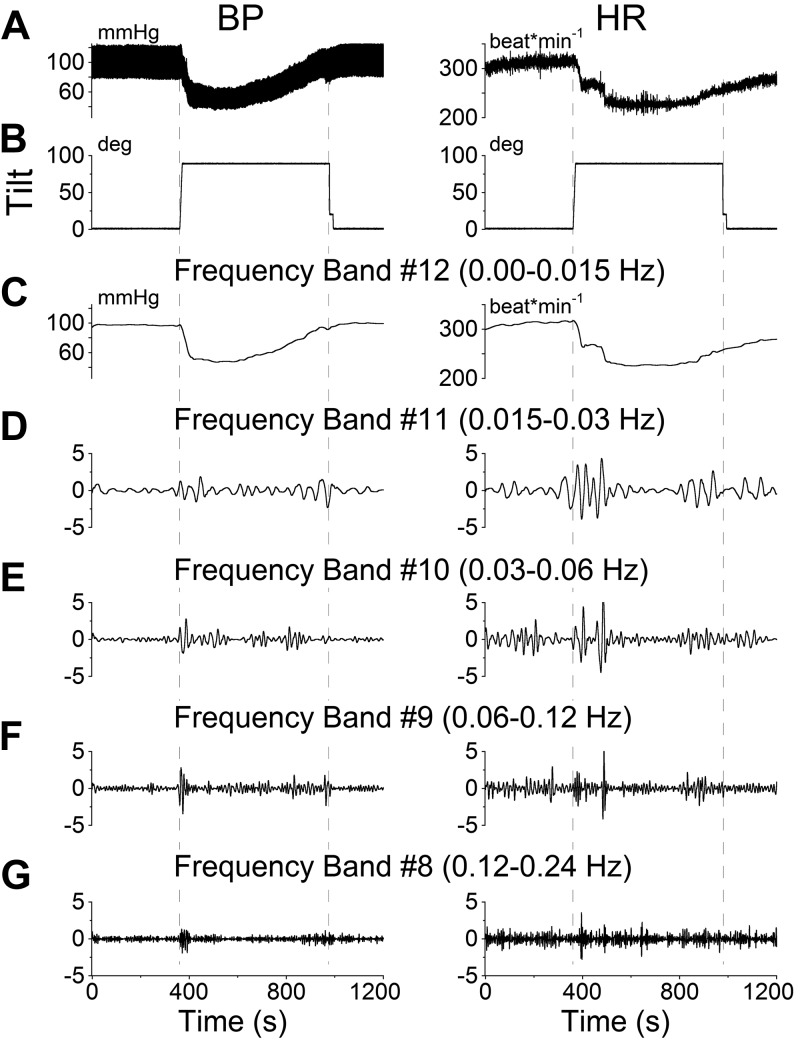
It has been suggested that a close association exists between the initiation of VVRs in human fainters and BP oscillations in the Mayer wave frequency range (33). This possibility was explored by determining whether tilts in the susceptible rats, i.e., rats that had developed VVRs from tilt, were associated with significant changes in the amplitude of BP oscillations in the Mayer wave range, comparable to those induced by sGVS. A typical VVR induced by a 90° tilt (Fig. 4A; BP, left panel; HR, right panel) analyzed with a wavelet transform was composed of a transient response that slowly recovered (Fig. 4C), and large oscillations in the Mayer wave range (Fig. 4D–G) similar to those induced by sGVS (Fig. 1). The frequency band 0–0.015 Hz (Fig. 4C) contained the transient response, which had its lowest value at ≈60 s after the tilt and slowly recovered over ≈8 min. There were also slow oscillations from 0.015–0.06 Hz during the time of the transient response (Fig. 4D, E). In contrast to the continuous oscillation at low frequency induced by sGVS, responses to tilt occurred only when the animals were initially tilted and when they were returned to the prone position; that is, only when the rats experienced linear acceleration.
Figure 4.
Wavelet analyses of the VVR induced in rat R644 by 90° nose-up tilt. A) Traces of BP (left panel) and HR (right panel). B) Tilt angle. C–G) Wavelet decomposition of the data from A into 5 frequency bands that comprise the transient response, which includes all low frequencies (band 12 and higher), labeled band 12 for simplicity (C), and the Mayer wave range: band 11 (D), band 10 (E), band 9 (F), and band 8 (G). Left panels: BP. Right panels: HR.
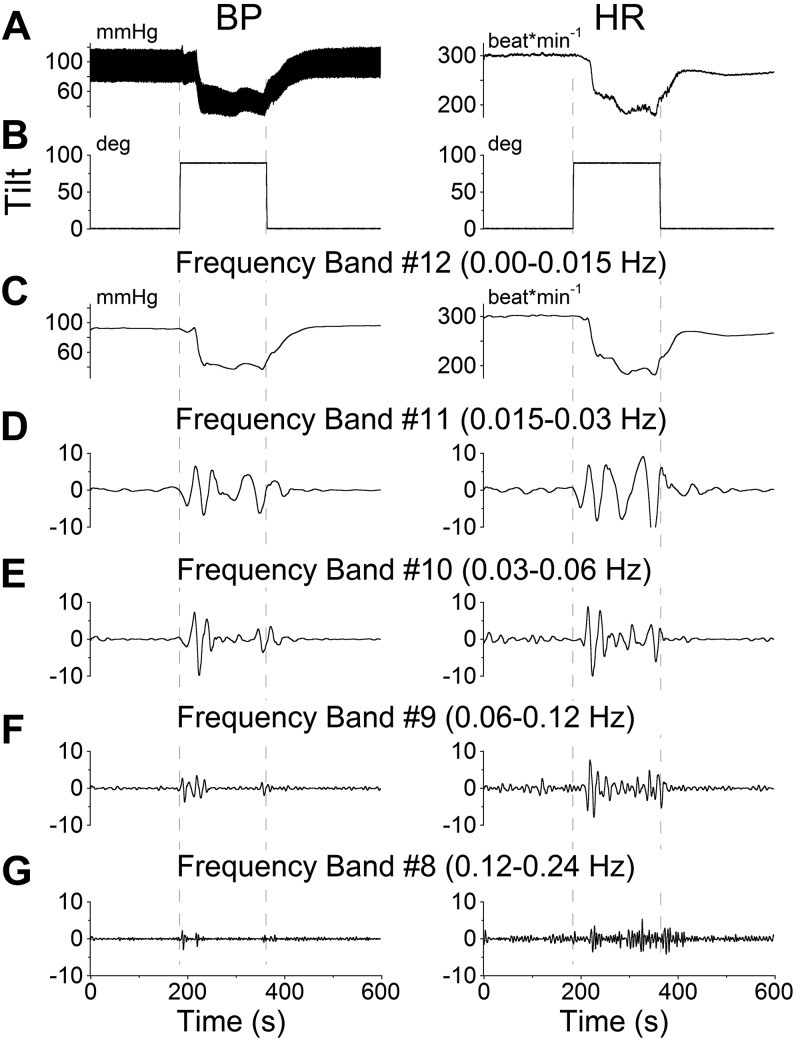
In some experiments, the tilts ended while the transient response was still recovering (Fig. 5). When this occurred, both BP and HR (Fig. 5A; BP, left panel; HR, right panel) rapidly returned toward baseline. While in the past Mayer waves have been associated with BP, these results demonstrate that there are changes in both BP and HR during VVRs. A more complete analysis of the relationship between the Mayer wave oscillations in BP and the oscillations in HR, however, is beyond the scope of this study. Low-frequency oscillations in the Mayer wave range were prominent only during the times when the animal was tilted either to the nose-up position or back to the prone position (Figs. 4 and 5). Thus, VVRs and Mayer wave modulations were induced when there was a change in equivalent acceleration of gravity (1 g) in the x–z plane of the head from being along the top of the head to being along the nose. That is, whenever the animal experienced linear acceleration, either at the beginning or the end of a tilt, an increase was found in Mayer wave amplitude, although VVRs were only induced when animals went from prone to upright, and not the reverse. This supports the finding that an ∼1-g change in linear acceleration in the x–z plane of the head, which produces a tilt of the gravitoinertial acceleration (GIA) vector sensed by the otoliths, is the threshold for production of VVRs in the rat.
Figure 5.
Wavelet analyses of the VVR induced in rat R644 by 90° nose-up tilt. At 200 s after the animal was tilted from prone to upright, it was brought back to the prone position, terminating the induced VVR. A) Traces of BP (left panel) and HR (right panel). B) Tilt angle. C–G) Wavelet decomposition of the data from A into 5 frequency bands that comprise the transient response, which includes all low frequencies (band 12 and higher), labeled band 12 for simplicity (C), and the Mayer wave range: band 11 (D), band 10 (E), band 9 (F), and band 8 (G). Left panels: BP. Right panels: HR.
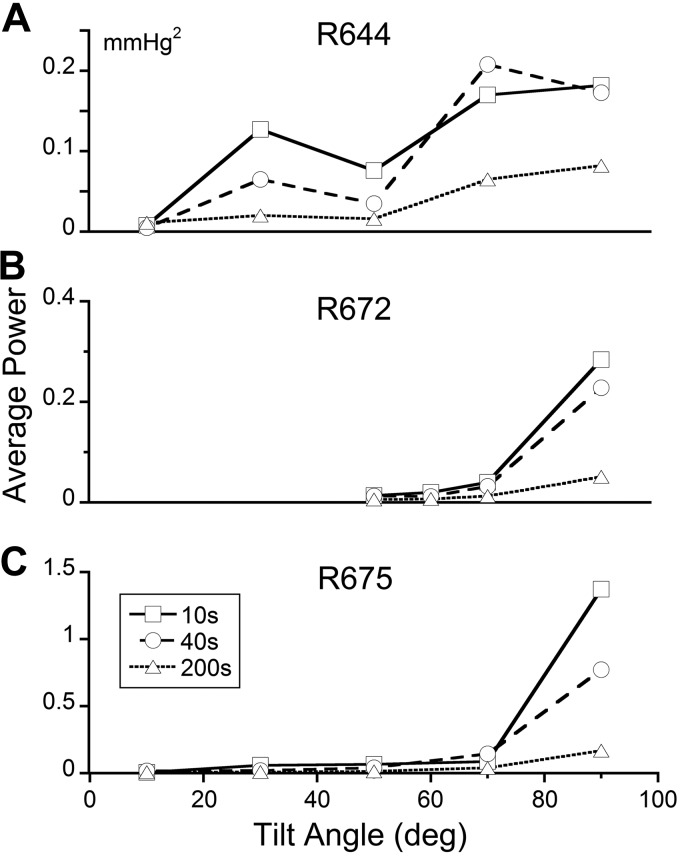
Consistent with this, the average power of the waveforms obtained by adding the component functions in the Mayer wave range increased sharply for tilts greater than ∼70° for all rats and averaging times (Fig. 6). Differences were found, however, when averaging was done for 10-s (Fig. 6, squares), 40 s (Fig. 6, circles), and 200 s (Fig. 6, triangles) following tilts. The greatest power occurred when the averaging was done for 10 s, the shortest time. These data indicate that the central vestibulosympathetic trigger mechanism for initiating a VVR may utilize a short time period for computing whether the composite waveform representing the Mayer waves is oscillating within a stable range trigger period (Fig. 6). In other susceptible animals, the trigger period could be long, extending to 200 s (Fig. 6A). How the trigger period is set is not known. However, we have recently developed a preliminary model in which the vestibular system sets the threshold of a relaxation oscillator that generates systoles and diastoles of blood pressure (unpublished results). All animals required a large tilt or change in linear acceleration (70°) to initiate a VVR, but no significant increase in power was found in the Mayer wave frequency range for tilts up to 70°. This indicates that the normal operation of the VSR over a tilt range of 0–70° is not reflected in increased Mayer wave activity, but when the Mayer wave activity becomes larger for greater tilt angles, the likelihood of a VVR is higher.
Figure 6.
Average power for the signal representing the summation of four detail bands ranging in frequencies associated with Mayer waves of BP after onset of tilt for animals R664 (A), R668 (B), and R672 (C). This was done by summating 4 detail bands with frequencies just above the approximation signal (transient response), comprising frequency bands 11, 10, 9, and 8, with corresponding frequency ranges of 0.015–0.03, 0.03–0.06, 0.06–0.12, and 0.12–0.24 Hz, respectively. Average power was computed over 10 s (squares), 40 s (circles), and 200 s (triangles) s. In all 3 rats, the maximum average power occurred when the averaging was 10 s (shortest time) and for tilts >70°. In all instances, the blood pressure was estimated from the PPG.
Responses to tilts generated by TWR
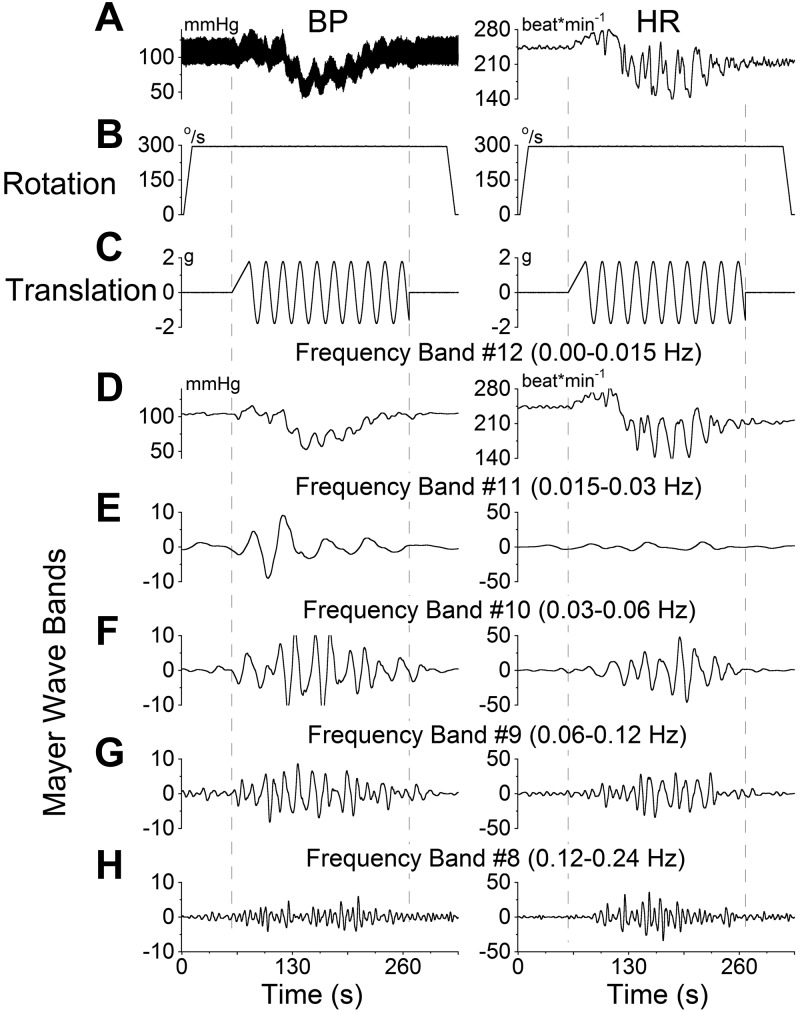
TWR was utilized to determine whether tilting the GIA vector had similar effects to tilting the animal. TWR can induce large linear accelerations in the x–z plane of the body at low frequencies and in a limited space. These tilts of the GIA are produced by combining the linear acceleration induced by the centripetal accelerations of the rotating sled with the linear acceleration of gravity. In one animal, only a transient increase in BP was induced by the increase in linear accleration, but no VVR was produced, suggesting that this animal was not susceptible. Accordingly, sGVS infrequently induced VVRs in this rat. In another animal, however, TWR elicited oscillations in HR in the Mayer wave frequency range and the induction of a typical VVR (Fig. 7). The characteristics of the VVRs induced by TWR were similar to those of VVRs elicited by sGVS. The magnitude of changes in each frequency band, however, was larger than that induced by 90° nose-up tilt. We postulated that this finding was due to the increase in magnitude of the GIA, i.e., that the magnitude of changes in Mayer waves might be related to the magnitude of changes in linear acceleration and tilt (1 g in Fig. 4 vs. 3.6 g in Fig. 7).
Figure 7.
Wavelet analyses of the VVR induced in rat R676 by translation while rotating (300°/s, ±1.8 g). A) Traces of BP (left panel) and HR (right panel). B) Rotational velocity. C) Translation along the long axis of the body. D–H) Wavelet decomposition of the data from A into 5 frequency bands that comprise the transient response, which includes all low frequencies (band 12 and higher), labeled band 12 for simplicity (D), and the Mayer wave range: band 11 (E), band 10 (F), band 9 (G), and band 8 (H). Left panels: BP. Right panels: HR. TWR induces BP and HR traces in the Mayer wave range closely resembling those of tilt and sGVS.
Comparison of responses in the Mayer wave range from various stimuli
To compare the BP responses for tilts and TWR, the variations in the sequence of wavelet coefficients were analyzed for each band for the various stimulus conditions. Since the wavelet coefficients for each frequency band are a filtered and down-sampled time function of BP (Fig. 7 and ref. 47), the standard deviation of the wavelet coefficients associated with each frequency band (bands 1–12; ref. 46) is a representation of the energy in that frequency band after filtering and down-sampling of the BP signal (Fig. 8A). This analysis showed virtually no responses for frequency bands 0–7 either for tilt or TWR (Fig. 8A). The slight deviation of the data from 0 in band 6 reflected the heart rate. The standard deviation for both tilt and TWR rose dramatically in frequency bands 8–12 (0.008–0.24 Hz), which contained the Mayer wave frequency range (Fig. 8A). The significant differences between tilt and TWR were also in these low-frequency bands. Since TWR generates a higher magnitude of the GIA than tilt, TWR data were normalized to 1 g to test the hypothesis that the occurrence of Mayer waves was related to the amplitude of the linear acceleration (Fig. 8B). The normalized data overlapped across the entire Mayer wave band, indicating that the changes in energy in the Mayer wave region were related to both the orientation and magnitude of the changes in linear acceleration relative to the head. Data from sGVS (Fig. 8B, black symbols) at 0.025 Hz, 3 mA overlaid the data from static tilt and the normalized TWR, further supporting the idea that sGVS at this low frequency had activated orientation specific otolith neurons.
Figure 8.
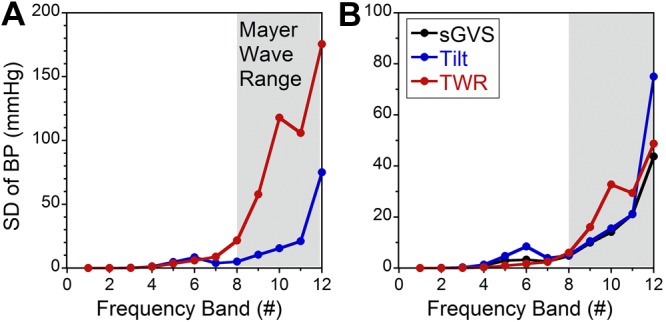
A) Standard deviations of the responses (ordinate) for each frequency band (number on abscissa) for data obtained during static tilt (blue) and TWR (red). Data peaked in the Mayer wave range. B) Graph similar to A, but TWR data are normalized to 1 g. Data obtained during 0.025 Hz, 3 mA sGVS are shown in black. Data indicate that when TWR is normalized to 1 g, the standard deviations of BP associated with tilt, TWR, and sGVS overlaid.
DISCUSSION
One goal of this study was to determine whether VVRs induced by sGVS in rats are a useful model to study the dynamics of VVRs in humans. A second goal was to elucidate the processes that may be responsible for induction of VVRs. With regard to the first, many similarities exist between VVRs induced in rats and in humans. These include the presence of transient and oscillatory responses that recover over minutes and the generation of low-frequency oscillations in both BP and HR that are in the range of Mayer waves (ref. 11; see ref. 12 for review). The proportion of animals that were susceptible to development of VVRs was approximately the same as that of humans who have been referred to the clinic for evaluation of fainting, i.e., ∼40% (ref. 48; see ref. 2 for review). Similarly, the angles of tilt that induced VVRs in the rat were between 70 and 90°, approximately the same as those used during the tilt test to diagnose VVRs in humans (see ref. 49 for review). In addition, a majority of naive rats that developed VVRs in response to sGVS also developed VVRs during tilt. This finding supports the use of sGVS in rats to study the basic dynamics of VVRs.
Although the rat appears to be a good small animal model in which to study the human VVR, some differences remain. First, the rats were anesthetized, whereas VVRs and VVS occur in alert humans. It is not known at present whether a similar incidence of VVRs would occur in alert rats in response to either sGVS or tilt stimuli. In fact, rats may be less sensitive to activation of the sympathetic system when they are alert than when they are under anesthesia (50, 51). Abundant literature supports the ability of humans to suppress sensory input and reflexes consciously, since these techniques are fundamental to yoga, zen, meditation, some forms of prayer, behavioral training, and various biofeedback techniques (52, 53). This finding raises the interesting possibility that the appearance of VVRs and syncope in susceptible individuals may be related to their inability to suppress the reflex mechanism that transitions BP and HR responses to otolith or other sympathetic stimuli into a VVR and syncope.
Furthermore, VVRs and VVS can be induced in humans in many ways that do not overtly appear to involve the vestibular system, including the sight of blood, venipuncture, disturbing personal situations, micturition, extended Valsalva maneuvers, etc. Regardless of the mode of induction of a VVR, it is reasonable to assume that the major site of upstream neural activation is the rostral ventrolateral medullary region, which contains the presympathetic neurons that innervate the intermediolateral cell column of the spinal cord (54). Another difference is that VVRs in the rat occur at or near the time of the tilt, whereas VVRs in humans frequently occur with some delay following the onset of tilt. This is not likely to be a significant limitation of this experimental model, since the onset of the VVR was also delayed in some of the rats. Aside from this longer latency, no other differences were observed in the rat VVRs, suggesting that the latency difference is not a significant parameter.
Currently, no experimental model exists in which to study VVRs, and the underlying central presympathetic processes that induce VVRs and syncope are not known. Thus, while induction of VVRs in the anesthetized rat model differs in some specific and known respects from that in humans, the central processing appears to be the same. Moreover, the ability to generate VVRs consistently and reliably in susceptible animals offers the unique possibility of studying the neural processes that lead to VVRs, which is not feasible in patients who have syncope at widely dispersed intervals. Understanding the vestibular coupling to this pathway would elucidate its neural organization and provide a theoretical basis for the generation of VVS from a wide range of modalities. Therefore, we conclude that the rat model is a useful tool with which to investigate the basic mechanisms that underlie VVRs and syncope.
The present study addressed the mechanisms involved in production of VVRs using sGVS, tilts, and TWR. One embedded question in this research concerns the nature of the neural activation resulting from sGVS. GVS activates all elements in the vestibular nerve, i.e., both canal and otolith inputs (55, 56), as well as both canal and otolith units in the vestibular nuclei (57). Neurons in the lateral canal system are then inhibited, and only those related to the otolith system continue to be active (44). Thus, the main input to the VSR is likely to be derived predominantly from the central otolith system (40, 41), through the caudal descending and medial vestibular nuclei (44). It is clear that vestibular input was activated by sGVS, as well as by tilt and TWR, and the consistency of our results across stimulation paradigms reinforces the suggestion that these stimuli primarily activate central otolith-related pathways.
Linear acceleration and Mayer waves
This study has shown that the vestibular system in the rat has a profound effect on coupling to the Mayer waves, which are oscillations in BP that stabilize the cardiovascular system (11, 12). Susceptible animals had VVRs when they were tilted relative to gravity, and when their bodies remained stationary but the GIA vector was tilted by linear acceleration in the x–z plane during TWR. Linear accelerations of ± 1.8 g in the x–z plane while rotating caused the GIA vector to tilt ∼60°, producing similar results to those obtained when the animal itself was tilted.
It has been postulated that increases in the amplitude of Mayer waves are a precursor of VVR and fainting (33). Aside from hypoxia and blood loss (12, 13), the specific stimuli that generate increased Mayer wave activity have not been clearly identified. Here we demonstrate that the increased energy in the Mayer wave range is related to the linear accelerations of ≥1 g sensed by the otolith organs. To our knowledge, this is the first demonstration of the close association between the amplitude of Mayer waves and large linear accelerations that tilt the GIA vector relative to the head. The trigger mechanism for VVRs from increases in amplitude of Mayer waves needs further exploration, but the present study suggests a threshold level of linear acceleration along the x–z plane that is likely to be needed to activate a VVR. Data in Fig. 8 indicate that integration of activity that triggered a VVR was generally close to the onset of the increase in amplitude of the Mayer waves. This may not be a general requirement, however, because the onset of the VVR was delayed in some rats and in many humans during tilt testing.
sGVS, VVRs, and the VSR: are VVRs a disease?
The calibration of Mayer waves with regard to linear acceleration provided a means to assess the functional significance of sGVS. That is, the level of activation of the Mayer waves induced by 3 mA, 0.025 Hz sGVS was comparable to the activation of Mayer waves induced by 1 g of linear acceleration (Fig. 8). This finding suggests that sGVS was interpreted by the brain as a 1-g oscillating stimulus. The internal calibration from the amplitude of Mayer waves provides a strong justification for the use of sGVS to explore the VSR, which in a normal population causes modulations in MSNA in the Mayer wave range. When the system is heavily stimulated, it generates large-amplitude Mayer waves, inducing VVRs and VVS in susceptible subjects. Support for this comes from the many studies of the functional meaning of sGVS that have been conducted in humans (34–39). These show that such stimuli activate the VSR to produce MSNA in the legs at frequencies that are similar to those determined in rats (8). Together, studies in humans and anesthetized rats now provide a substantial body of data indicating that sGVS activates the normal VSR to maintain BP during changes in head position relative to gravity, and that the VSR can generate VVRs and VVS when the stimulus is sufficiently strong, i.e., when an adequate amplitude of Mayer waves is generated. Thus, in agreement with the suggestion of Alboni et al. (4), we conclude that VVRs are a natural outcome of activation of the VSR, which can stabilize and recalibrate the cardiovascular system to its normal state after extreme stress, and that VVRs and VVS are not a disease.
Acknowledgments
This work was supported by U.S. National Institutes of Health grants DC12573, DC008846, AG035389, DC004996, and DC05204.
The authors thank Kathleen Crosby for editorial assistance and Dmitri Ogorodnikov for technical assistance.
Footnotes
- BP
- blood pressure
- GIA
- gravitoinertial acceleration
- HR
- heart rate
- MSNA
- muscle sympathetic nerve activity
- PPG
- photoplethysmography
- sGVS
- sinusoidal galvanic vestibular stimulation
- TWR
- translation while rotating
- VSR
- vestibulosympathetic reflex
- VVR
- vasovagal response
- VVS
- vasovagal syncope
REFERENCES
- 1. Lewis T. (1932) Vasovagal syncope and the carotid sinus mechanism. Br. Med. J. 3723, 873–876 [DOI] [PMC free article] [PubMed] [Google Scholar]
- 2. Prudham D., Evans J. G. (1981) Factors associated with falls in the elderly: a community study. Age Ageing 10, 141–146 [DOI] [PubMed] [Google Scholar]
- 3. Tinetti M. E., Mendes de Leon C. F., Doucette J. T., Baker D. I. (1994) Fear of falling and fall-related efficacy in relationship to functioning among community-living elders. J. Gerontol. 49, M140–M147 [DOI] [PubMed] [Google Scholar]
- 4. Alboni P., Brignole M., Degli Uberti E. C. (2007) Is vasovagal syncope a disease? Europace 9, 83–87 [DOI] [PubMed] [Google Scholar]
- 5. Connolly S. J., Sheldon R., Thorpe K. (2003) Pacemaker therapy for prevention of syncope in patients with recurrent severe vasovagal syncope. JAMA 289, 2224–2229 [DOI] [PubMed] [Google Scholar]
- 6. Alboni P., Bondanelli M., Dinelli M., Gruppillo P., Franceschetti P., Marchi P., degli Uberti E. C. (2000) Role of the serotonergic system in the genesis of vasovagal syncope. Europace 2, 172–180 [DOI] [PubMed] [Google Scholar]
- 7. Sumner G. L., Rose M. S., Koshman M. L., Ritchie D., Sheldon R. S. (2010) Recent history of vasovagal syncope in a young, referral-based population is a stronger predictor of recurrent syncope than lifetime syncope burden. J. Cardiovasc. Electrophysiol. 21, 1375–1380 [DOI] [PubMed] [Google Scholar]
- 8. Cohen B., Martinelli G. P., Ogorodnikov D., Xiang Y., Raphan T., Holstein G. R., Yakushin S. B. (2011) Sinusoidal galvanic vestibular stimulation (sGVS) induces a vasovagal response in the rat. Exp. Brain Res. 210, 45–55 [DOI] [PMC free article] [PubMed] [Google Scholar]
- 9. Yates B. J., Jian B. J., Cotter L. A., Cass S. P. (2000) Responses of vestibular nucleus neurons to tilt following chronic bilateral removal of vestibular inputs. Exp. Brain Res. 130, 151–158 [DOI] [PubMed] [Google Scholar]
- 10. Traube L. (1865) Ueber periodische Thätigkeits-Aeusserungen des vasomotorischen und Hemmungs-Nervencentrums. Centralbl. Med. Wiss. (Berl.) 3, 881–885 [Google Scholar]
- 11. Mayer S. (1876) Studien zur Physiologie des Herzens und der Blutgefässe. Sitz Kaiser Akad. Wiss. 74, 281–307 [Google Scholar]
- 12. Julien C. (2006) The enigma of Mayer waves: facts and models. Cardiovasc. Res. 70, 12–21 [DOI] [PubMed] [Google Scholar]
- 13. Nowak J. A., Ocon A., Taneja I. (2008) Multiresolution wavelet analysis of time-dependent physiological responses in syncopal youths. Am. J. Physiol. Heart Circ. Physiol. 296, H171–H179 [DOI] [PMC free article] [PubMed] [Google Scholar]
- 14. Malpas S. C., Evans R. G., Head G. A., Lukoshkova E. V. (1998) Contribution of renal nerves to renal blood flow variability during hemorrhage. Am. J. Physiol. 274, R1283–R1294 [DOI] [PubMed] [Google Scholar]
- 15. Malpas S. C., Hore T. A., Navakatikyan M., Lukoshkova E. V., Nguang S. K., Austin P. C. (1999) Resonance in the renal vasculature evoked by activation of the sympathetic nerves. Am. J. Physiol. 276, R1311–R1319 [DOI] [PubMed] [Google Scholar]
- 16. Preiss G., Polosa C. (1974) Patterns of sympathetic neuron activity associated with Mayer waves. Am. J. Physiol. 226, 724–730 [DOI] [PubMed] [Google Scholar]
- 17. Abbiw-Jackson R. M., Langford W. F. (1998) Gain-induced oscillations in blood pressure. J. Math. Biol. 37, 203–234 [DOI] [PubMed] [Google Scholar]
- 18. Burattini R., Borgdorff P., Westerhof N. (2004) The baroreflex is counteracted by autoregulation, thereby preventing circulatory instability. Exp. Physiol. 89, 397–405 [DOI] [PubMed] [Google Scholar]
- 19. Burgess D. E., Hundley J. C., Li S. G., Randall D. C., Brown D. R. (1997) First-order differential-delay equation for the baroreflex predicts the 0.4-Hz blood pressure rhythm in rats. Am. J. Physiol. 273, R1878–R1884 [DOI] [PubMed] [Google Scholar]
- 20. Cavalcanti S., Belardinelli E. (1996) Modeling of cardiovascular variability using a differential delay equation. IEEE Trans. Biomed. Eng. 43, 982–989 [DOI] [PubMed] [Google Scholar]
- 21. Chapuis B., Vidal-Petiot E., Oréa V., Barrès C., Julien C. (2004) Linear modelling analysis of baroreflex control of arterial pressure variability in rats. J. Physiol. 559, 639–649 [DOI] [PMC free article] [PubMed] [Google Scholar]
- 22. deBoer R. W., Karemaker J. M., Strackee J. (1987) Hemodynamic fluctuations and baroreflex sensitivity in humans: a beat-to-beat model. Am. J. Physiol. 253, H680–H690 [DOI] [PubMed] [Google Scholar]
- 23. Guild S. J., Austin P. C., Navakatikyan M., Ringwood J. V., Malpas S. C. (2001) Dynamic relationship between sympathetic nerve activity and renal blood flow: a frequency domain approach. Am. J. Physiol. 281, R206–R212 [DOI] [PubMed] [Google Scholar]
- 24. Hammer P. E., Saul J. P. (2005) Resonance in a mathematical model of baroreflex control: arterial blood pressure waves accompanying postural stress. Am. J. Physiol. 288, R1637–R1648 [DOI] [PubMed] [Google Scholar]
- 25. Kitney R. I. (1979) A nonlinear model for studying oscillations in the blood pressure control system. J. Biomed. Eng. 1, 89–99 [DOI] [PubMed] [Google Scholar]
- 26. Levison W. H., Barnett G. O., Jackson W. D. (1966) Nonlinear analysis of the baroreceptor reflex system. Circ. Res. 18, 673–682 [DOI] [PubMed] [Google Scholar]
- 27. Madwed J. B., Albrecht P., Mark R. G., Cohen R. J. (1989) Low-frequency oscillations in arterial pressure and heart rate: a simple computer model. Am. J. Physiol. 256, H1573–H1579 [DOI] [PubMed] [Google Scholar]
- 28. Ottesen J. T. (1997) Modelling of the baroreflex-feedback mechanism with time-delay. J. Math. Biol. 36, 41–63 [DOI] [PubMed] [Google Scholar]
- 29. Ringwood J. V., Malpas S. C. (2001) Slow oscillations in blood pressure via a nonlinear feedback model. Am. J. Physiol. 280, R1105–R1115 [DOI] [PubMed] [Google Scholar]
- 30. Seydnejad S. R., Kitney R. I. (2001) Modeling of Mayer waves generation mechanisms. IEEE Eng. Med. Biol. Mag. 20, 92–100 [DOI] [PubMed] [Google Scholar]
- 31. Vielle B. (2005) Mathematical analysis of Mayer waves. J. Math. Biol. 50, 595–606 [DOI] [PubMed] [Google Scholar]
- 32. Wesseling K. H., Jansen J. R., Settels J. J., Schreuder J. J. (1993) Computation of aortic flow from pressure in humans using a nonlinear, three-element model. J. Appl. Physiol. 74, 2566–2573 [DOI] [PubMed] [Google Scholar]
- 33. Bent L. R., Bolton P. S., Macefield V. G. (2006) Modulation of muscle sympathetic bursts by sinusoidal galvanic vestibular stimulation in human subjects. Exp. Brain Res. 174, 701–711 [DOI] [PubMed] [Google Scholar]
- 34. El Sayed K., Dawood T., Hammam E., Macefield V. G. (2012) Evidence from bilateral recordings of sympathetic nerve activity for lateralisation of vestibular contributions to cardiovascular control. Exp. Brain Res. 221, 427–436 [DOI] [PubMed] [Google Scholar]
- 35. Grewal T., Dawood T., Hammam E., Kwok K., Macefield V. G. (2012) Low-frequency physiological activation of the vestibular utricle causes biphasic modulation of skin sympathetic nerve activity in humans. Exp. Brain Res. 220, 101–108 [DOI] [PubMed] [Google Scholar]
- 36. Hammam E., James C., Dawood T., Macefield V. G. (2011) Low-frequency sinusoidal galvanic stimulation of the left and right vestibular nerves reveals two peaks of modulation in muscle sympathetic nerve activity. Exp. Brain Res. 213, 507–514 [DOI] [PubMed] [Google Scholar]
- 37. Hammam E., Dawood T., Macefield V. G. (2012) Low-frequency galvanic vestibular stimulation evokes two peaks of modulation in skin sympathetic nerve activity. Exp. Brain Res. 219, 441–446 [DOI] [PubMed] [Google Scholar]
- 38. James C., Stathis A., Macefield V. G. (2010) Vestibular and pulse-related modulation of skin sympathetic nerve activity during sinusoidal galvanic vestibular stimulation in human subjects. Exp. Brain Res. 202, 291–298 [DOI] [PubMed] [Google Scholar]
- 39. James C., Macefield V. G. (2010) Competitive interactions between vestibular and cardiac rhythms in the modulation of muscle sympathetic nerve activity. Auton. Neurosci. 158, 127–131 [DOI] [PubMed] [Google Scholar]
- 40. Cohen B., Yakushin S. B., Holstein G. R. (2012) What does galvanic vestibular stimulation actually activate? Front. Neurol. 2, 90. [DOI] [PMC free article] [PubMed] [Google Scholar]
- 41. Cohen B., Yakushin S. B., Holstein G. R. (2012) What does galvanic vestibular stimulation actually activate: response. Front. Neurol. 3, 148. [DOI] [PMC free article] [PubMed] [Google Scholar]
- 42. Cui J., Iwase S., Mano T., Katayama N., Mori S. (1999) Muscle sympathetic nerve response to vestibular stimulation by sinusoidal linear acceleration in humans. Neurosci. Lett. 267, 181–184 [DOI] [PubMed] [Google Scholar]
- 43. Cui J., Iwase S., Mano T., Katayama N., Mori S. (2001) Muscle sympathetic outflow during horizontal linear acceleration in humans. Am. J. Physiol. 281, R625–R634 [DOI] [PubMed] [Google Scholar]
- 44. Holstein G. R., Friedrich V. L. J., Martinelli G. P., Ogorodnikov D., Yakushin S. B., Cohen B. (2012) Fos expression in neurons of the rat vestibulo-autonomic pathway activated by sinusoidal galvanic vestibular stimulation. Front. Neurol. 3, 4. [DOI] [PMC free article] [PubMed] [Google Scholar]
- 45. Maruta J., Simpson J. I., Raphan T., Cohen B. (2005) Orienting eye movements and nystagmus produced by translation while rotating (TWR). Exp. Brain Res. 163, 273–283 [DOI] [PubMed] [Google Scholar]
- 46. Marrone A., Polosa A. D., Scioscia G., Stramaglia S., Zenzola A. (1999) Wavelet analysis of blood pressure waves in vasovagal syncope. Physica A 271, 458–469 [DOI] [PubMed] [Google Scholar]
- 47. Strang G., Nguyen T. (1996) Wavelets and Filter Banks, Wellesley-Cambridge Press, Cambridge, MA, USA [Google Scholar]
- 48. Manolis A. S., Linzer M., Salem D., Estes N. A. M., III (1990) Syncope: current diagnostic evaluation and management. Ann. Intern. Med. 112, 850–863 [DOI] [PubMed] [Google Scholar]
- 49. Card J. P., Sved J. C., Craig B., Raizada M., Vazquez J., Sved A. F. (2006) Efferent projections of rat rostroventrolateral medulla C1 catecholamine neurons: implications for the central control of cardiovascular regulation. J. Comp. Neurol. 499, 840–859 [DOI] [PubMed] [Google Scholar]
- 50. Elghozi J. L., Laude D., Girard A. (1991) Effects of respiration on blood pressure and heart rate variability in humans. Clin. Exp. Pharmacol. Physiol. 18, 735–742 [DOI] [PubMed] [Google Scholar]
- 51. Myers C. W., Cohen M. A., Eckberg D. L., Taylor J. A. (2001) A model for the genesis of arterial pressure Mayer waves from heart rate and sympathetic activity. Auton. Neurosci. 91, 62–75 [DOI] [PubMed] [Google Scholar]
- 52. Guyton A. C., Harris J. W. (1951) Pressoreceptor-autonomic oscillation; a probable cause of vasomotor waves. Am. J. Physiol. 165, 158–166 [DOI] [PubMed] [Google Scholar]
- 53. Guyton A. C. (1952) Vasomotor waves possibly resulting from CNS ischemic reflex oscillation. Am. J. Physiol. 170, 601–605 [DOI] [PubMed] [Google Scholar]
- 54. Kaminski R. J., Meyer G. A., Winter D. L. (1970) Sympathetic unit activity associated with Mayer waves in the spinal dog. Am. J. Physiol. 219, 1768–1771 [DOI] [PubMed] [Google Scholar]
- 55. Goldberg J. M., Fernandez C., Smith C. E. (1982) Responses of vestibular-nerve afferents in the squirrel monkey to externally applied galvanic currents. Brain Res. 252, 156–160 [DOI] [PubMed] [Google Scholar]
- 56. Goldberg J. M., Smith C. E., Fernández C. (1984) Relation between discharge regularity and responses to externally applied galvanic currents in vestibular nerve afferents of the squirrel monkey. J. Neurophysiol. 51, 1236–1256 [DOI] [PubMed] [Google Scholar]
- 57. Courjon J. H., Precht W., Sirkin D. W. (1987) Vestibular nerve and nuclei unit responses and eye movement responses to repetitive galvanic stimulation of the labyrinth in the rat. Exp. Brain Res. 66, 41–48 [DOI] [PubMed] [Google Scholar]


