Abstract
The cytoskeleton determines cell shape and is involved in cell motility. It also plays a role in differentiation and in modulating specialized cellular functions. LIM kinase 1 (LIMK1) participates in cytoskeletal remodeling by phosphorylating and inactivating the actin-severing protein, cofilin. Severing F-actin to release G-actin monomers is required for actin cytoskeletal remodeling. Although less well established, LIMK1 may also influence the cell cycle and modulate metalloproteinase activity. Since the role of LIMK1 in bone cell biology has not been reported, the skeletal phenotype of LIMK1−/− mice was examined. LIMK1−/− mice had significantly reduced trabecular bone mass when analyzed by micoCT (p <0.01). Histomorphometric analyses demonstrated a 31% reduction in the number osteoblasts (p=0.0003) and a 23% reduction in osteoid surface (p=0.0005). The number of osteoclasts was no different in control and knock out animals. Consistent with the in vivo findings in osteoblasts, the number of osteoblast colony forming units in LIMK1−/− bone marrow was reduced by nearly 50%. Further, osteoblasts isolated from LIMK1−/− mice showed significantly reduced rates of mineralization in vitro. Osteoclasts from LIMK1−/− mice evidenced more rapid cytoskeletal remodeling in response to treatment with CSF1. In keeping with this latter finding, basal levels of phospho-cofilin were reduced in LIMK1−/− osteoclasts. LIMK1−/− osteoclasts also resorbed dentine slices to a greater extent in vitro and were more active in a pit assay. These data support the hypothesis that LIMK1 is required for normal osteoblast differentiation. In addition, its absence leads to increased cytoskeletal remodeling and bone resorption in osteoclasts.
Keywords: osteopenia, LIM kinase 1, osteoblasts, osteoclasts, CSF1
Introduction
The cytoskeleton is highly dynamic and carefully regulated. It is modulated by the extracellular matrix, mechanical forces and intracellular signaling cascades activated by integrins, hormones and cytokines. In addition to its impact on cell size and shape, the cytoskeleton plays an important role in cell differentiation as well as in maintaining specialized cellular functions [1][2][3]. Despite this, the role of the cytoskeleton in regulating bone cell function, particularly in osteoblasts, has not been very well studied. None-the-less, available evidence underscores the importance of cytoskeletal architecture in regulating osteoblasts. Meyers et al. and Zayzafoon et al. have reported that osteoblastic differentiation of multipotent human mesenchymal stem cells (hMSCs) was suppressed when these cells were cultured in modeled microgravity that was associated with reduced integrin signaling. Interestingly, adipocyte differentiation was enhanced [4][5]. The same group of investigators also found that reduced gravitational force was associated with reduced RhoA activity, impaired phosphorylation of cofilin and reduced stress fiber formation in hMSCs, which demonstrated impaired differentiation to osteoblasts [6]. Forced expression of constitutively active RhoA restored stress fiber formation and enhanced osteoblast differentiation of these cells. In addition to F-actin, the microtubular component of the cytoskeleton is important for maintaining osteoblast function since cytochalasin D has been shown to reduce integrin signaling as well as osteopontin and alkaline phosphatase expression in osteoblast-like cells [7][8]. Furthermore, McBeath et al. reported that cell shape and cytoskeletal tension regulate commitment of hMSCs to different lineages [9].
Osteoclasts are highly motile cells that move along the bone surface while resorbing skeletal matrix. Since remodeling of the cytoskeleton is required for motility, regulation of the osteoclast cytoskeleton has been more extensively studied [10][11]. Although the physiologic regulators of cytoskeletal remodeling and motility in osteoclasts are not known, CSF1 is a likely candidate. Several groups, including our own, have shown that CSF1 is potent chemoattractant for osteoclasts [12]. We have also shown that when CSF1 binds to its receptor, c-fms, it recruits PI3-kinase and c-Src. This activated complex results in increased activity of the guanine nucleotide exchange factor, Vav3. Vav3 in turn leads to activation of the small GTPase Rac, which induces actin cytoskeletal remodeling. Inhibiting Rac activity prevents CSF1-induced actin remodeling [12]. Wang et al. have reported that Rac plays an important role in regulating the actin cytoskeleton during osteoclast differentiation [13]. There are two major isoforms of Rac expressed in osteoclasts, Rac1 and Rac2, and we have reported that osteoclasts isolated from Rac2 knock out mice have impaired chemotaxis in a CSF1 gradient [14].
The small GTPases, Rac, Rho and Cdc42, control actin dynamics and focal adhesion assembly in response to extra- and intracellular stimuli [15]. Cofilin, one of the actin-severing proteins, is a key regulator of actin remodeling [16]. Cofilin severs F-actin to generate G-actin monomers making them available for cytoskeletal remodeling. The small GTPases, in particular Rac, are thought to regulate cofilin activity through a molecular pathway in which Rac activates the serine/threonine kinase Pak1 that in turn affects the activity of LIM kinase 1 (LIMK1) [17][18]. LIMK1 is a serine/threonine kinase that phosphorylates and inactivates cofilin [19]. The actin-binding activity of phospho-cofilin is reduced, resulting in actin polymerization and stabilization [20]. One might therefore predict that inactivation of LIMK1 would result in reduced cell motility. However, suppressing LIMK1 has been reported to either increase or reduce cytoskeletal remodeling and cell motility, depending on the cellular context [21][22]. In addition to its established role in regulating cofilin, emerging if still somewhat preliminary evidence suggests additional functions for LIMK1. Murine LIMK1 has been reported to bind to the cyclin inhibitor, p57KIP2, raising the possibility that LIMK1 might influence cell cycle progression [23, 24]. It has also recently been reported to regulate the activity of matrix metalloproteinases in a prostate cancer cell line [25].
Since the role of LIMK1 in regulating bone metabolism has not been explored, we examined the skeletal phenotype of 8-9 week-old LIMK1 knock out mice. Given the important role ascribed to LIMK1 in regulating actin remodeling we wondered whether bone cell function would be altered in LIMK1 knock out mice. We report that in absence of LIMK1, both osteoblast and osteoclast function are altered and are associated with a low bone mass phenotype.
Materials and Methods
LIMK1 knock out mice
LIMK1 knock out mice were kindly provided by Dr. Zhenping Jia, (The Hospital for Sick Children, Toronto CA) [26]. These animals are on a C56/Bl6 background. Heterozygous animals were served as controls in this study. All animal studies were conducted with approval of the Yale Animal Care and Use Committee.
Materials
Recombinant human Colony Stimulating Factor 1 (CSF1) was a generous gift from Genetics Institute (Cambridge, MA). Recombinant mouse RANKL and TNF-α were from R & D Systems,Inc (Minneapolis,MN). α-MEM cell culture medium was purchased from Sigma-Aldrich (St. Louis, MO) and fetal bovine serum from Atlanta Biologicals (Lawrenceville, GA). Ficoll-Paque® was from GE Healthcare (Kings Park, NY). Etched gridded coverslips were purchased from BELLCO Glass, Inc. (Vineland, NJ). Twenty four well Osteo Assay Plates® were from Corning Inc. (Corning,NY). Type I collagen was purchased from Nitta Gelatin (Osaka, Japan). Collagenase A and Dispase II used in collagenase digestion protocols were purchased from Roche (Indianapolis, IN). Cofilin and phospho-cofilin antibodies were purchased from Cell Signaling (Danvers, MA). Phalloidin was from Molecular Probes (Eugene, OR). Vectashied mounting medium with DAP1 was from Vector Laboratories (Burlingame, CA).
Bone densitometry
Bone mineral density (BMD) determinations of spine, femur and total body were acquired using a PIXImus densitometer (GE-Lunar Corp., Madison, WI) running software version 1.45 as previously described [27]. BMD values are expressed in gms/cm2.
MicroCT analyses
Femurs were stripped of soft tissue and stored in 70% EtOH at 4 °C for subsequent microcomputed tomographic analyses (μCT). The bones were scanned using a Scanco μCT-35 instrument (Scanco, Brutissellen, Switzerland) as previously described [14]. Volumetric regions for trabecular analyses, selected within the endosteal borders of the distal femoral metaphysis to include the secondary spongiosa located 1 mm from the growth plate and extending 1 mm proximally, were scanned at 12 μm resolution. Cortical morphometry was quantified and averaged volumetrically through 50 serial cross-sections (600 μm) extending distally from the diaphyseal mid-point between proximal and distal growth plates. We used a customized thresholding technique (Scanco, Brutissellen, Switzerland) that provided the best segmentation of the bone tissue. Both 2- and 3-D μCT data included bone volume to total volume fraction (BV/TV), and trabecular number (Tb.N), thickness (Tb.Th), space (Tb.Sp) and connectivity density (Conn.D). Cortical thickness averaged for both cortices (Cor.Th) was also quantified.
H&E Staining
Femora were stripped of soft tissue and fixed in 4% paraformaldehyde for 24 hours. They were then washed for 2-3 hours in running water, decalcified in Deltaform (Delta Medical, Inc, Pewaukee, WI) for two weeks and paraffin sections prepared. After the slides were deparaffinized, they were stained with freshly filtered Harrris's hemotoxlin and eosin solutions.
Bone histomorphometry
Undecalcified tibiae embedded in methylmethacrylate utilizing the rapid embedding method, were cut into 4-μm longitudinal sections, mounted on chrome-alum gelatin-coated slides and stained with 2 % toluidine blue (pH3.7) in citric acid buffer for light microscopy as we have previously reported [27]. Sections were examined in a blinded fashion using the Osteomeasure software program (Osteometrics, Atlanta, GA) to quantify histomorphometric parameters. All indices were defined according to the American Society of Bone and Mineral Research histomorphometry nomenclature [28]. To assess mineral apposition and bone formation rates, animals received intraperitoneal injections of calcien (30 mg/kg) seven days and again one day prior to sacrifice.
Quantification of marrow fat
Marrow fat was quantified in fixed bone slices from the tibiae of LIMK1−/− and control mice by measuring the area of adipocyte ghosts in the proximal tibiae using Osteomeasure software. Four fields at 20× in the proximal tibiae just below the growth plate from 11 control and 11 knock out animals were evaluated. Percent fat for the total bone area (the latter also quantified using Osteomeasure software) was determined.
Isolation of bone marrow cells
Primary bone marrow cells (BMCs) were flushed from the marrow of tibiae and femurs using 3 cc syringes containing α-MEM with 10 % FBS and either 22-gauge needles for femurs or 25-gauge needles for tibiae. Cells were collected by centrifugation at 250 × g for 5 min, and nucleated cells counted using a hemocytometer.
Primary osteoblast-enriched cultures
Murine calvarial osteoblasts (OBs) from 3- to 5-day-old mice were prepared by sequential collagenase digestion as previously described [29]. Cells collected from the second through fifth collagenase digestions were pooled and used in co-cultures, in vitro proliferation assays and mineralization assays.
Isolation of mature osteoclasts
Mature osteoclasts (OCs) were isolated from neonatal murine long bones by mechanical disaggregation as previously reported [30]. Freshly isolated mature osteoclasts were used in cell-spreading assays and for confocal microscopy. Osteoclast-like cells (OCLs) were generated in vitro by co-culturing murine OBs and BMCs in the presence of 1,25-dihydroxyvitamin D3 and prostaglandin E2 as previously described [30]. To prepare LIMK1−/− OCLs, BMCs isolated from LIMK1−/− animals were co-cultured with OBs prepared from neonatal LIMK1−/− mice.
Detection and quantification of osteoblast progenitors
BMCs were plated in 10-cm2 dishes, in triplicate, at a density of 2.5 × 10⁶ nucleated cells/dish in a final volume of 10 ml of α-MEM containing 10 % FBS, 50 μM ascorbic acid, 10 mM β-glycerophosphate, 1 % penicillin-streptomycin. Cells were maintained for 10 d at 37 °C in a humidified incubator. Half of the media was replaced every 5 d. Three plates from each mouse were stained at 10 d for alkaline phosphatase and subsequently counted macroscopically for positive staining colonies (CFU-OBs) by two independent readers.
In vitro osteoblast proliferation rates
OBs were isolated from the calvariae of neonatal LIMK1−/− and control mice as described above. Cells were plated at an initial density of 5 ×10⁴ cells/60 mm dish. Cell counts were performed daily for 5 days. At each time point, 3 dishes were counted in quadruplicate. Three separate cell preparations from animals of each genotype were used.
In vitro osteoclast precursor proliferation rates
Osteoclast precursors were isolated from the bone marrow of wild type and LIMK1−/− mice. Red blood cells were lysed in unfractionated bone marrow on ice for 5 minutes. The mononuclear cells were centrifuged, washed with PBS, and seeded in phenol red-free α-MEM containing 10% FBS and CSF1 at a final concentration of 100 ng/ml. Nineteen hours later, non-adherent cells were harvested, washed in PBS and plated at a final concentration of 5 × 10⁵ cells per well of a 6-well plate. Cells were cultured in phenol red-free α-MEM containing 10% FBS and 100 ng/ml CSF1 and cell number determined serially over 6 days using a hemocytometer. Each time point was measured in two separate wells and cell counts were determined in duplicate for each well.
Osteoblast mineralization assays
OBs were seeded to 6-well plates at 4000/cm2 in α-MEM supplemented with 10 % FBS, 1 % penicillin-streptomycin. After reaching confluence, cells were incubated in mineralization medium (α-MEM with 10 % FBS and 1% penicillin-streptomycin with10 mM β-glycerophosphate) for 14 days. Cell layers were extracted to measure calcium and phosphorus content, or for RNA preparation. Cell layers were also fixed in 10% neutral formalin solution, and stained for mineral using the Von Kossa protocol.
Calcium and phosphorus measurements in cell layer extracts
Calcium and phosphorus were measured using commercially available colorimetric assays (Sigma-Aldrich, St Louis, MO).
Quantitative Real Time PCR
Total RNA was isolated using TRIzol (Invitrogen, Carlesbad, CA) and an RNeasy kit (Qiagen, Valencia, CA) per the manufacturers' instructions. cDNA synthesis was carried out at 43° C for 45 minutes followed by denaturation at 95° C for 5 minutes using a cDNA synthesis kit (Stratagene, La Jolla, CA). Quantitative Real Time PCR (qPCR) was performed with TaqMan PCR reagent kits (Stratagene, La Jolla, CA) using 40 ng of RNA with a reaction volume of 20 μl in the Opticon 2 DNA Engine Continuous Fluorescence Detection System (MJR, Waltham, MA). Specific primer/probe sets for target genes were purchased from Applied Biosystems (Foster City, CA) and references are shown in Table 1. All qPCR reactions were performed in duplicate and cycling conditions were 95° C for 20 sec and 60° C for 1 min for 39 cycles. The amplification signal from the target gene was normalized to a β -glucuronidase signal in the same reaction. The relative expression levels were determined using the comparative CT method (also known as the 2CT method). Data are presented as the relative mRNA levels in LIMK1+/− vs. LIMK1−/−.
Table 1. TaqMan* assays used for qPCR reactions.
| Gene symbol | NCBI gene reference | TaqMan assay ID |
|---|---|---|
| Gusb | NM_010368.1 | Mm00446953_m1 |
| Alpl | NM_007431.2 | Mm01187113_g1 |
| Runx2 | NM_009820.3 | Mm03003491_m1 |
| Ocn | NM_031368.4 | Mm01741771_g1 |
| Col1a1 | NM_007742.3 | Mm00801666_g1 |
| Osx | NM_130458.3 | Mm04209856_m1 |
TaqMan assays are from Applied Biosystems (Foster City, CA).
Spreading assay
Authentic OCs were plated onto gridded coverslips for 1.5 hours in α-MEM containing 10 % FBS. The FBS concentration was then reduced to 2 % for an additional 1.5 hours. The coverslips were washed and the concentration of FBS reduced to 1 %. Images of OCs were recorded before and after 15 and 30 minutes of treatment with either 2.5 nM CSF1 or vehicle. Changes in cell area were quantified using Image J software version 1.34s and expressed as percent change from baseline cell area.
Protein assay
The concentration of protein in cell lysates was measured using a BCA Protein Assay Kit (Pierce, Rockford, IL) and the manufacturer's recommended protocol. Absorbance was measured at 560 nm using a VICTOR3 1420 multilabel plate reader (PerkinElmer, Waltham, MA).
Immunoblotting
OCLs from LIMK1+/− and LIMK1−/− animals cultured on plastic were used to prepare cell lysates for Western blotting. After 7 days in co-culture, the OB layer was removed by 5 mM EDTA. Cells were then treated with α-MEM plus 1 % FBS containing either vehicle or 2.5 nM CSF1 for 2, 10 and 15 minutes. Equal amounts of clarified cell lysates were subjected to SDS polyacrylamide gel electrophoresis and transferred onto nitrocellulose paper (Trans-Blot Transfer Medium; Bio-Rad Inc, Hercules, CA). After SDS–PAGE and trans-blotting, nitrocellulose membranes were probed with an anti-phospho-cofilin antibody or an anti-cofilin antibody. The blots were developed using HRP-conjugated secondary antibodies (Promega; Madison, WI) following by enhanced chemiluminescence detection (ECL detection kit; Amersham Inc., Piscataway, NJ). Primary calvarial OBs, isolated as described above, were lysed, cellular protein extracted and analyzed by Western blotting for phospho-cofilin and cofilin exactly as just described for OCLs.
In vitro bone resorption assay
To quantify resorptive activity, LIMK1+/− or LIMK1−/− OCLs were generated on collagen-coated dishes as described by Suda and colleagues [31]. After 7 days, OCLs were released from the collagen gels by collagenase digestion. They were then replated onto dentine slices (OsteoSite Dentine Disc; Immunodiagnostic Systems Inc., Scottsdale, AZ) for 3 days and the concentration of the crosslinked c-teleopeptide of type I collagen (CTX) in the culture media quantified using the CrossLaps for Culture ELISA (Nordic Bioscience, Herlev, Denmark) and the manufacturer's recommended protocol.
Pit Formation Assay
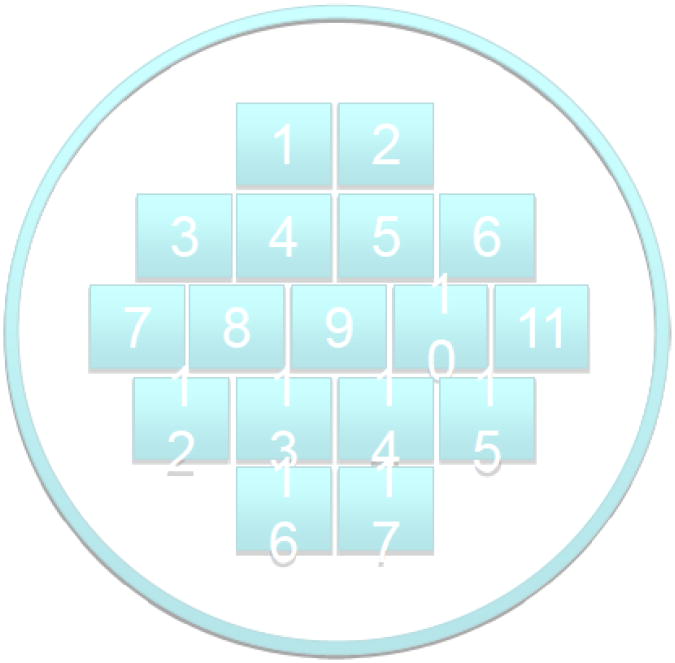
We also determined the resorbing potential of OCLs generated from osteoclast precursors isolated from LIMK1+/− and LIMK1−/− mice. Unfractionated bone marrow cells were isolated from 8-week old LIMK1+/− and LIMK1−/− male mice and centrifuged for 10 min at 1000 × g. The cell pellet was resuspended and the cells plated overnight in 10 ml of α-MEM containing 10% FBS and 100 ng/ml of CSF1 in 10-cm dishes. Non-adherent cells were then collected and layered on 10 ml of Ficoll-Paque and centrifuged for 20 min at 707 × g. Cells at the interface were collected and washed twice with ice-cold PBS and plated in Osteo Assay® plates at a density of 2.5 × 10⁵/well in α-MEM containing 10 % FBS, 75 ng/ml CSF1, 75 ng/ml RANKL and 10 ng/ml of TNF-α. Cells were maintained at 37 °C in a humidified incubator with a media change every other day. On day 7 of culture, media were aspirated, and 600 μL of 10% sodium hypochlorite added to each well for 5 min at room temperature. The wells were then aspirated, washed twice with 900 μL of deionized water and allowed to dry completely at room temperature. Three separate wells were analyzed for each genotype. Resorbed area was quantified in seventeen fields at 100× magnification for each genotype using the template shown in Fig. 1 and the mean value for all 17 fields compared. Pit area was measured using Adobe Photoshop CS3 (Adobe Systems Inc., San Jose, Ca) and expressed as number of pixels.
Figure 1. Template used for quantifying the resorbed surface of Osteo Assay plates.
The template shown was used to analyze the resorbed surface of Osteo Assay plates. Resorbed area was measured at 100× magnification and expressed as pixels.
Serum CTX measurements
Serum CTX was measured using a commercially available EIA (RatLaps EIA, Immunodiagnostic Systems Inc., Scottsdale, AZ).
Quantifying actin ring formation in freshly isolated mature osteoclasts
LIMK1+/− and LIMK−/− osteoclasts were isolated as described above and allowed to attach to coverslips for 6 to 7.5 hours in α-MEM containing 10% FBS. Cells were fixed in 4% paraformaldehyde at room temperature for 15 minutes and washed. Coverslips were incubated with Alexa Fluor 488 phalloidin for 30 minutes then washed and mounted in Vectashied mounting medium. Cells were examined using a Zeiss LSM 710 confocal imaging system and the number of mulitnucelated cells with complete actin rings counted. Between 2 and 3 animals of each genotype were analyzed per experiment. Average values from 2 experiments are summarized in the Results.
Phalloidin staining of osteoblasts and osteoclasts
Calvarial OBs and mature OCs were isolated from LIMK1+/− and LIMK1−/− animals as described above and plated on FBS-coated glass coverslips for 24 hrs for osteoblasts or 6 hrs for osteoclasts. Cells were then fixed and stained with phalloidin at a final concentration of 0.165 μM. Cell were imaged using a Zeiss LSM 510 Meta argon confocal microscope (Carl Zeiss Microimaging, Thornwood, NY) as previously described [14]. Mature osteoclasts were also stained with DAPI to visualize nuclei. For DAPI staining osteoclasts were fixed and stained with phalloidin and then washed and mounted in Vectashied mounting medium containing DAPI.
Data analyses
An unpaired t test was used where appropriate with Welch's correction. Two-way ANOVA was used with post hoc Bonferroni-corrected tests to assess the effect of genotype, CSF1 treatment and the interaction of the two where indicated in the text or figure legends. Data presented are the M±SD. The error bars in figures reflect SE. P < 0.05 was considered significant.
Results
LIMK1−/− mice have significantly reduced BMD
LIMK1−/− mice were weaned without difficulty, had normal tooth eruption and grew at a rate comparable to LIMK1 heterozygous animals. Eight to nine week-old knock out and heterozygous mice were scanned by PIXimus at three different skeletal sites. The results are summarized in Table 2. LIMK1−/− mice evidenced trends towards reduced bone mass at all skeletal sites. This trend was statistically significant for the total body BMD. LIMK1−/− mice showed a 5 % reduction in total body BMD compared to controls (p = 0.03).
Table 2. BMD determined by PIXImus in LIMK1+/− and LIMK1−/− mice.
| n | Age (wks) | Body weight (g) | Femur (g/cm2) | Spine (g/cm2) | Total body (g/cm2) | |
|---|---|---|---|---|---|---|
| LIMK1+/− | 16 | 8.6 | 23.7±3.61 | 0.0670±0.00745 | 0.0512±0.00304 | 0.0447±0.00228 |
| LIMK1−/− | 16 | 8.3 | 22.7±3.44 | 0.0623±0.00601 | 0.0493±0.00270 | 0.0428±0.00214 |
| p value | 0.3 | 0.4 | 0.06 | 0.06 | 0.03* |
p = 0.03 for total body BMD, LIMK1+/− vs. LIMK1−/− mice.
LIMK1−/− mice have dramatically reduced trabecular bone mass
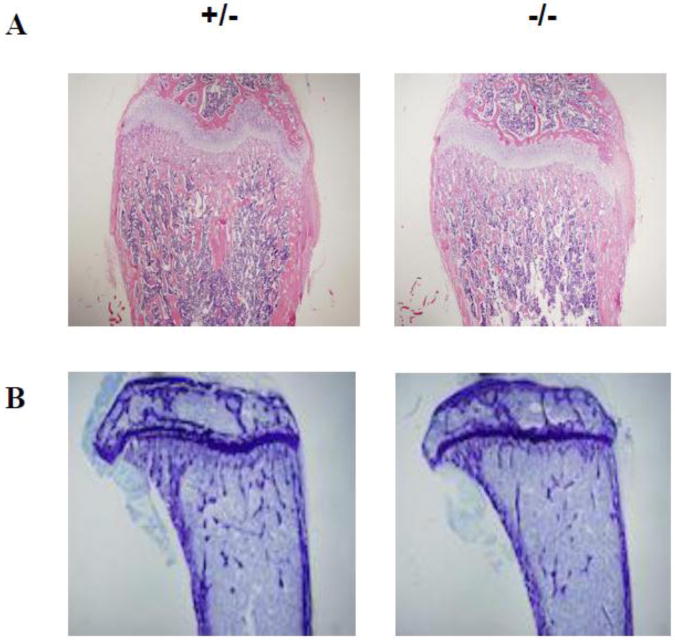
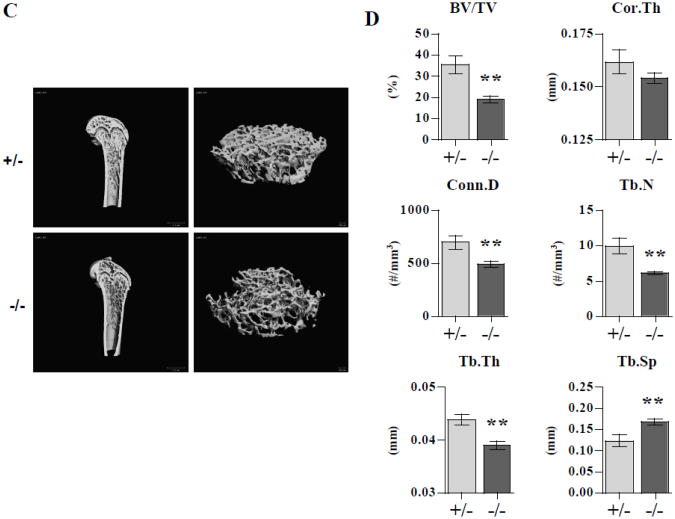
Histologic evaluation and H&E staining of femurs from LIMK1−/− vs. LIMK1+/− mice showed slightly thinner corticies and more substantially reduced trabecular bone mass in the knock out animals (Figs. 2A and 2B). When quantified by microCT analysis, the femoral diaphyses of LIMK1−/− mice were slightly thinner than those of LIMK1+/− mice, but the change was not statistically significant (0.154±0.0086 vs. 0.162±0.0204 mm, p = 0.25, LIMK1−/− vs. LIMK1+/−; Figs. 2A and 2B, right two panels compared to the left two panels and Fig. 2D, upper right panel). In contrast, trabecular bone volume was significantly reduced in LIMK1−/− mice compared to LIMK1+/− animals and all parameters of trabecular microarchitecture were significantly altered, as well (Fig. 2A and 2B, right two panels compared to the left two panels and Fig. 2D, left three panels and lower right two panels). Specifically, trabecular bone volume fraction was reduced nearly 46 % (19.0±4.63 vs. 35.4±15.0 %, p = 0.003), and the number (6.15±0.86 vs. 9.94±3.91 #/mm3, p = 0.007), thickness (0.039±0.0027 vs. 0.044±0.0035 mm, p = 0.001) and connectivity (489.9±111.6 vs. 696.9±221.8 #/mm3, p = 0.01) of the trabeculi were all significantly reduced in LIMK1−/− mice compared with heterozygous controls. The trabecular spacing was greater in LIMK1−/− mice (0.168±0.0028 vs. 0.123±0.046 mm, p = 0.01, LIMK1−/− vs. LIMK1+/−).
Figure 2. Histology and microCT analyses of femurs from LIMK1+/− and LIMK1−/− mice.
A: Low power H&E stains of femur cross-sections from LIMK1+/− and LIMK1−/− mice. B: Low power histologic photomicrographs of femur cross-sections from LIMK1+/− and LIMK1−/− mice. C: 3-D reconstructed μCT images of the distal half of the femur (left) and of just the femoral trabecular compartment (right) of LIMK1+/− and LIMK1−/− mice. D: Quantification of trabecular and cortical bone morphometric parameters as assessed by μCT in LIMK1+/− (gray bars) and LIMK1−/− mice (black bars) (n = 12, each group). ** = p < 0.01 for BV/TV, Conn.D, Tb.Th, Tb.N and Tb.Sp in LIMK1+/− vs. LIMK1−/− mice. The difference in mean Cor.Th was not significant.
LIMK1−/− mice have reduced osteoblast numbers but normal numbers of osteoclasts in vivo
To characterize the cellular basis for the osteopenic phenotype of the LIMK1−/− mice, we performed histomorphometric analyses using trabecular bone from the proximal tibia as described in the Methods. As shown in Table 3, all parameters of osteoblast function were significantly diminished in LIMK1−/− mice compared to LIMK1+/− animals. The number of osteoblasts per total area (N.Ob/TAR) was reduced by 37 % (p = 0.0001). Osteoblast surface per bone surface (Ob.S/BS) was reduced by 31 % (p = 0.0003) and osteoid surface (OS/BS) was reduced by 23 % (p = 0.0007). In contrast, the number of osteoclasts per total area (N.Oc/TAR), osteoclast surface per bone surface (Oc.S/BS) and the number of osteoclasts per bone perimeter (N.Oc/BPm) were not significantly different between the two groups of mice (Table 3). The mineral apposition rate (LIMK1+/− vs. LIMK1−/−; 1.17±0.31 vs. 1.27±0.15 μm/d; p=NS) and bone formation rate normalized to bone surface (LIMK1+/− vs. LIMK1−/−; 180.9±81.3 vs. 184.9±38.6 μm3/μm2/d; p=NS) were not different between the two genotypes,
Table 3. Histomorphometric parameters LIMK1+/− and LIMK1−/− mice.
| n | BV/TV (%) | OS/BS (%) | Ob.S/BS (%) | N.Ob/TAR (/mm2) | Oc.S/BS (%) | N.Oc/TAR (/mm2) | N.OC/BPm (/mm) | |
|---|---|---|---|---|---|---|---|---|
| LIMK1+/− | 27 | 20.3±6.0 | 38.4±8.1 | 24.5±7.2 | 262.9±84.4 | 5.4±2.4 | 17.7±9.0 | 1.7±0.8 |
| LIMK1−/− | 24 | 15.4±4.9 | 29.5±9.9 | 16.9±6.4 | 165.0±82.7 | 6.6±2.9 | 19.6±10.1 | 2.2±1.0 |
| p value | 0.003 | 0.0007 | 0.0003 | 0.0001 | 0.1 | 0.5 | 0.06 |
LIMK1−/− osteoblasts have normal in vitro proliferative capacity
Since OB number was reduced in the LIMK1−/− mice, we wondered if the proliferative capacity of these cells was impaired. Primary calvarial OBs were prepared from LIMK1+/− and LIMK1−/− animals and seeded at an initial density of 5 × 10⁴. Cell number was quantified over the next five days as described above. As shown in Table 4, there was no statistically significant effect of genotype on the number of OBs over the 5 days of the experiment when analyzed by 2-way ANOVA.
Table 4. In vitro proliferation rates of LIMK1+/− and LIMK1−/− osteoblasts.
| Day: | 0 | 1 | 2 | 3 | 4 | 5 |
|---|---|---|---|---|---|---|
| LIMK-1−/− : | 5.0* | 6.9±0.7 | 12.7+1.5 | 16.3+1.9 | 19.1+2.0 | 26.4+2.8 |
| LIMK-1+/− : | 5.0 | 5.5±0.6 | 11.0+1.0 | 13.4+1.5 | 16.2+1.7 | 22.2+3.0 |
| p value | NS by 2-way ANOVA | |||||
= cell number × 104
LIMK1−/− osteoclast precursors have normal in vitro proliferative capacity
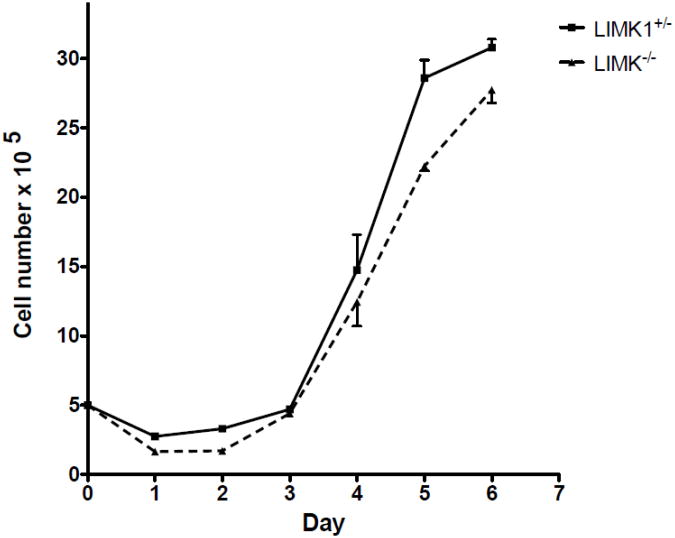
To determine if the genetic absence of LIMK1 affected the proliferative capacity of osteoclast precursors, osteoclast progenitors were isolated from LIMK1−/− and LIMK1+/− animals as detailed above and cell counts performed serially over 6 days. As shown in Fig. 3 there was no significant difference in the rate of precursor proliferation when cultured in the presence of 100 ng/ml CSF1 (p=NS by 2-way ANOVA).
Figure 3. Equivalent proliferative rates of LIMK1+/− and LIMK1−/− osteoclast precursors.
Proliferative rate of osteoclast precursors isolated from LIMK1+/− (solid line and square symbols) and LIMK1−/− mice (dotted line and triangular symbols) and cultured in vitro for 6 days. There was no difference in the proliferative rate based on genotype.
LIMK1 is expressed at equivalent levels in osteoblasts and osteoclasts Tissue-specific expression levels for LIMK 1 have been previously reported
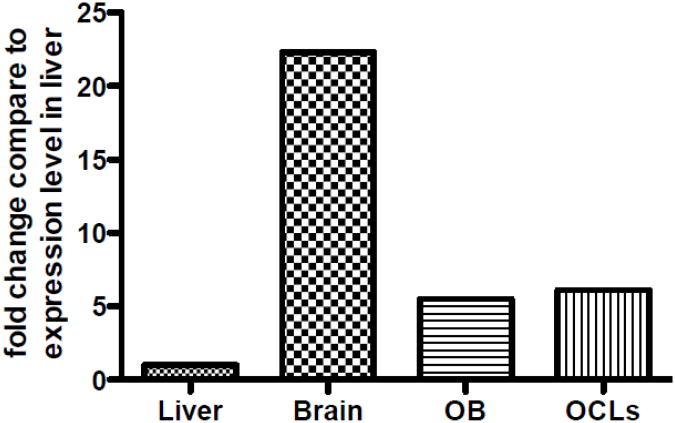
Bernard et al. and Foletta et al. found that LIMK1 is highly expressed in brain [32, 33]. Foletta et al. also found expression in lung, testis, uterus, ovaries, thymus and heart [33]. Neither investigator examined expression in bone. Importantly, Liu et al. have reported high-level expression of LIMK1 in bone [34, 35]. We analyzed expression of LIMK1 in wild-type osteoblasts and osteoclasts and compared expression in these cells to the expression in brain and liver also isolated from wild-type animals. As shown in Fig. 4 when compared to the level of LIMK1 transcript expression in liver (used as a frame of reference), LIMK 1 expression was 22fold higher in brain; while expression levels were 5.5-fold higher in osteoblasts and 6.1-fold higher in osteoclast-like cells.
Figure 4. Relative expression of LIMK1 in osteoblasts and osteoclasts.
Relative expression of LIMK1 in osteoblasts and osteoclasts compared to the level of expression in liver, which was used as the frame of reference. Thus, compared to liver, expression levels of LIMK1 are 5.5-fold higher in osteoblasts and 6.1-fold higher in osteoclasts. Expression in brain is 22-fold higher than in liver.
Reduced numbers of osteoblast progenitor cells in LIMK1−/− mice
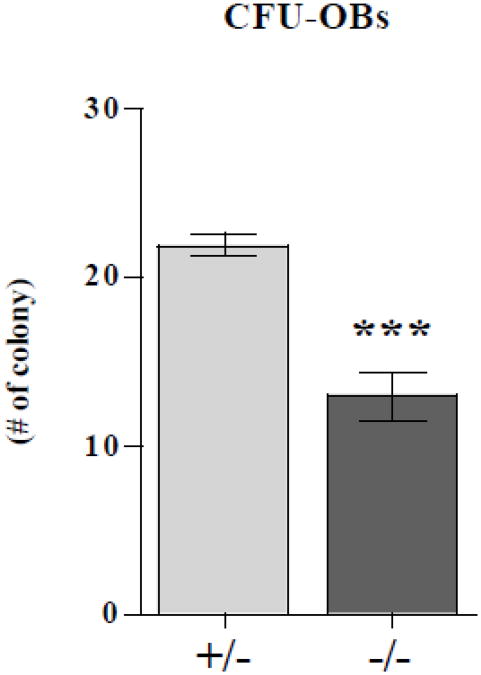
The observed reduction in OB number seen in the LIMK1−/− mice could reflect impaired differentiation or a reduction in the number of OB progenitors since it appears that there was no defect in proliferative capacity at least in vitro. To explore the latter possibility, we quantified the number of the CFU-OBs present in the marrow of LIMK1−/− mice and heterozygous controls. After 10 days in culture in the presence of ascorbic acid and β-glycerophosphate, there were significantly fewer CFU-OBs in the cultures of bone marrow stromal cells prepared from knock out mice compared to the cultures from heterozygous mice (12.9±6.87 vs. 21.9±3.29 #/dish, p < 0.0001) (Fig. 5).
Figure 5. Reduced numbers of CFU-OBs in LIMK−/− mice.
The number of osteoblast colony forming units (CFU-OBs) in bone marrow from LIMK1+/− (gray bar) and LIMK1−/− (black bar) mice. Two separate assays with nine replicates per assay were averaged. ***= p < 0.05 for LIMK1+/− vs. LIMK1−/−.
LIMK1−/− osteoblasts have reduced mineralizing capacity in vitro
To assess OB function in LIMK1−/− mice, OBs isolated from neonatal calvariae of knock out and heterozygous controls were grown to confluence at which point β-glycerophosphate was added to the media. Fourteen days later the cultures were either stained using the Von Kossa protocol, extracted for calcium and phosphorus measurements or used to isolate RNA. As shown in Fig. 6A, there was significantly less Von Kossa staining in cultures prepared from LIMK1−/− mice compared to the cultures from control mice. This difference was quantified by directly measuring the amount of the calcium and phosphorus present in the cell layer after 14 days in culture. There was significantly less calcium in the LIMK1−/− OB cultures than in the control cultures (15.3±3.83 vs. 22.1±1.36 mg/dl; LIMK1−/− vs. LIMK1+/−; p = 0.04). There was a trend toward a lower phosphorus content in the knock out cultures although the difference did not reach to statistical significance (10.0±1.50 vs. 12.3±0.569 mg/dl; LIMK1−/− vs. LIMK1+/−; p = 0.07; Fig. 6B). We also evaluated expression levels of runx2 and alkaline phosphatase by qPCR in the mineralizing cultures at day 14. Consistent with the notion that there is impaired OB differentiation in the absence of LIMK1, transcripts for both molecular markers were significantly lower in the cultures of knock out animals. In both instances the level expression was reduced by more than 50 % (runx2: 0.501±0.110 vs. 1.10±0.115, p = 0.007; ALP: 0.486±0.0643 vs. 1.05±0.168, p = 0.03; LIMK1−/− vs. LIMK1+/−, respectively; Fig. 6C).
Figure 6. LIMK1−/− osteoblasts have impaired mineralization capacity.
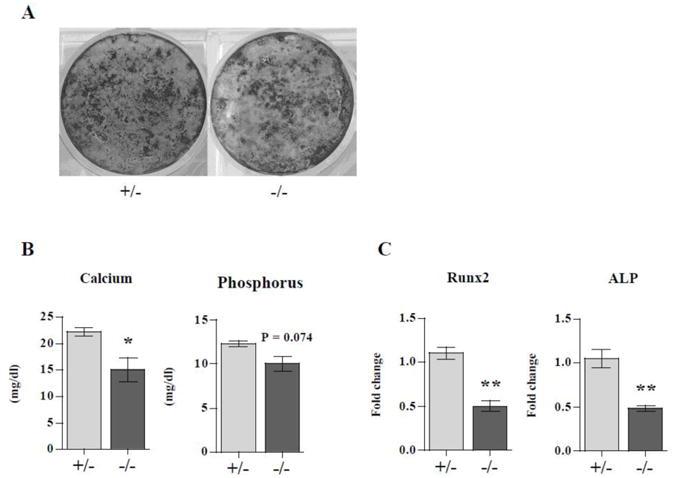
Neonatal calvarial osteoblasts isolated from LIMK1+/− or LIMK1−/− mice were grown to confluence and then treated with 10mM ß-glycerophosphate for 2 weeks. A: Von Kossa staining of cultures from LIMK1+/− and LIMK1−/− mice after 2 weeks of treatment with ß-glycerophosphate. Note reduced staining in the LIMK1−/− cultures. B: Cultures treated with ß-glycerophosphate for 2 weeks after reaching confluence were extracted and calcium phosphorus content quantified or used to prepare RNA for qPCR analyses. Note that the calcium and phosphorus content of the cell layer extracted from the LIMK1−/− mice was lower than in control animals. C: Results of qPCR for runx2 and alkaline phosphatase expression in cell layers of osteoblasts from LIMK1−/− and +/− mice treated for 2 weeks with ß-glycerophosphate. Note that the level of runx2 and alkaline phosphatase expression are significantly lower in LIMK1−/− cultures than in LIMK1+/− cultures. * = p < 0.05; ** = p < 0.01.
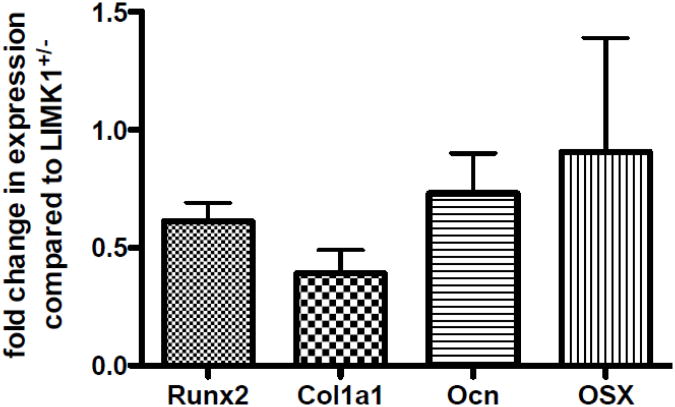
Since CFU-Ob number was reduced in LIMK1−/− animals and in vitro mineralization was defective, this suggests that the number of committed osteoblasts is reduced in the genetic absence of LIMK1 or that there is a cell autonomous defect in osteoblast differentiation in addition to precursor lineage commitment. To determine if there is evidence of a cell autonomous defect in LIMK1−/− osteoblasts, the level of expression of runx2, collagen 1, osterix and osteocalcin were quantified in freshly isolated primary calvarial osteoblasts isolated from LIMK−/− animals. As shown in Fig. 7, there was a significant reduction in expression levels for runx2, collagen 1, and osteocalcin with a trend toward a reduced expression level of osterix.
Figure 7. Makers of differentiation are reduced in LIMK1−/− osteoblasts.
Reduced levels of expression of run2, collagen 1, osteocalcin and osterix in LIMK−/− osteoblasts. The level of expression in LIMK1+/- osteoblasts was set equal to 1.0 for this analysis. These data represent average data from two independent cell preparations.
Marrow fat is not increased in the LIMK 1 −/− animals
Since there is a defect in osteoblastogenesis in the genetic absence of LIMK 1, this raised the possibility that lineage allocation of bone marrow mesenchymal stem cells could be altered. One potential consequence of such a change would be an increase in marrow fat. However, when the marrow fat content, measured as a percent of bone area, was quantified, we found no significant difference between animals of the two different genotypes (LIMK1+/− vs. LIMK1−/− ; 4.4±0.3% vs. 4.4±0.4% p=NS).
LIMK1−/− osteoclasts exhibit an exaggerated spreading response to CSF1 but actin ring formation is normal
As noted in the Introduction, suppressing LIMK1 in vitro has been variously reported to either reduce or increase actin remodeling depending on the cell type. Since OC function requires actin turnover, we were interested in determining if there was altered cytoskeletal remodeling in the LIMK1−/− osteoclast. We therefore examined the spreading response to CSF1 in mature OCs isolated from knock out and control animals. As shown in Fig. 8A, OCs isolated from LIMK1−/− mice showed significantly greater spreading response to CSF1 than the cells from control animals. There was no significant change in cell area in either LIMK1+/− and LIMK1−/− OCs after 15 minutes and 30 minutes of vehicle treatment (0.41±9.03 % vs. −5.1±22.9 % at 15′ and −0.53±12.0 % vs. −8.0±21.4 % at 30′; LIMK1+/− vs. LIMK1−/− respectively; p = N.S. for both). Following treatment with CSF1, LIMK1−/− OCs showed significantly greater increases in cell area at both 15 and 30 minutes (29.3±37.1 % vs. 61.8±71.0 %, p < 0.01 at 15′ and 35.1±45.5 % vs. 66.0±77.0 %, p < 0.05 at 30′; LIMK1+/− vs. LIMK1−/− respectively; Fig. 8B).
Figure 8. Exaggerated cytoskeletal remodeling in response to CSF1 in LIMK1−/− osteoclasts.
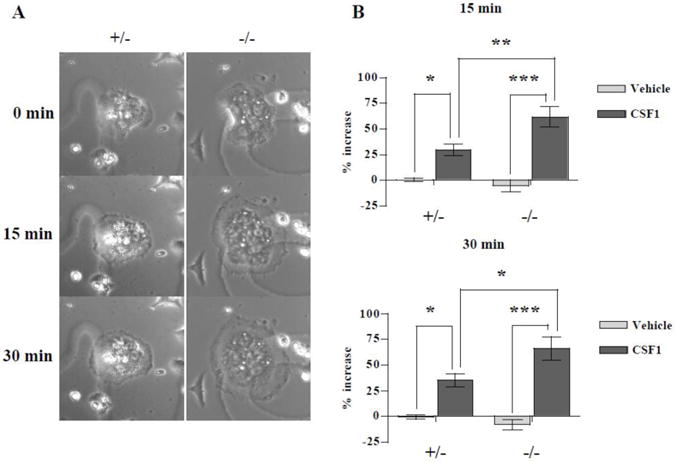
A: Mature osteoclasts freshly isolated from neonatal LIMK1+/− or LIMK1−/− mice were treated with 2.5 nM CSF1 for 30 minutes. Representative photomicrographs taken at baseline (0 min), 15 minutes and 30 minutes are shown. B: Mean % change in the cell area after vehicle (gray bar) or 2.5 nM CSF1 (black bar) treatment for 15 (upper panel) or 30 minutes (lower panel) in LIMK1+/−(left columns) or LIMK1−/− (right columns) osteoclasts. Data are averaged from 3 separate assays (n = 28 for LIMK1+/−- vehicle treatment, 18 for LIMK1−/− - vehicle treatment, 45 for LIMK1+/− -CSF1 treatment and 49 for LIMK1−/− - CSF1 treatment). * = p < 0.05; ** = p < 0.01; *** = p < 0.001.
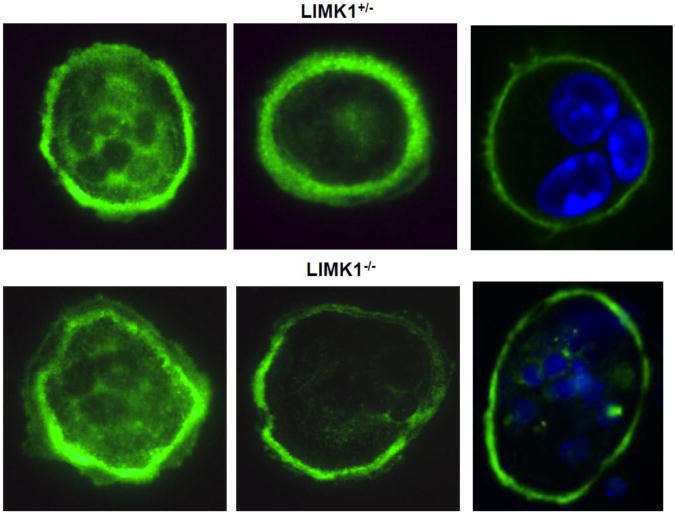
To determine whether the genetic absence of LIMK1 affects actin rings, actin ring formation was determined in 67 freshly isolated LIMK1+/− mature osteoclasts and 65 LIMK1−/− cells. In two separate experiments, on average, 67% of LIMK1+/− osteoclasts had actin ring formation while 58% of cells isolated from LIMK1−/− had actin ring formation. The actin rings appeared normal in both LIMK1+/− and LIMK1−/− mature osteoclasts when imaged by phalloidin staining and confocal microscopy (Fig. 9)
Figure 9. Actin ring appearance is normal in LIMK1−/− OCs.
Mature osteoclasts freshly isolated from in LIMK1+/− (upper panel) or LIMK1−/− (lower panel) mice were stained with phalloidin. Some cells were also stained with DAPI to better visualize the nuclei (two right hand panels).
Cofilin phosphorylation is reduced in LIMK1−/− osteoclasts but not in osteoblasts
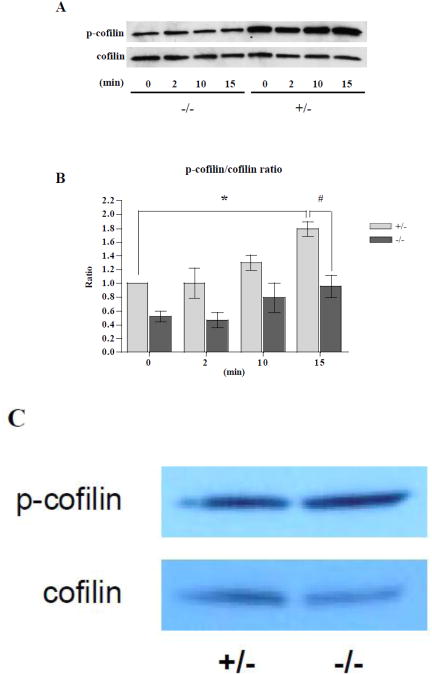
Cofilin is the only known substrate for LIMK1. We therefore wondered whether the genetic absence of LIMK1 would lead to a change in the level of phospho-cofilin in bone cells. As noted, phospho-cofilin is the inactive form of cofilin. We therefore examined the level of phospho-cofilin in OCLs before and at 2, 10 and 15 minutes after treatment with 2.5 nM CSF1. As shown in Fig. 10A (Time 0, LIMK1−/− vs. LIMK1+/−), prior to treatment with CSF1, the cellular levels of phospho-cofilin were lower in OCLs prepared from LIMK1−/− mice as compared to the levels observed in cells prepared from control animals. Following CSF1 treatment, the ratio of phospho-cofilin to total cofilin rose progressively in both LIMK1−/− and LIMK1+/− OCLs (Fig. 10B). However, when analyzed by two-way ANOVA, the increase in the ratio of phospho-cofilin/total cofilin was significantly greater in LIMK1+/− OCLs than LIMK1−/− cells (p < 0.05). Further, as compared to the baseline value, the ratio of phospho-cofilin/total cofilin was significantly greater in LIMK1+/− OCLs treated with CSF1 for 15 minutes (p = 0.04). In contrast, by post hoc analysis, there was not a significant difference between baseline and 15 min CSF1-treatment values for the phospho-cofilin/total cofilin ratio in the LIMK1−/− OCLs. By post hoc analysis the ratio of phospho-cofilin/total cofilin after 15 min of CSF1 treatment was significantly greater in LIMK1+/− OCLs than in LIMK1−/− OCLs (p = 0.03). Unlike the findings in OCLs, there was no significant change in the extent of phospho-cofilin staining in OBs isolated from LIMK−/− animals compared to cells from controls (Fig. 10C).
Figure 10. Phosphocofilin levels are reduced in LIMK1−/− OCLs but normal in LIMK1−/− OBs.
A: Representative western blot of whole cell lysates prepared from LIMK1−/− OCLs (left four lanes) or LIMK1+/− OCLs (right four lanes) at the indicated times after 2.5 nM CSF1 treatment, and probed for phospho-cofilin (upper panel) or total-cofilin (lower panel). B: Graphic summary of the phospho-cofilin/cofilin ratio quantified by the densitometric analyses of three separate western blots (LIMK1+/− = gray bar; LIMK1−/− = black bar). * = p < 0.05 for 0 min vs. 15 min after CSF1 treatment of LIMK1+/− OCLs by post hoc analysis; # = p < 0.05 for LIMK1+/− vs. LIMK1−/− OCLs at 15min. C: Representative western blot of whole cell lysates prepared from LIMK1−/+ OBs (left) or LIMK1−/− OBs (right), and probed for phospho-cofilin (upper panel) or total-cofilin (lower panel).
The actin cytoskeleton is normal in LIMK1−/− osteoblasts
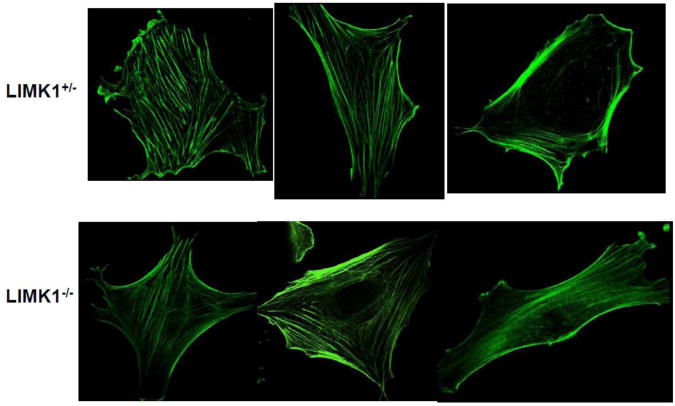
There were no substantive differences in the pattern or extent of polymerized actin as assessed by phalloidin staining, when LIMK1−/− OBs were compared to control OBs (Fig. 11).
Figure 11. LIMK1−/− OBs have a normal actin cytoskeleton.
The pattern of F-actin staining in calvarial osteoblasts isolated from LIMK1+/− (upper panels) or LIMK1−/− (lower panels) mice. There is no apparent difference in the extent or pattern of F-actin staining. The images presented are representative of the staining pattern in 16 LIMK1+/− and 15 LIMK1−/− cells that were examined.
The bone resorptive activity of LIMK1−/− osteoclasts is augmented in vitro
To determine if the alterations in cytoskeletal remodeling and cofilin phosphocycling observed in LIMK1−/− OCLs result in changes in the functional activity of these cells, we evaluated the in vitro resorptive activity of OCLs prepared from LIMK1−/− mice and control mice. OCLs, generated by co-culturing identical numbers of BMCs and OBs obtained from either LIMK1+/− or LIMK1−/− animals on collagen-coated plates, were replated onto dentine slices and resorptive activity quantified by measuring the concentration of CTX in the media after 72 hours. As shown in Fig. 12A, there was a significantly greater concentration of CTX in the media of LIMK1−/− OCLs after 72 hours when compared with the concentration of CTX in the media conditioned by the LIMK1+/− OCLs (1.2±0.2 vs. 1.0±0.2 ng/ml, p = 0.02). Consistent with these in vitro data, serum CTX tended to be higher in the LIMK1−/− animals compared to the LIMK1+/− controls although the change did not reach statistical significance (40±8 vs. 29±3 pg/ml, p = 0.1, n= 6 per group).
Figure 12. LIMK1−/− OCLs have increased resorptive activity.
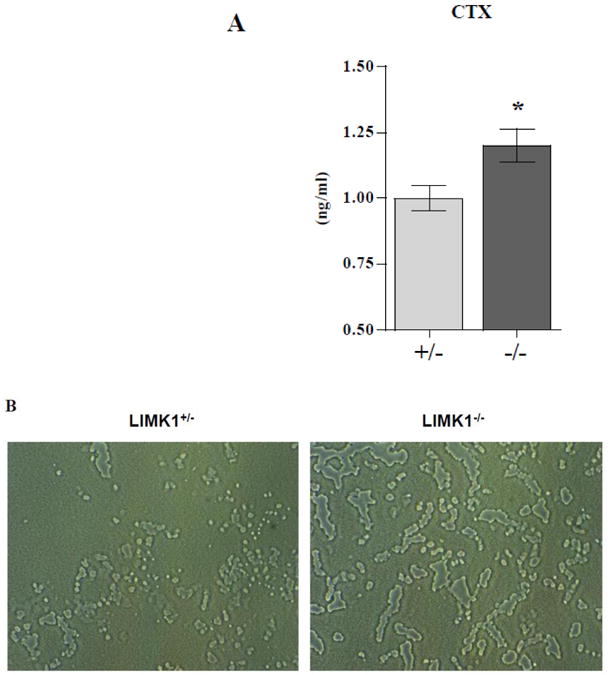
A. The concentration of CTX (ng/ml) in the media of OCLs prepared from LIMK1+/− (gray bar) or LIMK1−/− (black bar) mice incubated on dentine slices for 72 hrs. The concentration of CTX in media alone was below the detection limit of the assay and the data were averaged from three separate assays. * = p < 0.05 for LIMK1+/− vs. LIMK1−/− culture media. B. Appearance of Osteo Assay plates resorbed by LIMK1+/− (left panel) or LIMK1−/− (right panel) OCLs. C. Quantification of area resorbed by LIMK1+/− and LIMK1−/− OCLs (** = p<0.002).
As another assessment of bone resorbing activity LIMK1+/− and LIMK1−/− OCLs were evaluated in a pit-forming assay. As illustrated in Fig. 12A and quantified in Fig. 12B, and completely consistent with the dentine slice data, LIMK1−/− OCLs resorbed significantly more surface area of Osteo Assay plates than did LIMK1+/− and LIMK1−/− OCLs (Fig. 12 C; 949783±103,848 vs. 466,373±90091 pixels, p<0.002).
Discussion
The principal finding of this manuscript is that LIMK1−/− mice exhibit an osteopenic phenotype associated with defects in both osteoblast and osteoclast function. LIMK1 is a serine/threonine kinase that phosphorylates cofilin at position Ser3, which inhibits the ability of cofilin to sever F-actin. Depolymerizing actin is a requisite step during cytoskeletal remodeling. LIMK1 is a key downstream target for growth factors and cytokines that induce cell spreading, contraction and motility [36]. LIMK1 has also been shown to regulate microtubular assembly in human endothelial cells [37]. In addition to its role in regulating the actin/microtuble cytoskeleton, LIMK1 has been shown to influence a pool of actin that is required for normal trans-Golgi function. In the absence of LIMK vesicle budding and export from the trans-Golgi is abnormal [38]. Recent data also indicate that LIMK1 may directly interact with p57KIP2 an inhibitor of cyclins [23, 24]. It is noteworthy that mutations in p57KIP2 cause the human disease Beckwith Weidemann syndrome which is associated with skeletal abnormalities and p57KIP2 knock out mice also have skeletal abnormalities [39][40]. Finally, LIMK1 has recently been shown to regulate the activity of matrix metalloproteinases, including MMP1 and MMP9 in a prostatic cancer cell line [40]. Which of these several functions of LIMK1 is responsible for the skeletal phenotype of the LIMK knock out mouse is not entirely clear.
Both histologic, H&E stains and microCT analyses demonstrated a marked reduction in trabecular bone mass with significantly reduced values for the trabecular bone fraction (BV/TV), trabecular number (Tb.N) and thickness (Tb.Th), and an accompanying increase in trabecular spacing (Tb.Sp). There was also a trend towards a reduction in cortical thickness, although this did not reach statistical significance. Histomorphometric analyses demonstrated a dramatic impairment in osteoblast activity, whether assessed by osteoblast number or osteoid thickness. Consistent with this, in vitro studies showed a significant reduction in the number of CFU-OBs in the marrow of LIMK1−/− animals. There have been previous reports indicating that disruption of cytoskeletal architecture in mesenchymal stem cells leads to a diminution in osteoblastogenic potential of these cells with an augmentation in fat cell development [6]. Consistent with this Zayzafoon et al. reported reduced expression of osteoblast markers in cells in which the cytoskeleton was disrupted [5]. Although we did not find evidence for gross dysregulation of the osteoblast actin cytoskeleton in the absence of LIMK1, in keeping with the findings of Zayzafoon et al., osteoblasts isolated from LIMK1−/− animals showed significantly reduced expression of key differentiation markers including, run2, collagen 1 and osteocalcin with a trend towards reduced levels of osterix. Taken together with our CFU-OB, these findings indicate that not only are there reduced numbers of osteoblast progenitors but there is an intrinsic defect in the differentiation program of osteoblasts themselves including the terminal steps of differentiation. Thus, as shown in Figure 5, the ability of osteoblasts to mineralize in vitro was significantly impaired in osteoblasts cultured from LIMK1−/− mice. The extent of mineralization as judged by the calcium and phosphorus content of 2-week, post-confluent LIMK1−/− osteoblast cultures and Von Kossa staining was significantly lower than that in heterozygous controls. This was mirrored by a reduction in the expression of runx2 and alkaline phosphatase.
In contrast to the defect in osteoblastogenesis, osteoclastogenesis appeared to be normal in the genetic absence of LIMK1. Thus, osteoclast surface per bone surface (Oc.S/BS) and the number of osteoclasts per total area (N.Oc/TAR) were not statistically significant between knock out and control mice. We posited that the absence of LIMK1 would result in higher levels of active (non-phosphorylated) cofilin in osteoclasts and indeed that proved to be the case. Basal levels of phospho-cofilin were reduced by nearly 50% in LIMK1−/− OCLs. With a larger pool of activated cofilin, it seemed plausible that the response to growth factors, which induce cytoskeletal remodeling, would be augmented. This too was observed, since LIMK1−/− osteoclasts spread considerably more rapidly and to a greater extent following treatment with CSF1 than did cells isolated from their heterozygous counterparts. This was mirrored by a significant impairment in the ability of CSF1 to induce phosphorylation of cofilin in the LIMK1−/− mice. We have previously shown that CSF1, through a PI3 kinase-dependent pathway, activates Rac1 [12]. Rac1 in turn is known to activate Pak1, which has as its principal intracellular target, LIMK1. The apparent paradoxical increase in levels of phospho-cofilin induced by CSF1 at the same time that the growth factor stimulates cell-spreading is likely explained by actin treadmilling. Actin treadmilling refers to activation of cofilin at the leading edge of lamellipodia and its inactivation both more proximally in that lamellipodia as well as at the trailing edge of a moving cell. These two processes, cofilin activation and inactivation, occur in different subcelluar compartments and, in a coordinated but still poorly understood fashion, regulate the cytoskeleton during cell shape change and motility. Nonetheless, the overall global effect of CSF1 appears to be to increase the amount of cellular phospho-cofilin. This reaction is impaired in the absence of LIMK1. The impaired phosphorylation of cofilin was associated with a marked augmentation in the rate of cell-spreading in response to CSF1. It is well recognized that cytoskeletal remodeling is an absolutely essential component of the bone-resorbing process. Osteoclasts that have defective actin remodeling, such as osteoclasts from Src−/− mice, have markedly impaired resorptive activity [41][42]. In contrast, LIMK1−/− osteoclasts had more robust cytoskeletal remodeling, which was consistent with the observed increase in the resorptive capacity of these cells. Thus, LIMK1−/− OCLs resorbed significantly greater amounts of dentine than did LIMK1+/− cells and were more active in a pit assay. This presumably reflects, in part, more rapid actin remodeling. There did not appear to be alterations in osteoclast survival in LIMK1−/− mice, since osteoclast number was not changed in these animals.
Our findings of functional changes in both osteoblasts and osteoclasts is supported by the fact that the level of expression of LIMK1 is reasonably high in both cell types and interestingly the level of expression in osteoclasts and osteoblasts is nearly the same (Fig. 4). Despite a posited role for LIMK in regulating p57KIP2, we did not observed changes in the proliferative rates of osteoblasts or osteoclast progenitors when cultured in vitro.
In summary, our data indicate a significant and hitherto unappreciated role for LIMK1 in skeletal homeostasis. The genes that affect bone mass remain poorly understood. Given the significant impact LIMK1 has on both normal osteoblast and osteoclast function, it may be of interest to determine if allelic variants in this gene play a role in the heritability of this trait.
Highlights.
LIMK1−/− mice have significantly reduced bone mass.
This is associated with impaired osteoblast function and enhanced osteoclast activity.
Levels of phosphocofilin are reduced in LIMK1−/− osteoclasts.
LIMK1−/− osteoclasts evidence increased cytoskeletal remodeling in response to CSF1.
The number of CFU-OB is reduced in LIMK1−/− marrow and the ability of knock out osteoblasts to mineralize is impaired.
Acknowledgments
This work was supported by NIH grants DE12459 and DK45228, and by the Yale Core Center for Musculoskeletal Disorders, a NIAMS-funded P30 Core Center (AR46032).
Footnotes
The authors have nothing to disclose.
Publisher's Disclaimer: This is a PDF file of an unedited manuscript that has been accepted for publication. As a service to our customers we are providing this early version of the manuscript. The manuscript will undergo copyediting, typesetting, and review of the resulting proof before it is published in its final citable form. Please note that during the production process errors may be discovered which could affect the content, and all legal disclaimers that apply to the journal pertain.
Contributor Information
Tsutomu Kawano, Email: tsutomu@ortho.med.kyshu-u-a..jp, Department of Medicine, Yale School of Medicine.
Meiling Zhu, Email: meiling.zhu@yale.edu, Department of Medicine, Yale School of Medicine.
Nancy Troiano, Email: nancy.troiano@yale.edu, Department of Orthopaedics and Rehabilitation, Yale School of Medicine.
Mark Horowitz, Email: mark.horowitz@yale.edu, Department of Orthopaedics and Rehabilitation, Yale School of Medicine.
Jessica Bian, Email: jessica.bian@nyumc.org, Department of Internal Medicine, Yale School of Medicine.
Caren Gundberg, Email: caren.gundberg@yale.edu, Department of Orthopaedics and Rehabilitation, Yale School of Medicine.
Katarzyna Kolodziejczak, Email: kmkolodziejczak@gmail.com, Department of Medicine, Yale School of Medicine.
Karl Insogna, Department of Medicine, Yale School of Medicine.
References
- 1.Arnsdorf EJ, Tummala P, Kwon RY, Jacobs CR. Mechanically induced osteogenic differentiation - the role of RhoA, ROCKII and cytoskeletal dynamics. J Cell Sci. 2009;122:546–53. doi: 10.1242/jcs.036293. [DOI] [PMC free article] [PubMed] [Google Scholar]
- 2.Slomiany P, Baker T, Elliott ER, Grossel MJ. Changes in motility, gene expression and actin dynamics: Cdk6-induced cytoskeletal changes associated with differentiation in mouse astrocytes. J Cell Biochem. 2006;99:635–46. doi: 10.1002/jcb.20966. [DOI] [PubMed] [Google Scholar]
- 3.Wang W, Mouneimne G, Sidani M, Wyckoff J, Chen X, Makris A, Goswami S, Bresnick AR, Condeelis JS. The activity status of cofilin is directly related to invasion, intravasation, and metastasis of mammary tumors. J Cell Biol. 2006;173:395–404. doi: 10.1083/jcb.200510115. [DOI] [PMC free article] [PubMed] [Google Scholar]
- 4.Meyers VE, Zayzafoon M, Gonda SR, Gathings WE, McDonald JM. Modeled microgravity disrupts collagen I/integrin signaling during osteoblastic differentiation of human mesenchymal stem cells. J Cell Biochem. 2004;93:697–707. doi: 10.1002/jcb.20229. [DOI] [PubMed] [Google Scholar]
- 5.Zayzafoon M, Gathings WE, McDonald JM. Modeled microgravity inhibits osteogenic differentiation of human mesenchymal stem cells and increases adipogenesis. Endocrinology. 2004;145:2421–32. doi: 10.1210/en.2003-1156. [DOI] [PubMed] [Google Scholar]
- 6.Meyers VE, Zayzafoon M, Douglas JT, McDonald JM. RhoA and cytoskeletal disruption mediate reduced osteoblastogenesis and enhanced adipogenesis of human mesenchymal stem cells in modeled microgravity. J Bone Miner Res. 2005;20:1858–66. doi: 10.1359/JBMR.050611. [DOI] [PMC free article] [PubMed] [Google Scholar]
- 7.Takeuchi Y, Suzawa M, Kikuchi T, Nishida E, Fujita T, Matsumoto T. Differentiation and transforming growth factor-beta receptor down-regulation by collagen-alpha2beta1 integrin interaction is mediated by focal adhesion kinase and its downstream signals in murine osteoblastic cells. J Biol Chem. 1997;272:29309–16. doi: 10.1074/jbc.272.46.29309. [DOI] [PubMed] [Google Scholar]
- 8.Toma CD, Ashkar S, Gray ML, Schaffer JL, Gerstenfeld LC. Signal transduction of mechanical stimuli is dependent on microfilament integrity: identification of osteopontin as a mechanically induced gene in osteoblasts. J Bone Miner Res. 1997;12:1626–36. doi: 10.1359/jbmr.1997.12.10.1626. [DOI] [PubMed] [Google Scholar]
- 9.McBeath R, Pirone DM, Nelson CM, Bhadriraju K, Chen CS. Cell shape, cytoskeletal tension, and RhoA regulate stem cell lineage commitment. Dev Cell. 2004;6:483–95. doi: 10.1016/s1534-5807(04)00075-9. [DOI] [PubMed] [Google Scholar]
- 10.Sanjay A, Houghton A, Neff L, DiDomenico E, Bardelay C, Antoine E, Levy J, Gailit J, Bowtell D, Horne WC, Baron R. Cbl associates with Pyk2 and Src to regulate Src kinase activity, alpha(v)beta(3) integrin-mediated signaling, cell adhesion, and osteoclast motility. J Cell Biol. 2001;152:181–95. doi: 10.1083/jcb.152.1.181. [DOI] [PMC free article] [PubMed] [Google Scholar]
- 11.Destaing O, Sanjay A, Itzstein C, Horne WC, Toomre D, De Camilli P, Baron R. The tyrosine kinase activity of c-Src regulates actin dynamics and organization of podosomes in osteoclasts. Mol Biol Cell. 2008;19:394–404. doi: 10.1091/mbc.E07-03-0227. [DOI] [PMC free article] [PubMed] [Google Scholar]
- 12.Sakai H, Chen Y, Itokawa T, Yu KP, Zhu ML, Insogna K. Activated c-Fms recruits Vav and Rac during CSF-1-induced cytoskeletal remodeling and spreading in osteoclasts. Bone. 2006;39:1290–301. doi: 10.1016/j.bone.2006.06.012. [DOI] [PubMed] [Google Scholar]
- 13.Wang Y, Lebowitz D, Sun C, Thang H, Grynpas MD, Glogauer M. Identifying the relative contributions of Rac1 and Rac2 to osteoclastogenesis. J Bone Miner Res. 2008;23:260–70. doi: 10.1359/jbmr.071013. [DOI] [PubMed] [Google Scholar]
- 14.Itokowa T, Zhu ML, Troiano N, Bian J, Kawano T, Insogna K. Osteoclasts lacking Rac2 have defective chemotaxis and resorptive activity. Calcif Tissue Int. 2011;88:75–86. doi: 10.1007/s00223-010-9435-3. [DOI] [PMC free article] [PubMed] [Google Scholar]
- 15.Hall A. Rho GTPases and the actin cytoskeleton. Science. 1998;279:509–14. doi: 10.1126/science.279.5350.509. [DOI] [PubMed] [Google Scholar]
- 16.Bamburg JR. Proteins of the ADF/cofilin family: essential regulators of actin dynamics. Annu Rev Cell Dev Biol. 1999;15:185–230. doi: 10.1146/annurev.cellbio.15.1.185. [DOI] [PubMed] [Google Scholar]
- 17.Edwards DC, Sanders LC, Bokoch GM, Gill GN. Activation of LIM-kinase by Pak1 couples Rac/Cdc42 GTPase signalling to actin cytoskeletal dynamics. Nat Cell Biol. 1999;1:253–9. doi: 10.1038/12963. [DOI] [PubMed] [Google Scholar]
- 18.Yang N, Higuchi O, Ohashi K, Nagata K, Wada A, Kangawa K, Nishida E, Mizuno K. Cofilin phosphorylation by LIM-kinase 1 and its role in Rac-mediated actin reorganization. Nature. 1998;393:809–12. doi: 10.1038/31735. [DOI] [PubMed] [Google Scholar]
- 19.Arber S, Barbayannis FA, Hanser H, Schneider C, Stanyon CA, Bernard O, Caroni P. Regulation of actin dynamics through phosphorylation of cofilin by LIM-kinase. Nature. 1998;393:805–9. doi: 10.1038/31729. [DOI] [PubMed] [Google Scholar]
- 20.Maekawa M, Ishizaki T, Boku S, Watanabe N, Fujita A, Iwamatsu A, Obinata T, Ohashi K, Mizuno K, Narumiya S. Signaling from Rho to the actin cytoskeleton through protein kinases ROCK and LIM-kinase. Science. 1999;285:895–8. doi: 10.1126/science.285.5429.895. [DOI] [PubMed] [Google Scholar]
- 21.Ding Y, Milosavljevic T, Alahari SK. Nischarin inhibits LIM kinase to regulate cofilin phosphorylation and cell invasion. Mol Cell Biol. 2008;28:3742–56. doi: 10.1128/MCB.01832-07. [DOI] [PMC free article] [PubMed] [Google Scholar]
- 22.Yoshioka K, Foletta V, Bernard O, Itoh K. A role for LIM kinase in cancer invasion. Proc Natl Acad Sci U S A. 2003;100:7247–52. doi: 10.1073/pnas.1232344100. [DOI] [PMC free article] [PubMed] [Google Scholar]
- 23.Yokoo T, Toyoshima H, Miura M, Wang Y, Iida KT, Suzuki H, Sone H, Shimano H, Gotoda T, Nishimori S, Tanaka K, Yamada N. p57Kip2 regulates actin dynamics by binding and translocating LIM-kinase 1 to the nucleus. J Biol Chem. 2003;278:52919–23. doi: 10.1074/jbc.M309334200. [DOI] [PubMed] [Google Scholar]
- 24.Vlachos P, Joseph B. The Cdk inhibitor p57(Kip2) controls LIM-kinase 1 activity and regulates actin cytoskeleton dynamics. Oncogene. 2009;28:4175–88. doi: 10.1038/onc.2009.269. [DOI] [PubMed] [Google Scholar]
- 25.Tapia T, Ottman R, Chakrabarti R. LIM kinase1 modulates function of membrane type matrix metalloproteinase 1: implication in invasion of prostate cancer cells. Mol Cancer. 2011;10:6. doi: 10.1186/1476-4598-10-6. [DOI] [PMC free article] [PubMed] [Google Scholar]
- 26.Meng Y, Zhang Y, Tregoubov V, Janus C, Cruz L, Jackson M, Lu WY, MacDonald JF, Wang JY, Falls DL, Jia Z. Abnormal spine morphology and enhanced LTP in LIMK-1 knockout mice. Neuron. 2002;35:121–33. doi: 10.1016/s0896-6273(02)00758-4. [DOI] [PubMed] [Google Scholar]
- 27.Kawano T, Troiano N, Adams DJ, Wu JJ, Sun BH, Insogna K. The anabolic response to parathyroid hormone is augmented in Rac2 knockout mice. Endocrinology. 2008;149:4009–15. doi: 10.1210/en.2008-0034. [DOI] [PMC free article] [PubMed] [Google Scholar]
- 28.Parfitt AM, Drezner MK, Glorieux FH, Kanis JA, Malluche H, Meunier PJ, Ott SM, Recker RR. Bone histomorphometry: standardization of nomenclature, symbols, and units. Report of the ASBMR Histomorphometry Nomenclature Committee. J Bone Miner Res. 1987;2:595–610. doi: 10.1002/jbmr.5650020617. [DOI] [PubMed] [Google Scholar]
- 29.Horowitz MC, Fields A, DeMeo D, Qian HY, Bothwell AL, Trepman E. Expression and regulation of Ly-6 differentiation antigens by murine osteoblasts. Endocrinology. 1994;135:1032–43. doi: 10.1210/endo.135.3.7520861. [DOI] [PubMed] [Google Scholar]
- 30.Insogna K, Tanaka S, Neff L, Horne W, Levy J, Baron R. Role of c-Src in cellular events associated with colony-stimulating factor-1-induced spreading in osteoclasts. Mol Reprod Dev. 1997;46:104–8. doi: 10.1002/(SICI)1098-2795(199701)46:1<104::AID-MRD16>3.0.CO;2-2. [DOI] [PubMed] [Google Scholar]
- 31.Suda T, Jimi E, Nakamura I, Takahashi N. Role of 1 alpha,25-dihydroxyvitamin D3 in osteoclast differentiation and function. Methods Enzymol. 1997;282:223–35. doi: 10.1016/s0076-6879(97)82110-6. [DOI] [PubMed] [Google Scholar]
- 32.Bernard O, Ganiatsas S, Kannourakis G, Dringen R. Kiz-1, a protein with LIM zinc finger and kinase domains, is expressed mainly in neurons. Cell growth&differentiation : the molecular biology journal of the American Association for Cancer Research. 1994;5:1159–71. [PubMed] [Google Scholar]
- 33.Foletta VC, Moussi N, Sarmiere PD, Bamburg JR, Bernard O. LIM kinase 1, a key regulator of actin dynamics, is widely expressed in embryonic and adult tissues. Experimental cell research. 2004;294:392–405. doi: 10.1016/j.yexcr.2003.11.024. [DOI] [PubMed] [Google Scholar]
- 34.Liu X, Yu X, Zack DJ, Zhu H, Qian J. TiGER: a database for tissue-specific gene expression and regulation. BMC bioinformatics. 2008;9:271. doi: 10.1186/1471-2105-9-271. [DOI] [PMC free article] [PubMed] [Google Scholar]
- 35.Liu X. TIGER: A database for tissue-specific gene expression and regulation. doi: 10.1186/1471-2105-9-271. url: http://bioinfo.wilmer.jhu.edu/tiger/db_gene/LIMK1-index.html. [DOI] [PMC free article] [PubMed]
- 36.Scott RW, Olson MF. LIM kinases: function, regulation and association with human disease. J Mol Med. 2007;85:555–68. doi: 10.1007/s00109-007-0165-6. [DOI] [PubMed] [Google Scholar]
- 37.Gorovoy M, Niu J, Bernard O, Profirovic J, Minshall R, Neamu R, Voyno-Yasenetskaya T. LIM kinase 1 coordinates microtubule stability and actin polymerization in human endothelial cells. J Biol Chem. 2005;280:26533–42. doi: 10.1074/jbc.M502921200. [DOI] [PMC free article] [PubMed] [Google Scholar]
- 38.Salvarezza SB, Deborde S, Schreiner R, Campagne F, Kessels MM, Qualmann B, Caceres A, Kreitzer G, Rodriguez-Boulan E. LIM kinase 1 and cofilin regulate actin filament population required for dynamin-dependent apical carrier fission from the trans-Golgi network. Mol Biol Cell. 2009;20:438–51. doi: 10.1091/mbc.E08-08-0891. [DOI] [PMC free article] [PubMed] [Google Scholar]
- 39.Swanger WJ, Roberts JM. p57KIP2 targeted disruption and Beckwith-Wiedemann syndrome: is the inhibitor just a contributor? Bioessays. 1997;19:839–42. doi: 10.1002/bies.950191002. [DOI] [PubMed] [Google Scholar]
- 40.Takahashi K, Nakayama K. Mice lacking a CDK inhibitor, p57Kip2, exhibit skeletal abnormalities and growth retardation. J Biochem. 2000;127:73–83. doi: 10.1093/oxfordjournals.jbchem.a022586. [DOI] [PubMed] [Google Scholar]
- 41.Lowe C, Yoneda T, Boyce BF, Chen H, Mundy GR, Soriano P. Osteopetrosis in Src-deficient mice is due to an autonomous defect of osteoclasts. Proc Natl Acad Sci U S A. 1993;90:4485–9. doi: 10.1073/pnas.90.10.4485. [DOI] [PMC free article] [PubMed] [Google Scholar]
- 42.Insogna KL, Sahni M, Grey AB, Tanaka S, Horne WC, Neff L, Mitnick M, Levy JB, Baron R. Colony-stimulating factor-1 induces cytoskeletal reorganization and c-src-dependent tyrosine phosphorylation of selected cellular proteins in rodent osteoclasts. J Clin Invest. 1997;100:2476–85. doi: 10.1172/JCI119790. [DOI] [PMC free article] [PubMed] [Google Scholar]


