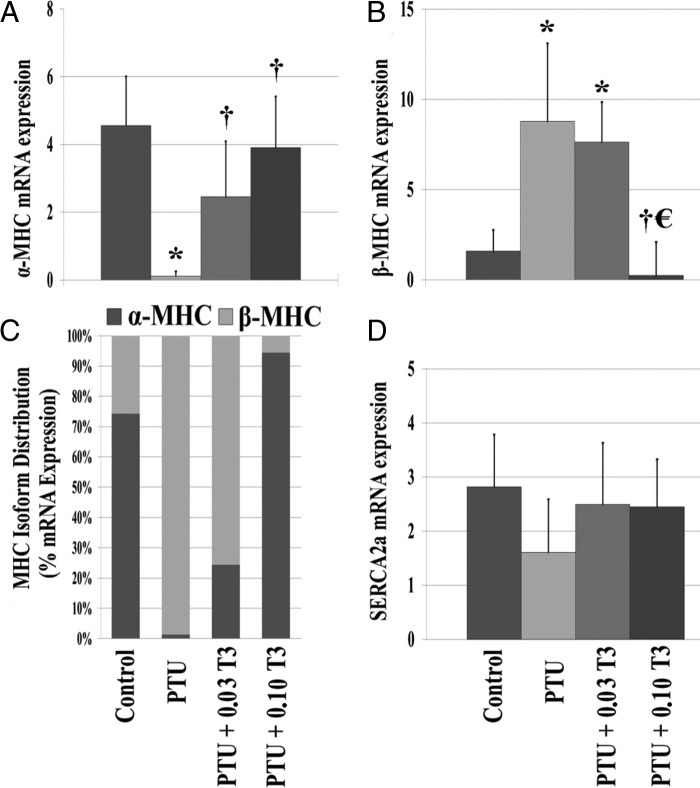
Figure 3.
Reexpression of fetal genes. Values represented as means (SD) or percentage. A–D, α-MHC (A); β-MHC (B); relative MHC isoform distribution as a % of total MHC expression (C). The percentage was calculated as the ratio of either α- or β-MHC divided by the total MHC expression (α- + β-MHC) using their 2[−Avg.(Delta(Ct)] values; sarco(endo)plasmic reticulum Ca2+-ATPase expression (D) (n = 5–6/group). *, P < .05 vs control; †, P < .05 vs PTU; €, P < .05 vs PTU + 0.03 T3.

